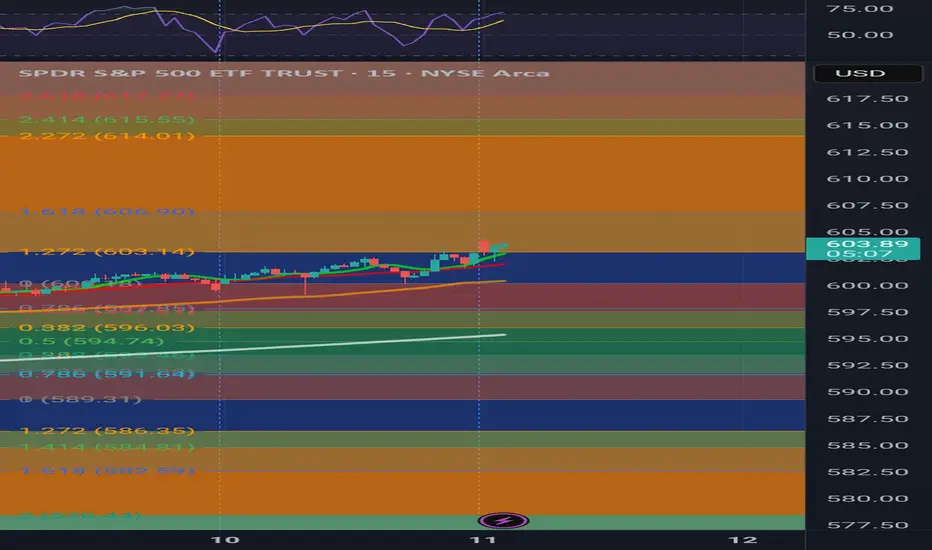
607 EOD Non uclidean Mathematics Dual Band Fibbonaci📍 SPY is now accelerating through the 1.272–1.618 active band.
📍 607 is the next harmonic projection level on the mirrored Non-Euclidean spectrum.
📍 No rejection at Passive ⇒ continuation through Active ⇒ magnet to 607.
Volatility
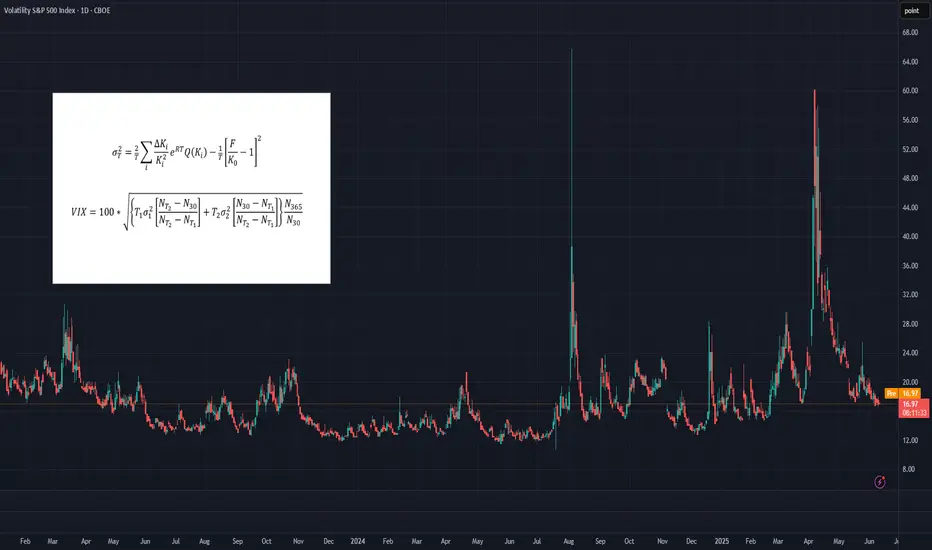
Trading the VIXOften dubbed the "fear index," the VIX gauges SPX options' implied volatility, typically rising during equity market declines and vice versa. It quantifies investor anxiety, demand for hedging, and market stress, crucial for traders and risk managers seeking to measure turbulence.
The VIX calculates a constant 30-day implied volatility using SPX options expiring over the next two months. Unlike simple weighted averages of equity indices, its methodology is more complex, involving implied variance calculation for the two nearest monthly expirations across all strikes. For detailed formulas, refer to the introductory chart or visit the CBOE’s official VIX Index page.
While the VIX Index itself isn’t tradable, exposure can be gained through VIX futures or exchange-traded products (ETPs) like VXX, UVXY, and SVXY. However, these instruments come with their own unique risks, pricing behaviors, and structural nuances, which can make directional VIX trading considerably more complex than it might initially appear.
What You Need to Know About Implied Volatilities
• In calm or uptrending markets, the volatility curve typically slopes upward (contango), indicating higher implied volatility with longer maturities.
• In declining or turbulent markets, the curve can invert, sloping downward (backwardation), as shorter-term implied volatilities rise sharply.
• This pattern can be observed, comparing VIX9D, VIX, and VIX3M against the SPX. In stable markets: VIX9D < VIX < VIX3M. In stressed markets, this relationship may reverse. The VIX9D and VIX3M are the 9-day respectively 3-month equivalent to the 30-day VIX.
What You Need to Know About VIX Futures
• When the volatility spot curve is in contango, the VIX futures curve will also slope upward.
• In backwardation, the futures curve slopes downward, reflecting heightened short-term volatility and short-term volatility spikes.
• While in contango, VIX futures "roll down the curve," meaning that—independent of changes in volatility—futures tend to decline in value over time.
• In backwardation, the opposite occurs: futures "roll up the curve," potentially rising in value over time even without volatility changes.
• VIX futures’ responsiveness to VIX Index movements – the beta of VIX futures against the VIX index - declines with longer expirations; front-month futures may react to 70-80% of VIX changes, compared to 40-60% for third or fourth-month futures.
Key Consequences for Traders
• Directional trading of VIX futures can be strongly influenced by the shape of the futures curve.
• Contango in low-VIX environments creates strong headwinds for long VIX futures positions, caused by the “roll-down-effect”.
• Conversely, backwardation in high-VIX environments creates headwinds for short positions.
• These effects are more pronounced in front-month contracts, making timing (entry and exit) for directional trades critical.
• There's a trade-off in directional strategies: front-month futures offer greater exposure to VIX movements but suffer more from negative roll effects.
How to Trade VIX Futures
• Due to these structural challenges, directional VIX futures trading is difficult and requires precision.
• A more effective approach is to trade changes in the shape of the futures curve using calendar spreads (e.g., long VX1, short VX2). This reduces the impact of roll effects on individual contracts.
• In low-VIX, contango conditions, a rising VIX typically leads to VX1 increasing faster than VX2, widening the VX1–VX2 spread—an opportunity for spread trading.
• While VX1 may initially suffer more from roll-down than VX2, this can reverse as the VIX rises and VX1 begins to “roll up,” especially when VIX > VX1 but VX1 < VX2.
• The opposite dynamic applies in high-VIX, backwardation environments.
• More broadly, changes in the shape of the futures curve across the first 6–8 months can be profitably traded using calendar spreads. Roll-effects and the declining beta-curve can also be efficiently traded.
How to capture the Roll-Down-Effect
One of the more popular VIX-trading strategies involves capturing the roll-down effect,, while the curve is in contango. It is a positive carry strategy that is best applied during calm or uptrending market conditions. Here’s a straightforward set of guidelines to implement the Roll-Down-Carry trade:
• Entry Condition: Initiate during calm market conditions, ideally when VIX9D-index is below VIX-index (though not guaranteed).
• Choosing Futures: Use VX1 and VX2 for calendar spreads if VX1 has more than 8-10 trading days left; otherwise, consider VX2 and VX3.
• Spread Analysis: Short VX1 and long VX2 if VX1–VIX spread is larger than VX2–VX1; otherwise, VX2 and VX3 may be suitable.
• Contango Effect: VX1’s roll-down effect typically outweighs VX2’s during contango.
• Relative Beta: VX1 shows higher reactivity to VIX changes compared to VX2, mimicking a slight short position on VIX.
• Exit Strategy: Use spread values, take-profit (TP), and stop-loss (SL); consider exiting if VIX9D crosses over VIX.
________________________________________
Conclusion
Directional trading of the VIX Index—typically through futures—demands precise timing and a good understanding of the volatility curve. This is because curve dynamics such as contango and backwardation can create significant headwinds or tailwinds, often working against a trader’s position regardless of the VIX’s actual movement. As a result, purely directional trades are not only difficult to time but also structurally disadvantaged in many market environments.
A more strategic and sustainable approach is to trade calendar spreads, which involves taking offsetting positions in VIX futures of different maturities. This method helps neutralize the impact of the curve's overall slope and focuses instead on relative changes between expirations. While it doesn’t eliminate all risk, calendar spread trading significantly reduces the drag from roll effects and still offers numerous opportunities to profit from shifts in market sentiment, volatility expectations, and changes in the shape of the futures curve.
What else can be done with VIX instruments
VIX indices across different maturities (VIX9D, VIX, VIX3M), along with VIX futures, offer valuable insights and potential entry signals for trading SPX or SPX options. In Part 2 of the Trading the VIX series, we’ll explore how to use these tools—along with VIX-based ETPs—for structured trading strategies.
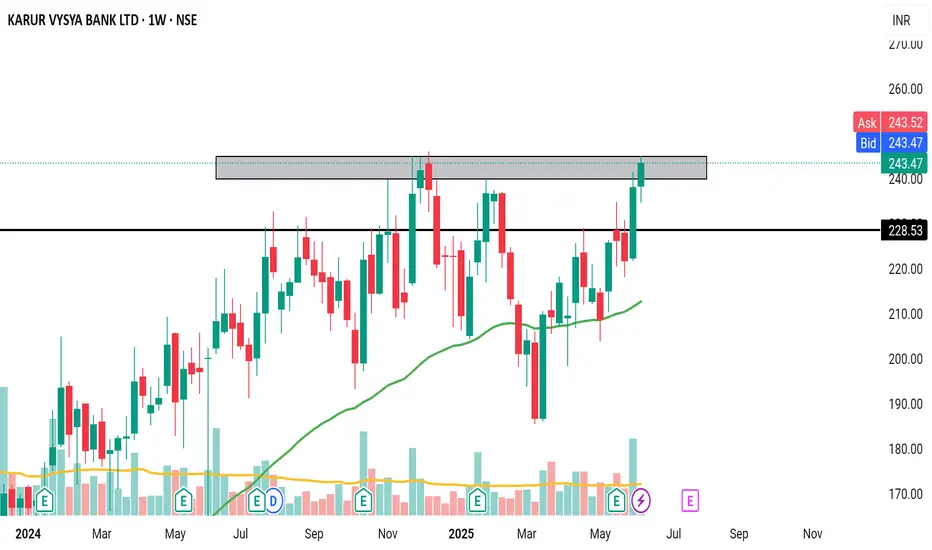
Karur ko watchlist mein rakhna jaroorOn the verge of breaking all time high. Good fundamentals, good volumes.
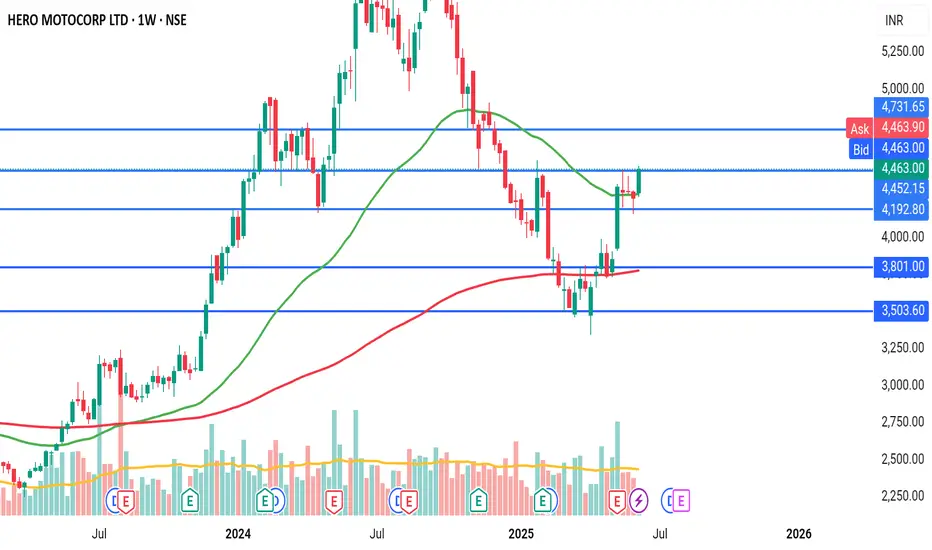
Hero starts heroingBreakout of inverted head and shoulder pattern in weekly timeframe, with big green candle and above average volume.
NQ Power Range Report with FIB Ext - 6/11/2025 SessionCME_MINI:NQM2025
- PR High: 21983.75
- PR Low: 21937.00
- NZ Spread: 104.75
Key scheduled economic events:
08:30 | CPI (Core|YoY|MoM)
10:30 | Crude Oil Inventories
13:00 | 10-Year Note Auction
Session Open Stats (As of 12:25 AM 6/11)
- Session Open ATR: 380.78
- Volume: 24K
- Open Int: 272K
- Trend Grade: Neutral
- From BA ATH: -3.4% (Rounded)
Key Levels (Rounded - Think of these as ranges)
- Long: 22096
- Mid: 20383
- Short: 19246
Keep in mind this is not speculation or a prediction. Only a report of the Power Range with Fib extensions for target hunting. Do your DD! You determine your risk tolerance. You are fully capable of making your own decisions.
BA: Back Adjusted
BuZ/BeZ: Bull Zone / Bear Zone
NZ: Neutral Zone

LONG entry @ $316.05 | 09:55am + LONG exit @ $321.05 | 11:20amToday goes to show what happens when you follow structure, and let mat and probability take care of the outcome. An exceptional day, remember... consistent green days are a reflection of discipline, not luck.
Some more pertinent details re price action today. I hit an algo entry at 9:55, MM's did a hard shake out of the weak hands, dropped the price significantly but there was no strong bearish FVG even though price dropped 3 points which gave me conviction to hold the position which paid off very well. There was no significant short move and the price rallied to a weekly high.
Polyanonymous.

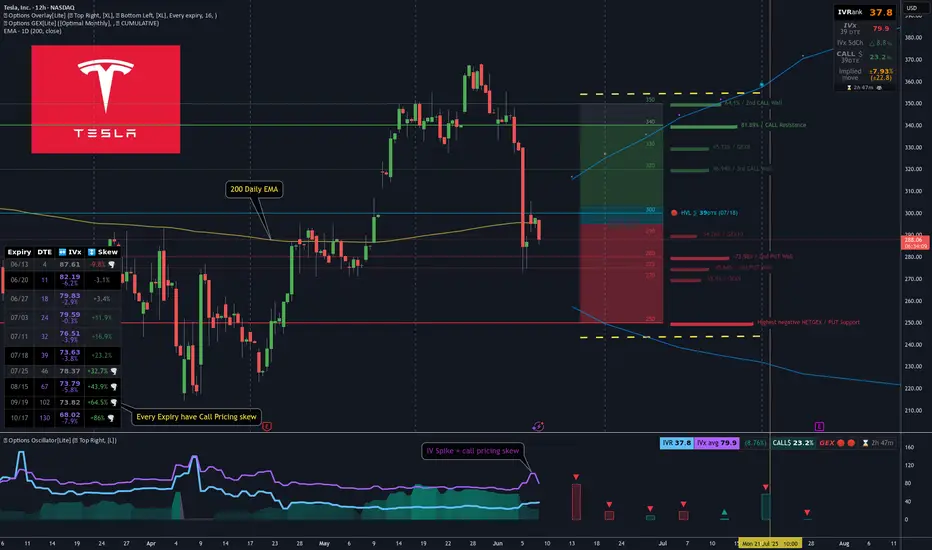
[GEX] TSLA Breakdown & Options Trade Idea for 39DTELast week, TSLA dropped hard, likely due to political tensions. Let’s not forget — just a month ago, their EVs were showcased at the White House entrance...
In the span of 30 hours, TSLA fell -22% (see red line below), while SPX barely reacted. Why? Because both realized and implied volatility dropped — remember VIX is around 17/18.
This sharp TSLA drop already seemed overdone, which helped fuel the +5% bounce on Friday.Most TSLA options positions are near-term and still show negative sentiment — but further expirations grow increasingly bullish.
🔍 If you use options GEX matrix , you’ll see the bearish hedging flow gradually turns more neutral-to-bullish.
Most cumulative support/resistance zones lie between 250–340, with spot currently just under the chop zone.
🧠 TSLA Trade Idea
It’s been a while since I posted a neutral Iron Condor, but TSLA might be an exception.
Despite last week’s IV spike, call pricing skew still dominates across expirations — as seen in our Options Overlay indicator.This tells me the market doesn’t fear TSLA crashing below 200. So, I’m aiming to capture premium on the July 18th expiry without day trading.
I’m thinking of something simple, well-manageable in either direction.To refine leg placement, I use visual GEX zones.
🐻🔴 Downside:
Strong put support at 250
Gradual support layers up to 280
🐂 🟢 Upside:
Target area: 340–350 for the July 18 expiry.
📅 Closing the Trade:I'll consider closing or adjusting at 21 DTE or when 50% max profit is hit — per TastyTrade’s studies.
🔁 Rolling Plan:IF short delta on one side drops below ~14 and price pulls away, I’ll roll the untested side to collect more credit.
🧑🏫 I’ll likely post trade management live in Discord for educational purposes.
~~~~~~~~~~~~~~~~~~~~~~~~~~~~~~~~~~~
🦋 Bonus Idea: TSLA Broken Wing Butterfly
If you think TSLA has more downside, a Put Broken Wing Butterfly — like the one shown in my previous YT video — is also a great way to structure this trade using the same GEX levels.
There’s no single way to use Gamma Exposure — it’s the most actionable hedging signal we have. Combine it with your knowledge of strategies and you can trade almost any scenario.
One thing’s for sure — this market moves faster than ever.A single day of internal conflict wiped -22% off TSLA…The next morning, the market already moved on, so as always:
Trade Safe Out There!
NQ Power Range Report with FIB Ext - 6/10/2025 SessionCME_MINI:NQM2025
- PR High: 21847.75
- PR Low: 21823.25
- NZ Spread: 55.0
No key scheduled economic events
Session Open Stats (As of 12:25 AM 6/10)
- Session Open ATR: 393.42
- Volume: 27K
- Open Int: 269K
- Trend Grade: Neutral
- From BA ATH: -3.2% (Rounded)
Key Levels (Rounded - Think of these as ranges)
- Long: 22096
- Mid: 20383
- Short: 19246
Keep in mind this is not speculation or a prediction. Only a report of the Power Range with Fib extensions for target hunting. Do your DD! You determine your risk tolerance. You are fully capable of making your own decisions.
BA: Back Adjusted
BuZ/BeZ: Bull Zone / Bear Zone
NZ: Neutral Zone

Gold – A Selling Opportunity in the Next 2 DaysAnalysis:
Volume & RSI Signals: The recent surge in trading volume, combined with overbought RSI levels (both on daily and 4H charts), suggests a potential pullback.
Target Price: Gold could retrace toward $3250 in the short term.
Action:
Consider selling or taking partial profits if long.

Not much of an idea and probably gonna be wrong put predictionAt this point im just waffling but this is what im looking for (unlikely but my system sees a possibility)

Pines-Capital Trade IdeaThe second chart shows a bullish daily structure with a higher volume range and positive momentum. The first long idea is based on a pullback to the value area high or the 0.5 Fibonacci zone around 0.6498. Should the market test this area and show buyers there, this would be an opportunity for a long entry with a target in the area of the recent high at 0.6538. The stop can be placed slightly below the 0.618 level at 0.6484.
A second long opportunity arises on a breakout above the recent high at 0.6538. If the price breaks above this zone with volume and stabilizes there, a procyclical long can be entered with a target towards 0.6560+ (next psychological level). The stop should be placed just below the breakout level.

Pines-Capital Trade IdeaThe chart shows a bullish daily structure with a higher volume range and positive momentum. The first long idea is based on a pullback to the value area high or the 0.5 Fibonacci zone around 0.6498. Should the market test this area and show buyers there, this would be an opportunity for a long entry with a target in the area of the recent high at 0.6538. The stop can be placed slightly below the 0.618 level at 0.6484.
A second long opportunity arises on a breakout above the recent high at 0.6538. If the price breaks above this zone with volume and stabilizes there, a procyclical long can be entered with a target towards 0.6560+ (next psychological level). The stop should be placed just below the breakout level.

Shopify Escapes Tight ConsolidationShopify has been trapped in a tight range, but now the e-commerce stock may be breaking out.
The first pattern on today’s chart is the falling trendline since May 14 (based on closing prices). SHOP ended Friday above it, which may draw fence-sitters from the sidelines.
Second is the April high of $101.45. Prices tested below that level on May 23 but held. Has old resistance become new support?
Third is the narrowing Bollinger Band Width. Such a volatility squeeze may create potential for prices to expand following a period of compression.
Next, the 8-day exponential moving average (EMA) has stayed above the 21-day EMA. That may reflect short-term bullishness.
Finally, prices are near the rising 200-day simple moving average. That may suggest a longer-term uptrend is still in effect.
Check out TradingView's The Leap competition sponsored by TradeStation.
TradeStation has, for decades, advanced the trading industry, providing access to stocks, options and futures. If you're born to trade, we could be for you. See our Overview for more.
Past performance, whether actual or indicated by historical tests of strategies, is no guarantee of future performance or success. There is a possibility that you may sustain a loss equal to or greater than your entire investment regardless of which asset class you trade (equities, options or futures); therefore, you should not invest or risk money that you cannot afford to lose. Online trading is not suitable for all investors. View the document titled Characteristics and Risks of Standardized Options at www.TradeStation.com . Before trading any asset class, customers must read the relevant risk disclosure statements on www.TradeStation.com . System access and trade placement and execution may be delayed or fail due to market volatility and volume, quote delays, system and software errors, Internet traffic, outages and other factors.
Securities and futures trading is offered to self-directed customers by TradeStation Securities, Inc., a broker-dealer registered with the Securities and Exchange Commission and a futures commission merchant licensed with the Commodity Futures Trading Commission). TradeStation Securities is a member of the Financial Industry Regulatory Authority, the National Futures Association, and a number of exchanges.
TradeStation Securities, Inc. and TradeStation Technologies, Inc. are each wholly owned subsidiaries of TradeStation Group, Inc., both operating, and providing products and services, under the TradeStation brand and trademark. When applying for, or purchasing, accounts, subscriptions, products and services, it is important that you know which company you will be dealing with. Visit www.TradeStation.com for further important information explaining what this means.

Delta Air Lines: Potential BreakoutDelta Air Lines has squeezed into a tight range, and some traders may think it’s breaking out.
The first pattern on today’s chart is the series of lower highs since May 13. DAL closed above that falling trend line last Friday, which could mean the resistance has been overcome.
The move resulted in a bullish outside week, immediately after a bullish inside week. That’s potentially consistent with prices consolidating before moving again.
Bollinger Band Width compression in the lower study may substantiate that view. (Notice the potential volatility squeeze taking shape.)
Next, the airline held a 50 percent retracement of its surge between April 30 and May 12. Does that suggest movement is pointing higher?
Finally, the 8-day exponential moving average (EMA) has stayed above the 21-day EMA. That may also be consistent with a short-term uptrend.
Check out TradingView's The Leap competition sponsored by TradeStation.
TradeStation has, for decades, advanced the trading industry, providing access to stocks, options and futures. If you're born to trade, we could be for you. See our Overview for more.
Past performance, whether actual or indicated by historical tests of strategies, is no guarantee of future performance or success. There is a possibility that you may sustain a loss equal to or greater than your entire investment regardless of which asset class you trade (equities, options or futures); therefore, you should not invest or risk money that you cannot afford to lose. Online trading is not suitable for all investors. View the document titled Characteristics and Risks of Standardized Options at www.TradeStation.com . Before trading any asset class, customers must read the relevant risk disclosure statements on www.TradeStation.com . System access and trade placement and execution may be delayed or fail due to market volatility and volume, quote delays, system and software errors, Internet traffic, outages and other factors.
Securities and futures trading is offered to self-directed customers by TradeStation Securities, Inc., a broker-dealer registered with the Securities and Exchange Commission and a futures commission merchant licensed with the Commodity Futures Trading Commission). TradeStation Securities is a member of the Financial Industry Regulatory Authority, the National Futures Association, and a number of exchanges.
TradeStation Securities, Inc. and TradeStation Technologies, Inc. are each wholly owned subsidiaries of TradeStation Group, Inc., both operating, and providing products and services, under the TradeStation brand and trademark. When applying for, or purchasing, accounts, subscriptions, products and services, it is important that you know which company you will be dealing with. Visit www.TradeStation.com for further important information explaining what this means.

US 500 Index – All Time Highs Back in SightFresh optimism regarding trade negotiations between the US and China, coupled with confirmation on Friday that the US labour market is cooling down slowly and not indicating an imminent US recession, has seen the US 500 index open this morning at 4 month highs, bumping up against the psychological 6000 again, with its all time peak of 6144 (February 19th) back in sight.
Looking forward, this could be a pivotal week for the US 500, with a variety of risk events for traders to consider, all of which may have the potential to impact the direction of risk sentiment into the Friday close.
First up, later today, traders will be eagerly awaiting updates from the second round of trade talks between US and Chinese trade teams, who are tasked with defusing tensions regarding the supply of rare earth minerals and advanced technology.
Then, on Wednesday (CPI 1330 BST) and Thursday (PPI 1330 BST) the next round of US inflation updates for May are released. These could be relevant to traders who have become more sensitive to potential price rises due to the impact of President Trump's trade tariffs. Any surprise deviations from expectations in either of these releases could see an increase in US 500 index volatility.
Putting this all together with any fresh reports outlining progress on trade deals between the US and Japan or the EU, and it could be a volatile week in store. With this in mind, it can be helpful to consider the technical indicators and trends.
Technical Update: Focus on the Bollinger Mid Average
While some may have argued for a slowing in upside momentum of the recent US 500 index advance, price weakness has continued to be limited in both time and extent.
Importantly, as the chart above shows, when short term setbacks in price have recently materialised, it has been the rising Bollinger mid-average that has marked a support focus.
This maintains the potential of a more constructive picture and positive price trend, where buyers have been happy to pay a higher price each time that weakness is seen, and have been able to push the index above previous peaks in price, to new recovery highs.
Of course, there is no guarantee this pattern of higher highs and higher lows in price will extend further, but traders may well be focusing on this type of pattern as having the potential to lead to a more sustained phase of price strength.
What are the potential support and resistance levels that traders may be watching this week for clues to the direction of the next possible price move?
Potential Resistance Levels:
Further evidence that a positive trend in price could still be in place came on Friday, as a new recovery price high at 6017 was posted.
Traders may now be watching how a previous price high at 6049, which was posted on February 24th is defended, as closing breaks may see further attempts to push to higher levels. Such moves could then lead to further price strength towards 6144, the February 19th all-time high.
Potential Support Levels:
Having held and turned price activity higher over previous tests, it may well still be the rising Bollinger mid-average, which currently stands at 5916 that represents a possible support focus this week.
Closes below this level while not confirmation of a more extended phase of price weakness, may see a deeper decline to test 5842, the May 30th session low, even on to the 5742 level, which is equal to the low posted on May 23rd.
The material provided here has not been prepared in accordance with legal requirements designed to promote the independence of investment research and as such is considered to be a marketing communication. Whilst it is not subject to any prohibition on dealing ahead of the dissemination of investment research, we will not seek to take any advantage before providing it to our clients.
Pepperstone doesn’t represent that the material provided here is accurate, current or complete, and therefore shouldn’t be relied upon as such. The information, whether from a third party or not, isn’t to be considered as a recommendation; or an offer to buy or sell; or the solicitation of an offer to buy or sell any security, financial product or instrument; or to participate in any particular trading strategy. It does not take into account readers’ financial situation or investment objectives. We advise any readers of this content to seek their own advice. Without the approval of Pepperstone, reproduction or redistribution of this information isn’t permitted.

NQ Power Range Report with FIB Ext - 6/9/2025 SessionCME_MINI:NQM2025
- PR High: 21820.75
- PR Low: 21730.25
- NZ Spread: 202.25
No key scheduled economic events
Session Open Stats (As of 12:15 AM 6/9)
- Session Open ATR: 406.53
- Volume: 25K
- Open Int: 272K
- Trend Grade: Neutral
- From BA ATH: -4.0% (Rounded)
Key Levels (Rounded - Think of these as ranges)
- Long: 22096
- Mid: 20383
- Short: 19246
Keep in mind this is not speculation or a prediction. Only a report of the Power Range with Fib extensions for target hunting. Do your DD! You determine your risk tolerance. You are fully capable of making your own decisions.
BA: Back Adjusted
BuZ/BeZ: Bull Zone / Bear Zone
NZ: Neutral Zone

iBIT - Weekly Volatility PotentialGood Morning!
Here is my weekly perspective for NASDAQ:IBIT
From when we reviewed last weekend, IV (41.19%) has lowered -2.23% and is entering the week with a 0% IVp. We have been in this pattern of rotating IV and Bi-Weekly volatility trends back and forth as HV10 (29.73%) entering the week has increased +1.49% from it's respective level entering last week. The prediction of what is to happen is contracting as what is actually happening in the short-term is trending up.
Bi-Weekly and Monthly volatility values after being 100% coiled and both putting in new yearly lows a month ago are starting to unwind as they create distance from those exact lows.
Could long-term trending means be on the horizon with quarterly values?
Bi-weekly trends will eventually find it's way back there with monthly not far behind, question is when. Our best advantage is to continue to track the data and ebb and flow with the markets and macro news as it is released.
Looking towards this next week, Our HV10 (29.73%) trending values are still contracting under our monthly HV21 (33.37%) trends, but IV (41.19%) although lowering beyond yearly lows, is reflecting future expansion.
Only time will tell, I think we will see another volume push into this week -- Remember to always be hedged and come back to join me next weekend as we review the charts for what happened VS our expectation!
CHEERS

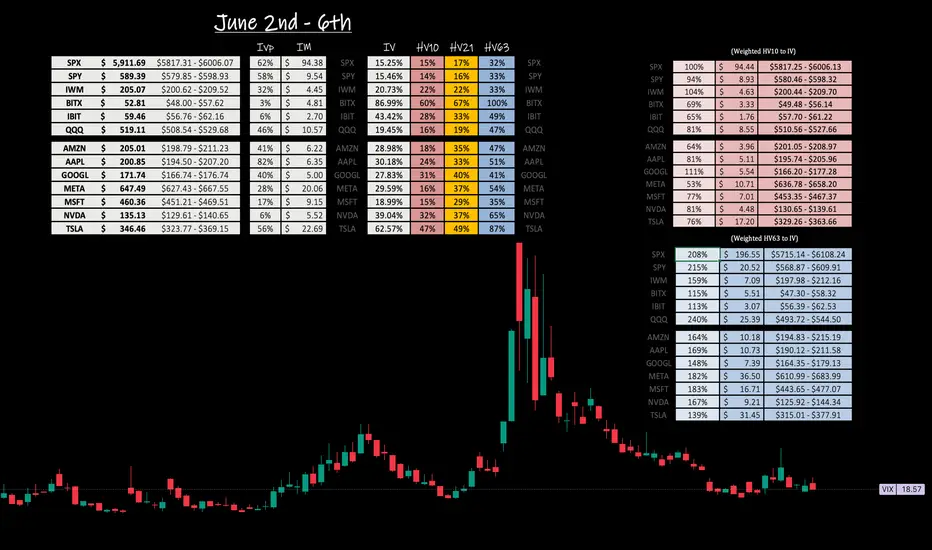
Weekly Volatility Snapshot Volatility, as measured by standard deviation, quantifies market elasticity and provides a level of probability and precision to trade within, that humbles us all.
Last week, the TVC:VIX opened above $21.00 and closed just under $19.00 for a near flat week even for all the eventful action that took place. That being once again, tariff related news with the court of international trade overriding Trump's liberation day, only to have the administration appeal, and the tariffs to be reinstated the following day.
This provided for quite a volatile move, mostly in after hours with everything closing strong to end the month.
As we look towards June starting with next week, just about all indices I track and the magnificent seven are showing near term trending volatility contracting under stated IV, as IV is melting across the board. Notable mention to NASDAQ:NVDA NASDAQ:MSFT NASDAQ:IBIT and CBOE:BITX for all entering the week with great IV value, now let's compare them to their respective trending bi-weekly values to observe what is being predicted to what is happening with near term trending volatility.
NASDAQ:NVDA at a 6% IVp enters the week with an IV of 39.04% -- HV10 (31.70%) is 81% strength of current IV and resonating under monthly values. When you see a large move, that being from the earnings report last week, you will see a massive IV melt to save premium against the PA move due to the beats or misses. With that said, bi-weekly values are just off yearly lows (25.74%) as IV chases it down and i see the underlying as 94.03% coiled for a volatility swing.
NASDAQ:MSFT at a 17% IVp enters the week with an IV of 18.99% -- HV10 (14.55%) is 77% strength of current IV and resonating deeply under monthly values. Bi-weekly yearly lows of 8.56% reflect a coiling of 90.03% at current values.
With both of these, I am looking for a volatility bounce, and regression back to quarterly means. That's where the real fun is and if played right provide excellent opportunity. For further discussion around BITSTAMP:BTCUSD within the funds NASDAQ:IBIT and CBOE:BITX look for my more dedicated posts this weekend.
For those interested in volatility analysis and the application of weighted HV ranges to IV, I encourage you to BOOST and share this post, leave a comment, or follow me to join me on this journey.
We will weekly analyze our ranges under the year-to-date VIX chart and engage in discussions as people please. So hop on board and come along for the ride!
iBIT - Weekly Volatility Snapshot Good afternoon -- Here is my weekly perspective for NASDAQ:IBIT
IV (43.42%) entering the week sits in the 6th percentile for the year. HV10 (28.24%) has been lowering towards it's yearly lows of 23.43% showing a coiling of bi-weekly values at 95.19% from this -- and a divergence from IV of -15.81% . IV is chasing the sinking bi-weekly volatility trends. We generally could see a volatility bounce within this range or continue to grind to new volatility lows.
I always expect and prepare for both, Lewis Pastor once said, "in a scientific setting, chance favors the prepared mind". I hold that true in a lot of situational settings not just scientific, but find it to be very true with BITSTAMP:BTCUSD volatility and risk management.
Moving deeper into the week; what can we expect?
Well, I think that the final shakeout may be here as we consolidate more into the beginning of the week finalizing on Tuesday, June 3rd. I find significance on this date being the extension in time from selling off for 45 days after the initial 'W' distribution off the top -- potentially the start of the volatility swing back towards long-term trending means and maybe the start of another impulse run to track into..stay tuned to find out in observation.
If this week we find regression to HV63 (49.26%), it will be a swift and quick move showing lots of strength. The ability to capture premium between the difference of stated IV from lowering HV10 values to the volatility swing back up above IV to quarterly means, is what it is all about ! This capture can be upwards 5.84% as a volatility metric read and beyond, because when a volatility regression occurs, it moves past means until having to consolidate back downwards again. Rinse and repeat.
For those interested in volatility analysis and the application of weighted HV ranges to IV, I encourage you to BOOST and share this post, leave a comment, or follow me to join me on this journey.

Opendoor Technologies | OPEN | Long at $0.60Opendoor Technologies $NASDAQ:OPEN. This is purely a swing trade for a company that has been posting declining earnings and revenue since 2022 and does not anticipate becoming profitable in the next 3 years. Since the stock is now under $1, it's at-risk of being delisted from the Nasdaq. I am entering this play because there is a chance the recent price hit near $0.50 may be a temporary bottom and there is enough short interest (near 18%) for a spike near its book value of $1.00. Quick ratio is 0.75 (i.e. company may have difficulty meeting its short-term obligations without selling inventory or acquiring additional financing). While the company may be forced to do a split (a major risk for this purchase), I can see other eyes viewing this as a potential "quick play" for a reversal near its book value.
At $0.60, NASDAQ:OPEN is in a personal buy zone for a swing trade.
Targets:
$0.87 (+45%)
$1.00 (+66.7%)

JPMorgan’s Tight ActionJPMorgan Chase has been consolidating for weeks, and some traders may expect resolution to the upside.
The first pattern on today’s chart is the gap on May 12 after Treasury Secretary Scott Bessent signaled progress in trade talks with China. The news pushed JPM above $263, and the stock has chopped on either side of that level since.
In the process, Bollinger Bandwidth has narrowed to the bottom of its longer-term history. Could that tight price action give way to expansion?
Third, the megabank stalled around $255 in early March and late March. The current consolidation has occurred above that level, potentially suggesting that old resistance has become new support.
Next, the series of lower highs since May 15 has created a falling trendline. That resistance may provide a reference point for a potential breakout.
Finally, the 8-day exponential moving average (EMA) has remained above the 21-day EMA.
TradeStation has, for decades, advanced the trading industry, providing access to stocks, options and futures. If you're born to trade, we could be for you. See our Overview for more.
Past performance, whether actual or indicated by historical tests of strategies, is no guarantee of future performance or success. There is a possibility that you may sustain a loss equal to or greater than your entire investment regardless of which asset class you trade (equities, options or futures); therefore, you should not invest or risk money that you cannot afford to lose. Online trading is not suitable for all investors. View the document titled Characteristics and Risks of Standardized Options at www.TradeStation.com . Before trading any asset class, customers must read the relevant risk disclosure statements on www.TradeStation.com . System access and trade placement and execution may be delayed or fail due to market volatility and volume, quote delays, system and software errors, Internet traffic, outages and other factors.
Securities and futures trading is offered to self-directed customers by TradeStation Securities, Inc., a broker-dealer registered with the Securities and Exchange Commission and a futures commission merchant licensed with the Commodity Futures Trading Commission). TradeStation Securities is a member of the Financial Industry Regulatory Authority, the National Futures Association, and a number of exchanges.
TradeStation Securities, Inc. and TradeStation Technologies, Inc. are each wholly owned subsidiaries of TradeStation Group, Inc., both operating, and providing products and services, under the TradeStation brand and trademark. When applying for, or purchasing, accounts, subscriptions, products and services, it is important that you know which company you will be dealing with. Visit www.TradeStation.com for further important information explaining what this means.

$SPX trying to break out of the range$ SPX is trying to break out the range, having tested both sides with upside and downside false breakouts.
Choppy action till a decisive breakout happens

BITx - Weekly Volatility SnapshotGood afternoon -- Here is my weekly perspective for CBOE:BITX
IV (86.99%) entering the week sits in the 3rd percentile for the year. HV10 (60.22%) has been lowering towards it's yearly lows of 47.87% showing a coiling of bi-weekly values at 87.65% from this -- and a divergence from IV of -26.77% . IV is chasing the sinking bi-weekly volatility trends. We generally could see a volatility bounce within this range or continue to grind to new volatility lows.
I always expect and prepare for both, Lewis Pastor once said, "in a scientific setting, chance favors the prepared mind". I hold that true in a lot of situational settings not just scientific, but find it to be very true with BITSTAMP:BTCUSD volatility and risk management.
Moving deeper into the week; what can we expect?
Well, I think that the final shakeout may be here as we consolidate more into the beginning of the week finalizing on Tuesday, June 3rd. I find significance on this date being the extension in time from selling off for 45 days after the initial 'W' distribution off the top -- potentially the start of the volatility swing back towards long-term trending means and maybe the start of another impulse run to track into..stay tuned to find out in observation.
If this week we find regression to HV63 (99.73%), it will be a swift and quick move showing lots of strength. The ability to capture premium between the difference of stated IV from lowering HV10 values to the volatility swing back up above IV to quarterly means, is what it is all about! This capture can be upwards 12.74% as a volatility metric read and beyond, because when a volatility regression occurs, it moves past means until having to consolidate back downwards again. Rinse and repeat.
For those interested in volatility analysis and the application of weighted HV ranges to IV, I encourage you to BOOST and share this post, leave a comment, or follow me to join me on this journey.
