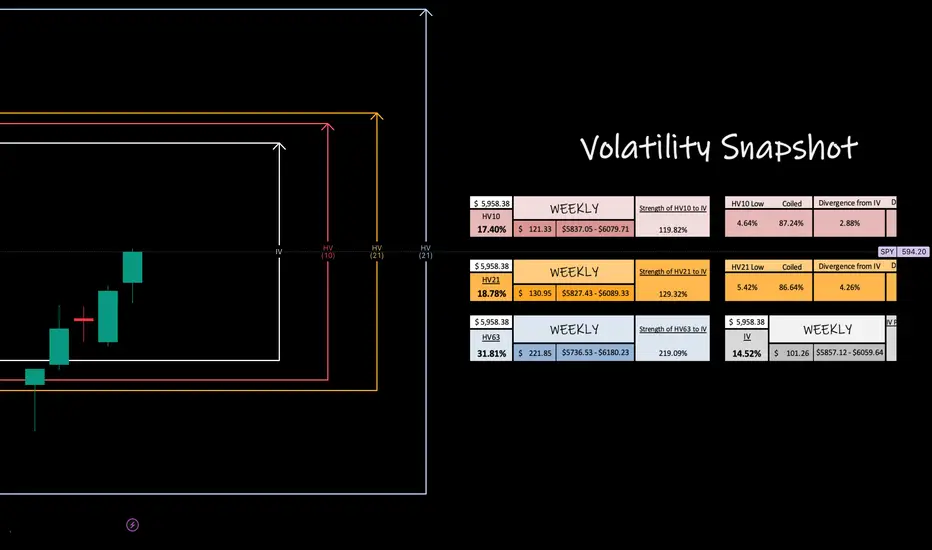
Weekly Volatility SnapshotVolatility, expressed through standard deviation, quantifies market elasticity and presents a level of probability and precision that humbles us all.
In my analysis, I track trending volatility to discern historical patterns (HV) and utilize them to anticipate future outcomes (IV). This weighted indicator provides a comprehensive and accurate range for observation.
When trending historical volatility expands or contracts around implied volatility, price action can be interpreted as positively or negatively compounded within the predicted implied range.
I measure this concept using the ‘strength’ of IV and calculate my implied range based on the current market elasticity. This system is adaptable to any IV condition, as it allows for a fair assessment of market movements and potential outcomes.
__________________________________
Last week, volatility increased slightly as bi-weekly trends picked up over monthly values -- the same near term trends with the major indices show strength within 8% of IV into this next week.
One thing to note: NASDAQ:MSFT NASDAQ:NVDA and NASDAQ:TSLA all show near term contraction under stated IV within the magnificent 7 while the rest show shorter term volatility as expansive.
What do you think the CBOE:VIX will do this next week?
___________________________________
For those interested in volatility analysis and the application of my system using weighted HV ranges to IV, I encourage you to BOOST and share this post, leave a comment, or follow me to join me on this journey!
We will weekly analyze our ranges under the VIX and engage in discussions.
Volatility

S&P 500 Weekly PotentialVolatility, expressed through standard deviation, quantifies market elasticity and presents a level of probability and precision that humbles us all.
This week with SP:SPX bi-weekly trends have risen to just below our monthly values and are currently expansive over the markets IV prediction. Right now as I see it, HV10 is going resonate alongside our monthly values showing continued strength over IV. We could full regression to quarterly means as we move our of corrective territory then see consolidation to cool the markets down.
BOOST the post, drop a follow and comment, BUT don't circle back at the end of the week to revisit and observe how our trending markets preformed!

SPY Weekly PotentialVolatility, expressed through standard deviation, quantifies market elasticity and presents a level of probability and precision that humbles us all.
This week with AMEX:SPY bi-weekly trends have risen to just below our monthly values and are currently expansive over the markets IV prediction. Right now as I see it, HV10 is going resonate alongside our monthly values showing continued strength over IV. We could full regression to quarterly means as we move our of corrective territory then see consolidation to cool the markets down.
BOOST the post, drop a follow and comment, BUT don't forget to circle back at the end of the week to revisit and observe how our trending markets preformed!
Russel 2000 Weekly PotentailVolatility, expressed through standard deviation, quantifies market elasticity and presents a level of probability and precision that humbles us all.
This week with AMEX:IWM you can see that last week trending bi-weekly markets were more volatile than our monthly trending values. This could indicate regression to quarterly means, but for now shows a 15.02% premium advantage over current IV per move.
Bi-weekly, is as of now, only 10.81% off it's quarterly trend. However, it's important to observe that volatility can still consolidate under monthly in a poetic dance to coil up the monthly more on it's path in regression.
This is why in my charts you will notice a 'coiling' value under both HV10 and HV21 values.
BOOST the post, drop a follow and comment, BUT don't forget to circle back at the end of the week to revisit and observe how our trending markets preformed!

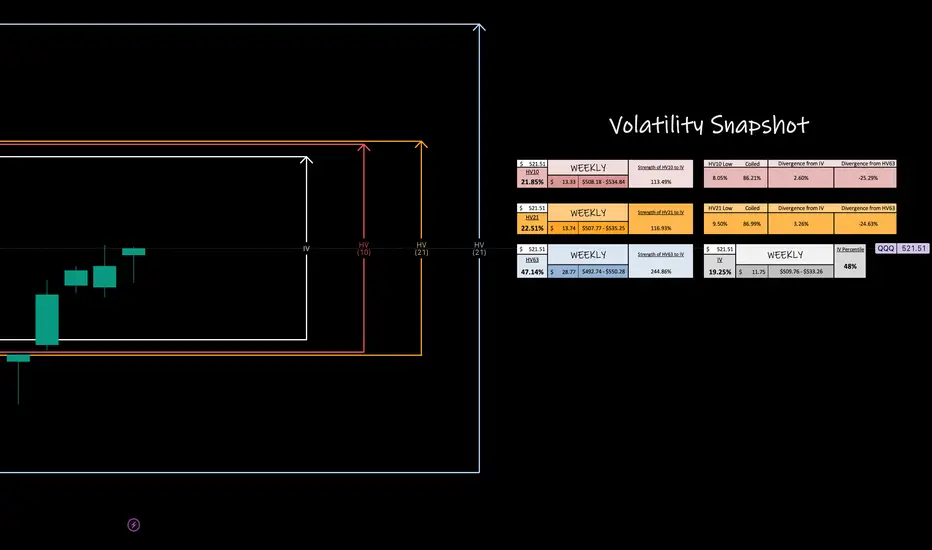
QQQ Weekly PotentialVolatility, expressed through standard deviation, quantifies market elasticity and presents a level of probability and precision that humbles us all.
This week with NASDAQ:QQQ we see that the shorter term trending volatility is resonating like SP:SPX and AMEX:SPY just under our monthly values. Range seems to be expanding allowing for cheaper premium capture per move happening. With any luck, we reflect and increase in volatility with up to quarterly means.
BOOST the post, drop a follow and comment, BUT don't forget to circle back at the end of the week to revisit and observe how our trending markets preformed!
iBIT Weekly PotentialVolatility, expressed through standard deviation, quantifies market elasticity and presents a level of probability and precision that humbles us all.
Now we move on to the world of BTC with a look at NASDAQ:IBIT
Here, as we have been observing an ongoing regression, you see that HV10 has expanded past HV21 and now IV is predicting more range expansion leading toward the volatility at quarterly means. Stay tuned, and I hope this helps visualize what I do.
BOOST the post, drop a follow and comment, BUT don't forget to circle back at the end of the week to revisit and observe how our trending markets preformed!

BITx Weekly PotentialVolatility, expressed through standard deviation, quantifies market elasticity and presents a level of probability and precision that humbles us all.
Now we move on to the world of BTC with a look at CBOE:BITX
Here, as we have been observing an ongoing regression, you see that HV10 has expanded past HV21 and now IV is predicting more range expansion leading toward the volatility at quarterly means. Stay tuned, and I hope this helps visualize what I do.
BOOST the post, drop a follow and comment, BUT don't forget to circle back at the end of the week to revisit and observe how our trending markets preformed!

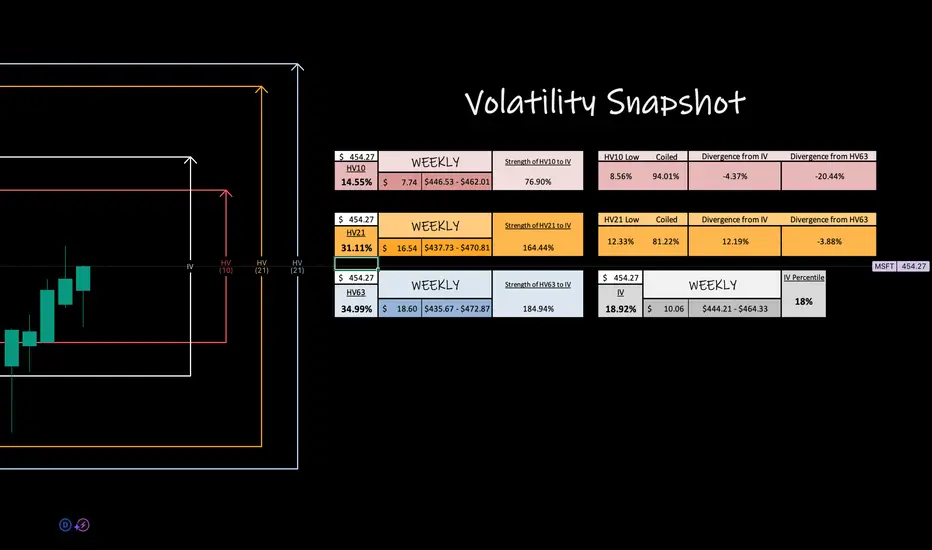
Microsoft, Inc -- Weekly PotentialVolatility, expressed through standard deviation, quantifies market elasticity and presents a level of probability and precision that humbles us all.
I wanted to take a look at at least one of the magnificent 7s with the community this weekend, so I decided on NASDAQ:MSFT because it had the lowest IV of them all.
Lowest IV = best premium value, right? Well it can, but it can also be leading onto more consolidation especially after a big move up like NASDAQ:MSFT has recently done.
Here, we see that HV21 has just come out of it's regression to quarterly means and now is consolidating lower with bi-weekly coiling towards it's yearly lows.
See what I'm doing? Ill be watching for HV21 dropping and HV10 bottoming..there we will find our volatility bounce again. Some of the coolest magic happens when HV10 is at lows at does the HUGE swing back up to quarterly means. SO STAY TUNED!!
BOOST the post, drop a follow and comment, BUT don't forget to circle back at the end of the week to revisit and observe how our trending markets preformed!
$BNB liquidity sweepScalping on M15, quite a number liquidity at 620-650 region, a potential long scalp seem to be opened after the downward correction. A sweet short.
1.5RR to 2RR is possible. this is what the STIC indicator is showing. using the institutional liquidity zone line plot.
NFA and DYOR by the way.

$INJ on WeeklyThe asset bounced within the Demand zone on the Weekly, creating room for a possible rally up to the $20-25 area.
Volatility is still open but with steadily decreasing bearish pressure.
A Daily FVG overlaps with the Weekly FVG so as to create possible room for maneuver.
The widely used RSI has broken the barrier of a bearish trendline that has lasted since December 2023. Whether it maintains the trajectory will only be seen at the close of this week.
Funding rates positive.
Open Interests slightly up.
Detail not to be overlooked in the coming days: the market cap line is rising, but the price is lagging slightly. Positive sign.
Stable volume, with an improvement in the last two days. Very mild data.
With the whole crypto sector seemingly showing signs of life, I am confident of its uptrend.
Remember: until proven otherwise.

AEGISLOG - Aegis Logistics Ltd. (45 minutes chart, NSE) - LongAEGISLOG - Aegis Logistics Ltd. (45 minutes chart, NSE) - Long Position; short-term swing research idea.
Risk assessment: High {volatility risk}
Risk/Reward ratio ~ 2.63
Current Market Price (CMP) ~ 880
Entry limit ~ 870 to 860 (Avg. - 865) on May 22, 2025
1. Target limit ~ 890 (+2.89%; +25 points)
2. Target limit ~ 915 (+5.78%; +50 points)
Stop order limit ~ 846 (-2.20%; -19 points)
Disclaimer: Investments in securities markets are subject to market risks. All information presented in this group is strictly for reference and personal study purposes only and is not a recommendation and/or a solicitation to act upon under any interpretation of the letter.
LEGEND:
{curly brackets} = observation notes
= important updates
(parentheses) = information details
~ tilde/approximation = variable value
-hyphen = fixed value

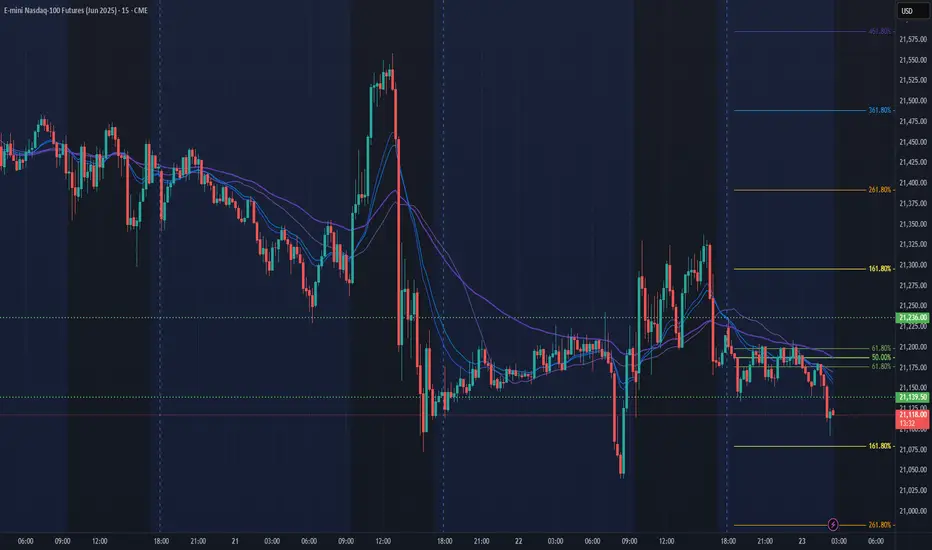
NQ Power Range Report with FIB Ext - 5/23/2025 SessionCME_MINI:NQM2025
- PR High: 21236.00
- PR Low: 21139.00
- NZ Spread: 217.0
Key scheduled economic events:
10:00 | New Home Sales
Early close Monday
- Previous session closed as daily inside print
- Overall sentiment unchanged
Session Open Stats (As of 12:45 AM 5/23)
- Session Open ATR: 447.96
- Volume: 29K
- Open Int: 277K
- Trend Grade: Neutral
- From BA ATH: -6.6% (Rounded)
Key Levels (Rounded - Think of these as ranges)
- Long: 22096
- Mid: 20383
- Short: 19246
Keep in mind this is not speculation or a prediction. Only a report of the Power Range with Fib extensions for target hunting. Do your DD! You determine your risk tolerance. You are fully capable of making your own decisions.
BA: Back Adjusted
BuZ/BeZ: Bull Zone / Bear Zone
NZ: Neutral Zone
Using Historical Volatility and HarmonicsI track bi-weekly, monthly, and quarterly volatility to have a feel for how trending markets elasticity is and I weight this volatility percentage to the ever sliding IV environment and calculate an implied range for the week.
This helps me gauge the weekly candle potential.
Here you see my HV10/21/63 implied ranges for the week listed from my spreadsheet and visualized on the daily perspective of CBOE:BITX -- What I would like to point out entering the week as this run will begin to cool off, is the confluence around $60.00 with HV63 regression and 'Point D' completion of my harmonic shown.
I hope everyone has a great week. If you like to talk volatility and enjoy fibonacci drop me a comment.

$SPY Bollinger Bands and RSI Oversold SignalThe AMEX:SPY aka S&P 500 is delivering a daily Bollinger Bands and RSI oversold signal today
In the last ten years there has been a bigger recovery shortly after such an signal

Crude Oil – Geopolitical Risks and Stockpiles Impacting PricesThe recent reduction in global trade tensions has helped Crude Oil (WTI) prices recover from lows of 55.64 seen on May 5th, to trade comfortably above 60 for the last 2 weeks. Traders have readjusted their thinking and positioning to account for a slightly more stable background for the global economy, and its potential influence on upcoming demand for Oil.
However, despite this, tests of the recent highs at 65.33, seen on April 23rd, have been few and far between, although yesterday saw a spike in Crude Oil prices up to a 1 month high of 64.60 on a CNN report that suggested that Israel has drawn up plans to attack Iran's nuclear facilities. While prices have since moved lower again, the market reaction to this news does highlight the sensitivity of traders to any potential escalation in geopolitical risks in the region.
It is also important to remember that traders are still awaiting updates on progress from US/Iran talks to curb Iran's nuclear activities. President Trump only a week ago said a deal was getting close, while Iran's top negotiator has seen shed some doubt over whether that's the case. Either way, updates on both of these crucial events may well influence Crude Oil prices moving forward.
Adding to yesterday's volatile moves was a weekly report providing an update on the size of US Oil inventories which always grabs the attention of traders. Yesterday's release quickly dashed any hopes of a fresh move to test higher levels as it outlined an increase in stockpiles to 10 month highs and a fall in gasoline demand, which saw prices fall back lower (61.71 low) into the recent trading range.
This extra volatility within the recent trading range sets up a potentially tense finish to the week for Crude Oil prices, so its often useful to check out the technical landscape for further insight.
Technical Update: Evidence Points to a Sideways Range
Since the sharp acceleration lower into the 55.20 April 9th 2025 low, Crude Oil has seen a consolidation emerge, with the mid-April recovery finding resistance at 65.15, which is equal to the 38.2% Fibonacci retracement of January 15th to April 9th 2025 weakness (see chart below).
This activity looks to have established both upper and lower extremes of a sideways range in price, especially as the latest price movement has been held within these levels, which are 65.15 to the upside and 55.20 to the downside.
Within technical analysis, this highlights something of a ‘battle’ between buyers and sellers, where price weakness is supported by buyers at or just above the 55.20 low, while price strength runs into resistance, as sellers continue to be found near the 38.2% retracement level at 65.15.
Adding Bollinger Bands To Support Trading Decisions
Now look at the chart below, where we include Bollinger bands alongside price action. This also appears to support an argument that a sideways trading range is forming.
The mid-average is currently flat with both the upper and lower Bollinger bands parallel to it, outlining that balanced price volatility is evident for now. This suggests the sideways range may well continue with the upper band, currently at 64.77 and the lower band, currently at 57.36.
We could argue that with the proximity of both the 65.15 Fibonacci retracement resistance to the upside, and the 55.20 April 9th low to the downside, upper extremes of the current range are 64.77/65.15, and lower levels of the current range are between 55.20/57.36.
What Could This Mean for Crude Oil?
For now at least, from a technical perspective the risks appear for the price of Crude Oil to remain within the confines of the current 55.20/57.36 up to 64.77/65.15 trading range, as there is no evidence emerging of an imminent breakout yet.
A closing breakout from the current range is required to suggest potential for a more extended phase of price movement,.
Of course, while any closing break is not a guarantee of a sustained move in the direction of the eventual break, any closes above 65.12/15 might see traders anticipate a further recovery in price towards 68.13, which is equal to the 50% Fibonacci retracement, even 71.17, the higher 61.8% level.
To the downside, closes below the 55.20/57.30 lower daily Bollinger band and April 9th price low, might now be needed to skew possibilities towards a more extended phase of weakness.
Such activity might then suggest potential for further downside, towards 51.38, which was a price low established in January 2021.
The material provided here has not been prepared in accordance with legal requirements designed to promote the independence of investment research and as such is considered to be a marketing communication. Whilst it is not subject to any prohibition on dealing ahead of the dissemination of investment research, we will not seek to take any advantage before providing it to our clients.
Pepperstone doesn’t represent that the material provided here is accurate, current or complete, and therefore shouldn’t be relied upon as such. The information, whether from a third party or not, isn’t to be considered as a recommendation; or an offer to buy or sell; or the solicitation of an offer to buy or sell any security, financial product or instrument; or to participate in any particular trading strategy. It does not take into account readers’ financial situation or investment objectives. We advise any readers of this content to seek their own advice. Without the approval of Pepperstone, reproduction or redistribution of this information isn’t permitted.

NQ Power Range Report with FIB Ext - 5/22/2025 SessionCME_MINI:NQM2025
- PR High: 21177.00
- PR Low: 21113.75
- NZ Spread: 141.25
Key scheduled economic events:
08:30 | Initial Jobless Claims
09:45| S&P Global Manufacturing PMI
- S&P Global Services PMI
10:00 | Existing Home Sales
Value decline follow-through following morning bull run
- Auction holding at Monday's lows
Session Open Stats (As of 12:45 AM 5/22)
- Session Open ATR: 460.09
- Volume: 31K
- Open Int: 276K
- Trend Grade: Neutral
- From BA ATH: -6.6% (Rounded)
Key Levels (Rounded - Think of these as ranges)
- Long: 22096
- Mid: 20383
- Short: 19246
Keep in mind this is not speculation or a prediction. Only a report of the Power Range with Fib extensions for target hunting. Do your DD! You determine your risk tolerance. You are fully capable of making your own decisions.
BA: Back Adjusted
BuZ/BeZ: Bull Zone / Bear Zone
NZ: Neutral Zone

**Trade Update Post: BITx**Trying something new here for the community to follow along with me.
This is an update to my ongoing CBOE:BITX trade showing my ‘Fibonacci Triangle’ standing strong in the wake of some minor consolidation. I have highlighted by arrow during this run the last trend bounce we made before continuing upwards. I am okay with the same type of price action even with potential retracement down to the lower HV10 weekly range of $48.
Due to leverage decay on top of time decay I have set an exit path of May 22nd if I do not see the same type of bounce off my retracement trend line. This mark is Thursday next week. PT is still $58-$60
Cheers!
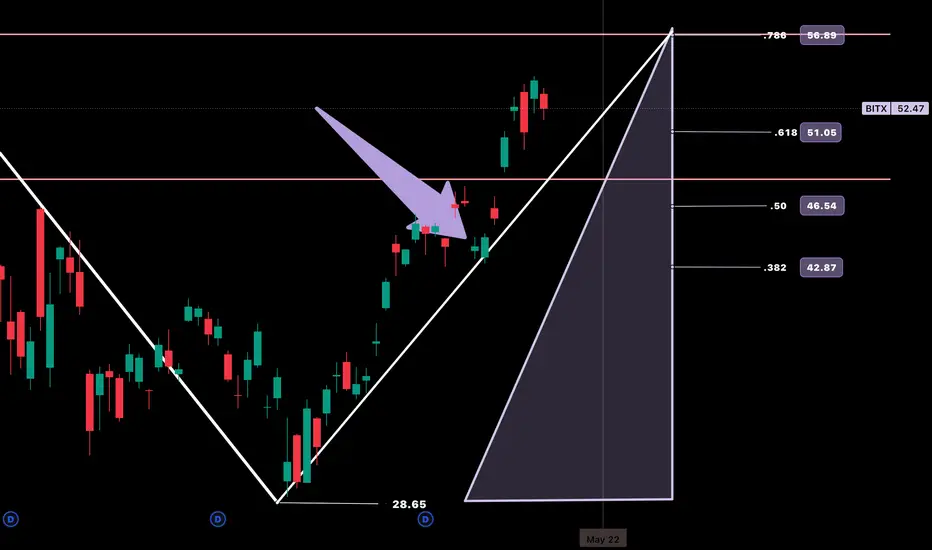
The 'Fibonacci Triangle' and Historical Volatility Along with the harmonic I just posted to the community showing confluence with HV63 regression that started to take place last week, I wanted to include my 'Fibonacci Triangle' with my predictive volatility range idea.
I see HV10 (bi-weekly) resonating off HV21 (monthly) to enter the week. This would create roughly a $4.92 range if correct for tomorrow. From there we can continue to increase in volatility into the week until full means regression to quarterly trending averages are met.
This can be reflected in the daily candle through the trending bi-weekly daily volatility print on the day, then calculated into range. Of course as always, my ranges are weighted to the current IV environment.
If my target range of monthly volatility is reached tomorrow, which holds confluence in the 78.60% retracement value from selling off with BTC for 70 days..i'd say there is probability to move another $2.21 in regression, putting us just below $60.00.
CBOE:BITX

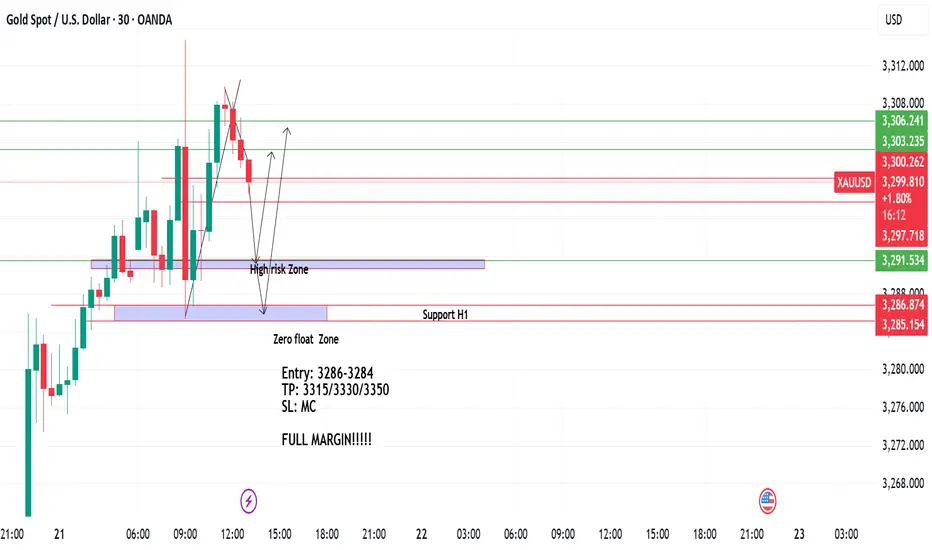
GOLD TRADING IDEA (FULL MARGIN SETUP)Lets entry at gold, you can try enter the high risk zone or wait for a lower risk zone maybe before New york session. TP and entry zone can bee seen in the chart. TAYOR goodluck.
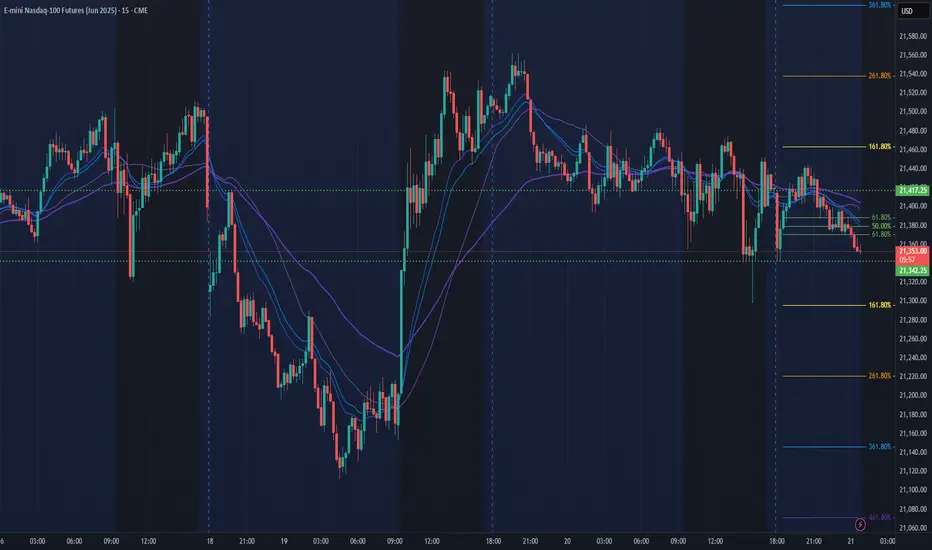
NQ Power Range Report with FIB Ext - 5/21/2025 SessionCME_MINI:NQM2025
- PR High: 21417.25
- PR Low: 21342.00
- NZ Spread: 168.25
No key scheduled economic events
Maintaining Monday-Friday range, currently back at the lows
- Advertising "indecision"
- Will need to break 21100 to follow through on rollover back to mean
Session Open Stats (As of 12:45 AM 5/21)
- Session Open ATR: 460.78
- Volume: 30K
- Open Int: 276K
- Trend Grade: Neutral
- From BA ATH: -5.4% (Rounded)
Key Levels (Rounded - Think of these as ranges)
- Long: 22096
- Mid: 20383
- Short: 19246
Keep in mind this is not speculation or a prediction. Only a report of the Power Range with Fib extensions for target hunting. Do your DD! You determine your risk tolerance. You are fully capable of making your own decisions.
BA: Back Adjusted
BuZ/BeZ: Bull Zone / Bear Zone
NZ: Neutral Zone
NQ Power Range Report with FIB Ext - 5/20/2025 SessionCME_MINI:NQM2025
- PR High: 21515.00
- PR Low: 21493.00
- NZ Spread: 49.0
No key scheduled economic events
Return to previous week's highs following full supply sweep session
Session Open Stats (As of 12:45 AM 5/20)
- Session Open ATR: 479.66
- Volume: 34K
- Open Int: 281K
- Trend Grade: Neutral
- From BA ATH: -5.4% (Rounded)
Key Levels (Rounded - Think of these as ranges)
- Long: 22096
- Mid: 20383
- Short: 19246
Keep in mind this is not speculation or a prediction. Only a report of the Power Range with Fib extensions for target hunting. Do your DD! You determine your risk tolerance. You are fully capable of making your own decisions.
BA: Back Adjusted
BuZ/BeZ: Bull Zone / Bear Zone
NZ: Neutral Zone

NQ Power Range Report with FIB Ext - 5/19/2025 SessionCME_MINI:NQM2025
- PR High: 21374.75
- PR Low: 21283.75
- NZ Spread: 203.25
No key scheduled economic events
Beginning anticipated rotation, holding at Thursday's lows
- Daily gap remains below 20400 ahead of Keltner average cloud
Session Open Stats (As of 12:25 AM 5/19)
- Session Open ATR: 490.62
- Volume: 54K
- Open Int: 283K
- Trend Grade: Neutral
- From BA ATH: -6.3% (Rounded)
Key Levels (Rounded - Think of these as ranges)
- Long: 22096
- Mid: 20383
- Short: 19246
Keep in mind this is not speculation or a prediction. Only a report of the Power Range with Fib extensions for target hunting. Do your DD! You determine your risk tolerance. You are fully capable of making your own decisions.
BA: Back Adjusted
BuZ/BeZ: Bull Zone / Bear Zone
NZ: Neutral Zone

100B Wiped Out From Crypto MarketLooking at the total market size, we just lost $100B in market cap across top cypto assets.
And, the USA got downgraded.
And, CoinBase got hacked.
What do you think is going to happen tomorrow?
