Volatilityindex

$VIXY testing daily 200ema$VIXY testing daily 200ema near the top of the linear regression channel. This is a big area of resistance and we are watching closely.

THE VIX IS BREAKING OUT (way too early)The VIX broke out of that major downtrend structure on a daily basis today for the first time in this whole correction. This is a pretty sign for now, Volatility could rallye exremely hard from here... Watch out, things could get somewhat bumpy from here on..


Vix: a tool to anticipate potential market tops & bottomsThis is just a guide for human psychology.
Buy some when VIX is between 30 & 40 (FEAR phase). Sell some when VIX is between 15 & 20 (GREED phase).
Vix the fear index is currently on an wide upchannel creating a lot of market volatility. However, we can use this channel range to anticipate temporary tops & bottoms until this channel breaks up or down.
See chart for all the possible tops & bottoms & where this channel may possibly break down downward (stocks will rise in the last Quarter2022 before a STA CLAUS rally unless another black swan happens). Recession if it will happen may come after a year or 2 when unemployment starts to rise again & inflation/demand starts to plummet. Right now unemployment is very low & inflation is still rising. The action of FED to fight inflation by forcefully raising rates & reducing demand may risk sending US economy into STAGFLATION (slowing economy with rising inflation is very bad for stocks).
Not trading advice.
Hope this helps someone to understand the power of FEAR & GREED.

India VIXWith FOMC outcome due tonight, volatility is increasing sharply (pre-event uncertainty)
We are in the dark as to what FED will do tonight - so many possibilities, add to that statement - hawkish or dovish
25 bps market will rally
50 bps appears discounted
75 bps market will panic
Hence better to stay light
Above 21.75 the crucial resistance is at 2.80 if that breaches then be prepared for extreme moves (we have just seen the trailer in that case) all the way till 28
This would be mean large intra-day candles & gap openings. Avoid writing PE during such time unless well hedged. Also reduce derivative exposure its not worth it during such times.
Post event wait for VIX to start cooling down, trend direction will become clear by then

🔥 Using The VIX To Time Bitcoin BottomsFrom Investopedia: The CBOE Volatility Index (VIX) is a real-time index that represents the market’s expectations for the relative strength of near-term price changes of the S&P 500 index (SPX). Because it is derived from the prices of SPX index options with near-term expiration dates, it generates a 30-day forward projection of volatility. Volatility, or how fast prices change, is often seen as a way to gauge market sentiment, and in particular the degree of fear among market participants.
In short, the VIX is a way to measure fear in the (stock) market. Higher values means more fear and mostly coincide with bearish price action.
Consequently, a falling VIX means that investors gain confidence, which in turn in good for the markets.
In addition, the VIX can be used to determine if the bottom is likely to be in or not, see the chart for some examples.
VIX tops often coincide with short- and/or long-term Bitcoin bottoms. A strategy that I use it to wait for a strong reversal in the VIX to occur before scaling in back into the market. You won't time the market perfectly, but you're able to capture the majority of the bullish reversal. Furthermore, wait for the VIX to become overbought on the RSI on higher timeframes (>4H) before trying to time a reversal.
As of yesterday, the VIX is falling sharply after seeing a big rise since April 3rd. This could signal that we're now trading at a (temporary) bottom and that we're likely to see more bullish price action in the near future.
Keep in mind that the VIX will only tell one part of the story. Never solely rely on the VIX giving you a signal to either buy or sell.

VIX Next Resistance! Sell!
Hello,Traders!
VIX is going up now, but a strong
Horizontal resistance is ahead
Thus, I think that we will see a move down
From the level towards the demand level below
Sell!
Like, comment and subscribe to boost your trading!
See other ideas below too!

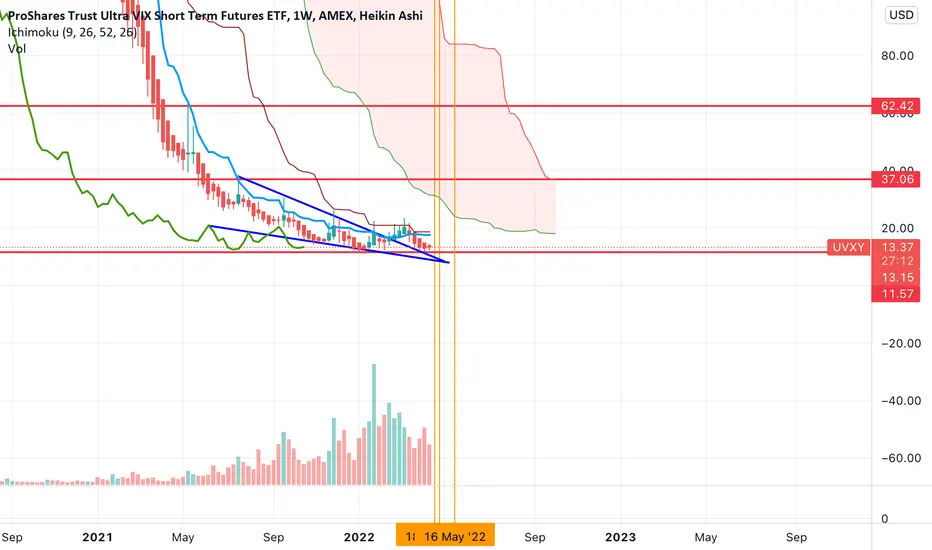
Volatility about to break out? $UVXY the path to $60+.$UVXY looks like it's on the verge of breaking out to the upside. We a falling wedge which broke out to the upside and now price has found support on the top of the structure. Usually that indicates a large move upwards is coming.
If it starts moving, I can see a quick move up finding a final target of around $62.
Let's see what happens over the coming weeks. I've started buying in the low $12 region.
UVXY Heading Higher PotentiallyWe seem to be making a bottoming formation and within this I see a janky head and shoulders pattern. I think we are slightly over bought on lower time frames but we could move higher and the key to that here is volatility. NFA, DYOR

DAX 40 - Wonderful Long Reversal #DAX40 started with a gap down hitting directly the lower #BouhmidiBand - Now we already see a chartbook implied vol reversal in DAX - You want to learn more about Bouhmidi-Bands - Check my script here on tradingview

New VIX Cycle - 4/11/2022VIX at the daily view.
VIX finally broke its downtrend and RSI downtrend. It seem to have bounced off of the white pivot line (for now).
April seems to be set as a rollercoaster of a month. There is earnings season which provides some liquidity. At the same time, the US tax deadline is coming up (April 18th). The wealthy usually wait until the last minute to cash out to pay their tax liability. The bond market has been sinking like no tomorrow since QE ended. At the same time, money mainly shifted to defensive sectors (e.g. utilities, healthcare, and consumer staples). Push-pull.
On Twitter, I saw posts a month ago calling for VIX to be above 50. As stated before, it would be pretty hard for the VIX to break 50 unless the Federal Reserve does something highly expected like hiking rates to 5% by end of 2022... which is unlikely as it would require several conditions to reach that level of desperation.
There is another reason why the VIX would have a hard time reaching 50 in the next few months. The VIX is the measurement of implied volatility within the options market of the ES/SPX. Options is not the entire market. Bigger investors have not been using options as much to hedge their portfolios. In a clever way, bigger investors have been using futures to hedge their portfolios. Why is it clever? Futures qualify under section 1256 which is not 100% short-term capital gains. It's a tax advantage. VIX would have a hard time to measure the implied volatility if the bigger hedges are heading into the futures market and not the options market.
This is why most have a hard time understanding the VIX. It's a piece of the puzzle. You have to look at the bond market, credit market, FOREX market, options market, and individual sectors to see the full picture. Furthermore, one needs to master timing and risk management as well. Most traders think they know everything and stop learning after a few wins. Most become trapped in their dream of an epic crash or rally. The VIX doesn't care about your dreams or opinions. It's algorithms and formulas.
VIX might have an uptrend leading to May FOMC. The Fed minutes indicate that quantitative tightening might start as soon as May instead of June/July. Furthermore, OPEX and taxes are coming up. That might cause some whiplash. VIX might be back to elevated levels again (above 24). I won't be surprised to hover above 24 for a little while. As for timing it, that's the issue. With hedges being split between options and futures, timing VIX spikes became even harder.

VIX Uptrend Implication ContinuedInflation starting to become more persistent, markets ignoring the Fed's cautionary tone and modest 25 bps rate hike.
March inflation reporting comes out next week, the last inflation measure prior to the FOMC meeting in early May.
Volatility for S&P 500 likely to increase with potential exceed the March 2020 spike in the coming months.
Currently, expecting VIX to tap 40 in the near future.

VIX-S&P 500 FEAR INDEX-LESS FEAR, MARKETS CORRECTINGThe VIX measures the fear in the S&P 500. Even if you only trade or invest in crypto or stocks watching the VIX is critical in learning how to measure the sentiment of the general market regardless of what you are trading or investing. I use the VIX for even crypto trading and suits me well. It does the complete opposite of the what other stocks or cryptos do. Master understanding this chart and you will be better prepared at making successful trading entries and exits in the market. So despite the Russian Ukranian invasion the markets are correcting slowly and beginning to show promise once again. For details watch this video and give me a thumbs up and please subscribe to show support for my channel.
Thank You
Astreaus otherwise know as Cryptobuzzanalyst
Disclaimer
I’m not a certified financial planner/advisor, a certified financial analyst, an economist, a CPA, an accountant, or a lawyer. I’m not a finance professional through formal education. The contents on this TA,(Technical Analysis) are for informational and educational purposes only and do not constitute financial, investment, trading, accounting, or legal advice. I can’t promise that the information shared on my posts is appropriate for you or anyone else. By using or reading this technical analysis or site, you agree to hold me harmless from any ramifications, financial or otherwise, that occur to you as a result of acting on information found on this analysis, or post.

Bond Market Volatility & EconomyBond yields serve as a leading indicator of economic performance, with major headwinds in the form of inflation and labor shortages, short-term yields have begun to invert demanding higher premiums than longer-term bonds.
As the bond market moves in anticipation, volatility increases and serves as a signal to the broader economy.
$MOVE provides a benchmark with bond market volatility, with an uptrend and spikes nearing Feb/Mar 2020.
The chart presents measurements going back to lat 2002, reflecting a dramatic uptick in volatility as the housing market collapsed in 2008.
The uptrend reflected now is serving as another warning to the markets that turbulent times lay ahead.

$VIX Analysis, Key Levels and targets… $VIX Analysis, Key Levels and targets…
I really don’t feel like writing a lot here… it’s pretty self explanatory I would think…
GL and let me know what you think…

VOLX bullish momentum! | 14th March 2022Prices are on bullish momentum and consolidating in a parallel channel . We see the potential for a bounce from our buy entry at 28.89 in line with 78.6% Fibonacci Projection towards our Take Profit at 35.98 in line with 100% Fibonacci Projection . RSI is at levels where bounces previously occurred.
Any opinions, news, research, analyses, prices, other information, or links to third-party sites contained on this website are provided on an "as-is" basis, as general market commentary, and do not constitute investment advice. The market commentary has not been prepared in accordance with legal requirements designed to promote the independence of investment research, and it is therefore not subject to any prohibition on dealing ahead of dissemination. Although this commentary is not produced by an independent source, FXCM takes all sufficient steps to eliminate or prevent any conflicts of interest arising out of the production and dissemination of this communication. The employees of FXCM commit to acting in the clients' best interests and represent their views without misleading, deceiving, or otherwise impairing the clients' ability to make informed investment decisions. For more information about the FXCM's internal organizational and administrative arrangements for the prevention of conflicts, please refer to the Firms' Managing Conflicts Policy. Please ensure that you read and understand our Full Disclaimer and Liability provision concerning the foregoing Information, which can be accessed on the website

✅VOLATILITY INDEX NEXT MOVE|SHORT🔥
✅VOLATILITY INDEX was trading in an uptrend
Following the global uncertainty due to the war
However, the price has hit a resistance level
From where VIX made a pullback
And broke the rising support line
Which makes me bearish biased
And thus I think we will see a move down
Towards the demand level below
SHORT🔥
✅Like and subscribe to never miss a new idea!✅

VIX Volatility IndexWhen we get these major volatility spikes, it's not a bad time to do smaller risk and vice versa for when we have lower volatility when the fear in the market is low.

$VIX Analysis, Key Levels & Targets$VIX Analysis, Key Levels & Targets
$VIX to 45? Higher Lows continued??
Vix is sitting right at the trendline it’s been holding to since the beginning of the year… if it breaks down we could see a little profit taking rally. If it bounces above the volatility will be higher.
Vix to 45? I’d love to hear your feedback here…
——————
I am not your financial advisor, but I will happily answer questions and analyze to the best of my ability but ultimately the risk is on you. Check out my ideas, but also do your own due diligence.
I have a huge tolerance for volatility so please know that. If you’re new to my trade setups please try them on a small scale first. Then go in with a risk you’re comfortable with.
I am not a bull. I am not a bear. I just see what I see in the charts and I don’t pay too much attention to the noise in the news.
If you want me to analyze any stock or ETF just leave me a comment and I’ll do it if I can. (If I have time)
And most importantly… Have fun, y’all!!
(\_/)
( •_•)
/ >🚀

$VIX Making higher lows$VIX Making higher lows
——————
I am not your financial advisor, but I will happily answer questions and analyze to the best of my ability but ultimately the risk is on you. Check out my ideas, but also do your own due diligence.
If you want me to analyze any stock or ETF just leave me a comment and I’ll do it if I can.
Have fun, y’all!!
(\_/)
( •_•)
/ >🚀

VIX - Monthly - BIG UPSIDE ON VIXOn the monthly and daily chart, I see VIX making a bullish comeback which suggest we are about to see crazy volatility in the stock market. Combine that with the recent insider selling from Jeff Bezos of around $2 billion worth of amazon shares and Kimbal Musk (Elon Musk's brother) selling around $100 million worth of tesla shares on Nov 5th and then Elon Musk himself proposing to sell his own shares, We are more than likely to see a market pull back or crash in the coming weeks.

VIX Perfect Symmetry through the decades points to turbulence.I've posted this, interesting to say the least, pattern on VIX a few years ago and thought it might be a good time to refresh your memory following the recent (minor so far) pull-back on stocks.
As you see VIX has had two major patterns where an initial rise forms a Double Top (made of two market shocks/ catalysts) and then drops back to its 10.00 Support level. The most recent of the two has been the pattern that had Double Tops made by the 2008 Subprime Mortgage Crisis and the 2020 COVID flash crash. Since then (with the necessary cash injections by the U.S. Government), VIX has dropped to 15.00, below the 1M MA50 (blue trend-line). Like I said, the Support is 10.00, which means there is time left to the markets to stay in relative peace but the 1W MA50 is already on the rise, which is an early signal that the next rise towards a Double Top formation may be starting.
It is not panic time yet, but certainly something to keep in mind that volatility in the markets lies ahead.
** Please support this idea with your likes and comments, it is the best way to keep it relevant and support me. **
--------------------------------------------------------------------------------------------------------
!! Donations via TradingView coins also help me a great deal at posting more free trading content and signals here !!
🎉 👍 Shout-out to TradingShot's 💰 top TradingView Coin donor 💰 this week ==> Vergnes
--------------------------------------------------------------------------------------------------------
