There Is No VIX "Suppression Program"VIX at the weekly view.
I didn't have time to write this last week due to a hectic schedule. Better late than never, I guess.
The VIX broke the weekly resistance and bounced from the pivot zone (white line). A smaller VIX spike is in progress. No, I am not expecting above 40 at all. Maybe mid-30s at the higher end. It would be nice if I am wrong so more opportunities can arise... With the relatively big contango going on between VIX and VX, you would need extreme, precise timing in VX long entries and exits... I don't like babysitting trades at all - where there is no margin for error. I prefer trades were I am allowed to have plenty of margin for error (easier trades).
It seems that my red line still lives on which I am very surprised. It should expire in the next quarter... but it's hard to pinpoint. Even then, cash (or cash equivalents) is still still king. Why is that important?
The biggest VIX spikes were driven due to 1 particular reason: excessive demand for hedges in SPX/ES options. There is no "suppression" program as conspiracy theorists claim on social media. There is no mysterious group (often called "they") that magically pull levers to control all markets. That type of thinking is a losing mentality. That mentality means the person lost a lot and wants to blame someone else other than himself/herself. It's like a grown adult blaming all their problems on their parents. It's a very unhealthy coping mechanism.
As stated before, there are 3 reasons why the VIX won't spike hard despite big red days in the SPX or ES.
1) When short-term bond yields are high and in an uptrend (bond prices in a downtrend), cash becomes king (not trash). So, when positions are being sold, the money is then flowed into cash equivalents like treasury bonds and securities. That means there is less money going to hedges. VIX doesn't get a big spike if there less demand for hedges.
2) When the bonds are sinking (yields rising), there is also sector rotation from growth to cyclical stocks. More specifically, dividend value stocks become more attractive. That just means money is just rotating among sectors within the SPX/ES. There are little hedges being bought during this rotation... as it's just trading shares for shares.
3) Hedges were meant to protect gains in investments. If the investment is at a loss, then there is no need for a hedge since that would unnecessarily tie up more capital. When cash is king, it makes more sense just to sell for tax-loss harvesting (to offset gains for tax purposes) than to add more stress with hedges. Imagine if you had $1 million in gains this year and you then owe over $400,000 in taxes. Most likely, you would worry about how to lower your tax liability. Tax-loss harvesting is a common method. Hedges were meant to protect gains so the investments would reach the long-term capital gains tax rate (which is significantly lower).
It is NOT an inverse index nor some sort of fear index (which the media loves to label it as). Normally, if I see something who treats it that way, it's a red flag that they never bothered studying the VIX and VX. The VIX loves to punish anyone who is impatient or anyone didn't bother to understand its mechanics.
Imagine the VIX like piloting a commercial or transport plane. If you don't understand the flight control systems thoroughly, you will likely crash the plane.
Volatilityindex

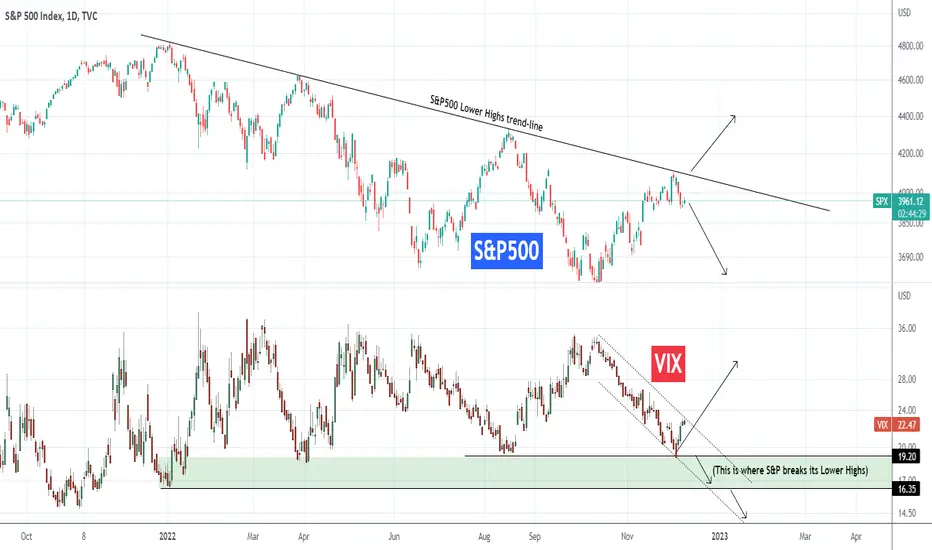
This level on VIX can make the S&P500 finally break bullishThis is the S&P500 on the top chart compared to the Volatility Index (VIX) at the bottom. As you see, VIX rebounded on the 19.20 Support level that was formed by the August 12 Low and that made the S&P500 get rejected on its Lower Highs trend-line that is holding since the start of 2022.
If that upward trend on VIX continues, S&P500 should trend towards its previous Low and if VIX tests its October High, then most likely it will be translated into a Lower Low for the S&P500.
However, a break below VIX's Low, into the Green Zone, should make the S&P500 finally crosses above this 1 year Resistance. Further, a VIX break below the 16.35 Low (formed by the January 04 Low), should technically confirm the long-term bullish break-out. This can be as early as the start of 2023 if VIX's Channel Down is extended.
-------------------------------------------------------------------------------
** Please LIKE 👍, SUBSCRIBE ✅, SHARE 🙌 and COMMENT ✍ if you enjoy this idea! Also share your ideas and charts in the comments section below! This is best way to keep it relevant, support me, keep the content here free and allow the idea to reach as many people as possible. **
-------------------------------------------------------------------------------
You may also TELL ME 🙋♀️🙋♂️ in the comments section which symbol you want me to analyze next and on which time-frame. The one with the most posts will be published tomorrow! 👏🎁
-------------------------------------------------------------------------------
💸💸💸💸💸💸
👇 👇 👇 👇 👇 👇
$VXX looks like it's about to explode higherSo far the selloff has been pretty orderly the entire year and trying to play volatility hasn't worked. I think that's about to change.
$VXX has been consolidating in these two channels and looks like it's about to explode higher. If we can see $VXX get above $21 or so, I think we're about to see a huge move in $VXX. Similar to what we saw in March 2020.
I've marked off key levels of resistance on the upside. Let's see if it plays out over the coming weeks.

VIX Potential Long! Buy!
Hello,Traders!
VIX has once again retested
The horizontal support level
And despite my mixed bias
On the index I think
We might see a local rebound
Buy!
Like, comment and subscribe to boost your trading!
See other ideas below too!

Volatility S&P 500 Index, Daily, The Upcoming Market Crash?I think that in mid-November we may be dealing with a stock market crash. Let's take a look at the volatility index of the S&P 500 stock index. The analogy of 2008 has been fulfilling almost perfectly so far. If it continues, the price should completely fill the gap and rebound from the green zone. If we break the red zone, I would expect a rebound from the newly created flip zone (gray box on the chart) and a dynamic increase in volatility. Volatility means big drops or big gains. In the current macroeconomic situation, it is difficult to think about dynamic increases, especially this winter. The potential trade on VIX to rebound from the green zone and break through the peaks from March 2020 has as much as a 20:1 risk-reward ratio (SL under the zone). I am sure there will be even more great opportunities for this scenario on shorting, i.e., SP500, Nasdaq 100 or DAX.

Make or break. Elliot wave count for the capitulation eventUpdate on my previous idea. The C wave up ended up extending into 4 waves. But that has now completed.
It's make or break for the bear market right now. Personally, I don't see us breaking out of the downtrend. But a fake-out is always possible.
Note that this technical analysis is a small part of the bearish case. The wider macro-economic environment bear case speaks for itself.
I'm long volatility via VIX Call options and CFDs.
What do you guys think?
*not financial advice.

NASDAQ Volatility Looking to Come Down to a 1.13 ExtensionWe have an Ascending Broadening Wedge with a Confirmed Partial-Decline and Hidden Bearish Divergence and a Potential Bearish BAMM Shark that is targeting $10.2657 on the NASDAQ Volatility Index.

$VIX Can Rise Soon - Watch Out #VIXTraders and Investors, US Indices have had a good rally. Dow Jones has been the leading one which printed the one of the biggest 3M bullish engulfing candles ever. SnP500 is also creating 3M bullish engulfing bit has been lagging behind the US30. NASDAQ (NAS100) is the lagging behind at the last spot. Russell 2000 has been also printing a bullish engulfing candle on the 3m Time frame. On the other hand, in the UK, UK100 (FTSE100) also has been going really strong. US30 did not have a single stock in a bearish category since 12th of October 2022! This also has broken an important level and trend line. It is overextended at the moment and a correction could be due. This has a perfect confluence with VIX (Volatility Index) which currently is in a demand zone and an FCP zone.
VIX can still fall further down because a pattern before failed, and a trend line was broken which makes it more bearish. But for now, a bounce could be due because of the demand zone. This can produce a bounce to the upside which can also coincide with corrections across indices and possibly precious metals too.
As we enter the last week of November, we can expect some good moves in the market which can turn into short term trading opportunities.
US30: (3M Time Frame)
US500: (3M Time Frame)
US100 (3M Time Frame)
UK100 (3M Time Frame)
RUSSELL2000 (3M Time Frame)
Please support this analysis by liking and sharing. 👍🙂
Rules:
1. Never trade too much
2. Never trade without a confirmation
3. Never rely on signals, do your own analysis and research too
✅ If you found this idea useful, hit the like button, subscribe and share it in other trading forums.
✅ Follow me for future ideas, trade set ups and the updates of this analysis
✅ Don't hesitate to share your ideas, comments, opinions and questions.
Take care and trade well
-Vik
____________________________________________________
📌 DISCLAIMER
The content on this analysis is subject to change at any time without notice and is provided for the sole purpose of education only.
Not a financial advice or signal. Please make your own independent investment decisions.
____________________________________________________

VOLATILITY INDEX Support Ahead! Buy!
Hello,Traders!
VOLATILITY INDEX has been falling
For a long time now and I think
That the index is oversold
So after the retest of the
Support level below
The price is likely to
Retest the resistance above
Buy!
Like, comment and subscribe to boost your trading!
See other ideas below too!

S&P500 and VIX Cycles say rally more likely from now onOn this 1W time-frame we look into the S&P500 index (SPX) and the Volatility Index (VIX) since 1990. We've used the Sine Waves on an (approximately) VIX bottom-to-bottom basis in order to identify what the S&P500 normally does at this part of the Cycle.
As you see from the current point and until VIX Cycle's next bottom (blue zone), the S&P500 in a total of three occasions, it has been on a Rally twice and the other time January 28 2022 - February 07 2005, it was on its way to the final drop of the Dotcom Bear Market, lasting 35 weeks and then a strong Rally followed.
If the above is anything to follow then the S&P500 has more probabilities of rising consistently for the rest of this part of VIX's Cycle and if the case is like 2002, then drop for the next 35 weeks and the rally aggressively.
Which scenario do you think is more likely?
-------------------------------------------------------------------------------
** Please LIKE 👍, SUBSCRIBE ✅, SHARE 🙌 and COMMENT ✍ if you enjoy this idea! Also share your ideas and charts in the comments section below! This is best way to keep it relevant, support me, keep the content here free and allow the idea to reach as many people as possible. **
-------------------------------------------------------------------------------
You may also TELL ME 🙋♀️🙋♂️ in the comments section which symbol you want me to analyze next and on which time-frame. The one with the most posts will be published tomorrow! 👏🎁
-------------------------------------------------------------------------------
👇 👇 👇 👇 👇 👇
💸💸💸💸💸💸
👇 👇 👇 👇 👇 👇

VIX Potential For A Pop In this update we review the recent price action the VIX (Volatility S&P500 Index) and identify the next high probability trading opportunity and price objectives to target

VIX - The recent high to be taken out soonThe volatility index, VIX, has spiked again, with the market marking new lows for the year. With these grim developments, we continue to be bullish on the index and expect it to reach our short-term price target of 35 USD soon. As if it was not enough, we expect VIX to continue higher over time. Therefore, we want to set a medium-term price target for VIX at 37 USD. Our preceding articles are attached to this idea.
Please feel free to express your ideas and thoughts in the comment section.
DISCLAIMER: This analysis is not intended to encourage any buying or selling of any particular securities. Furthermore, it should not be a basis for taking any trade action by an individual investor. Therefore, your own due diligence is highly advised before entering a trade.

What do USD/MXN and S&P 500 VIX have in common?The Mexican peso (MXN) is one of the conventional high-beta currencies traded on the forex market, making it extremely susceptible to changes in risk sentiment on global financial markets. When MXN inflows occur, it usually signals that investors are willing to take risks. In the last three months, USD/MXN has lost 3%, making the peso one of the best-performing currency in 2022.
Much of the MXN's outperformance has been the result of a very hawkish Mexican Central Bank, which hiked interest rates up to 9.25%, the highest since 2005. Another 75bps hike is expected at November 10th meeting, which would bring Mexican rates to 10%.
Aside from the Banxico hiking cycle in Mexico, the Peso has a strong correlation with global risk factors, namely the stock market volatility. To put it another way, historically, the USD/MXN pair and the S&P volatility index ( VIX ) have behaved similarly.
What are we seeing now?
The USD/MXN 14-day RSI indicator has entered oversold territory, highlighting the need for caution for investors willing to take on more risk at this stage, as MXN valuations are beginning to appear rather stretched.
Therefore, the bearish momentum for both USD/MXN and the VIX might have reached a peak.
Aside from the results of the midterm elections, investors will almost definitely have to digest another strong US CPI data this week. Analysts predict 8% annual inflation in October, with core inflation at 6.5%.
If actual results match or exceed estimates, Fed interest rate expectations will likely be reassessed higher. As the U.S. and Mexican economies are highly interdependent, the anticipated cyclical weakening of the U.S. economy bodes poorly for the Mexican economy and adds to MXN downward pressures.
Idea written by Piero Cingari, forex and commodity market specialist at Capital.com

Band Protocol: Anticipating Major Volatility In The Near FutureBand has already had a huge move upbut despite that it's not trading anywhere near the levels it used to trade at relative to it's highs. I think that now that the RSI has cooled down from it's recent highs that we will now see Band Continue the Bullish Momentum and make a move up to around $4.50 thereby completing a the Bull Flag it's Developed here.

Overview of Cryptocurrency Volatility - October, 2022.Analysis of the volatility index in October on different timeframes.
Currency - US Dollar (Calculated using Tradingview), or analogues of USDT, BUSD.
The selection is carried out according to the lists of cryptocurrencies that are represented on the spot and futures markets, with a total of more than a hundred coins.
Top 15 Coins (1 hour):
1. LIT - 821.42% (High&Low: 1061.56%)
2. MASK - 657.69% (High&Low: 1330.04%)
3. INJ - 638.83% (High&Low: 1340.52%)
4. KLAY - 616.82% (High&Low: 1308.41%)
5. SUSHI - 614.19% (High&Low: 1232.87%)
6. RSR - 604.01% (High&Low: 1270.21%)
7. OP - 573.36% (High&Low: 1080.69%)
8. DOGE - 555.22% (High&Low: 1243.72%)
9. REEF - 544.62% (High&Low: 1177.31%)
10. JASMY - 544.37% (High&Low: 1104.02%)
11. ENS - 525.54% (High&Low: 1073.75%)
12. LINA - 524.26% (High&Low: 1072.65%)
13. LDO - 518.83% (High&Low: 991.55%)
14. DODO - 515.82% (High&Low: 1052.47%)
15. CHZ - 494.96% (High&Low: 1020.97%)
The coin showed the worst result: BTC - 187.65% (High&Low: 434.12%)
Top 15 Coins (1 day):
1. KLAY - 211.88% (High&Low: 415.78%)
2. LIT - 191.73% (High&Low: 408.44%)
3. MASK - 161.83% (High&Low: 347.11%)
4. SUSHI - 161.16% (High&Low: 298.66%)
5. INJ - 140.81% (High&Low: 311.64%)
6. OP - 137.32% (High&Low: 290.38%)
7. DOGE - 133.23% (High&Low: 293.44%)
8. RSR - 132.17% (High&Low: 301.14%)
9. REEF - 119.91% (High&Low: 296.06%)
10. JASMY - 115.56% (High&Low: 268.9%)
11. LDO - 114.36% (High&Low: 230%)
12. ENS - 111.9% (High&Low: 247.81%)
13. CHZ - 106.25% (High&Low: 238.25%)
14. LINA - 103.79% (High&Low: 232.37%)
15. LEVER - 102.28% (High&Low: 232.06%)
The coin showed the worst result: TRX - 32.26% (High&Low: 81.59%)
Top 15 Coins (October):
1. DOGE - 106.01% (High&Low: 156.01%)
2. MASK - 96.62% (High&Low: 179.12%)
3. LIT - 56.74% (High&Low: 71.9%)
4. SUSHI - 44.99% (High&Low: 79.45%)
5. INJ - 43.12% (High&Low: 67.71%)
6. KLAY - 32.79% (High&Low: 114.76%)
7. DYDX - 28.94% (High&Low: 58.54%)
8. WOO - 28.38% (High&Low: 45.07%)
9. BAL - 28.23% (High&Low: 56.07%)
10. AXS - 26.73% (High&Low: 39.09%)
11. HNT - 24.53% (High&Low: 35.66%)
12. RSR - 24.33% (High&Low: 62.71%)
13. KNC - 23.04% (High&Low: 32.84%)
14. EGLD - 22.74% (High&Low: 28.78%)
15. JASMY - 22.32% (High&Low: 42.21%)
The coin showed the worst result: CELR - 0.07% (High&Low: 23.74%)
Thanks for your attention!

DAX: Upper Bouhmidi-Band is a important resistance today$DAX is turning up and is on its way towards 13,500. However, the air is thin in this area, already at the start of trading the index reversed even before the upper #BouhmidiBands

VIX - Will the FED spark another rally in the volatility index?On 18th October 2022, we warned investors that our short-term price target of 35 USD would be pushed further into the future if the market rallied until the FED meeting. Now, we are growing increasingly bullish on the index and expect it to return above 30 USD and then continue toward our short-term and medium-term price targets.
Please feel free to express your ideas and thoughts in the comment section.
DISCLAIMER: This analysis is not intended to encourage any buying or selling of any particular securities. Furthermore, it should not be a basis for taking any trade action by an individual investor. Therefore, your own due diligence is highly advised before entering a trade.

VIX Weekly Volatility Forecast 31/10 - 04/11 2022 VIX Weekly Volatility Forecast 31/10 - 04/11 2022
Currently the volatility for this week is around 12.11% , up from expected 8.8% last week.
According to ATR calculation, currently the volatility is located around 10th percentile.
Under this circumstances the expected movement of the candle is :
BEAR : 9.4% from the opening point of the weekly candle
BULL : 11.6% from the opening point of the weekly candle
At the same time, currently there is 22.8% that the movement within this weekly candle is going to
break and close either above or below the next channel:
TOP: 29.3
BOT: 24.5
Lastly, taking into account the previous weekly high and low there is a :
35% chance that we are going to touch the previous week high
60% chance that we are going to touch the previous week low

UVXY 4hr Bull FlagI sold in May and went away... It worked. I am back and charting part time until the weather chills more, then full time. The UVXY is potentially playing out a bull flag with good momentum potential to the upside (stoch rsi being low and moving up). We have clear stair stepping action as you zoom out. Not financial advice. Blessings!

Bitcoin: Volatitly cylce at the lowsVolatility on bitcoin is still very low, so there is no real interest in the crypto space which is normal in a risk-off environment. Keep in mind that everything is linked to FED policy, which is in a hawkish cycle right now, so higher yields, mean higher costs, thus its less free cash to be invested into the cryptos, stocks, etc. However, this hawkish cycle may come to an end if economic conditions will worsen in weeks and months ahead. A recession should force FED to slow down the hawks, and that's when new cycle will be seen in the markets. Ideally, this will be later this year or in 2023. That's when stocks could find a base and cryptos bounce away from the support as volatily may increase.

Pop or Drop? Only 5x in History has BTC done this!Traders,
Bitcoin has recently become less volatile than the markets. The chart here represents Bitcoin's volatility over the Dow's. In the bottom pane you will see that as the red line rises, it indicates BTC is becoming more volatile than the Dow. As it falls? Less. Rarely, has it touched the zero point (horizontal red line in bottom pane).
As you can see from my chart, we have only touched the zero point area only 4x in previous history. We are now on the 5th. After each touch (represented by the vertical line), huge moves have followed. The first was a 50% drop. Everything else thereafter was fairly significant pops. So far, the data shows a 75% probability of a pop. Will we make it 80% with this touch or is another big drop in store?
Either way, a big move is incoming? What's your call? Post in the comments below.
Stew

VIX - A strong warning to inexperienced investors! In September 2022, we warned investors about the volatility creeping back into the market and set price targets of 30 USD and 35 USD. Subsequently, in the following days after our warning, VIX skyrocketed, hit our price target of 30 USD, and halted its rise at 34.88 USD.
Despite the index halting its climb merely 0.12 USD below our price target, we remain very bullish. Indeed, we still expect our short-term price target of 35 USD to be reached within days or weeks.
However, we believe that VIX will not stop there but will continue higher, increasing the odds of a market crash. In our opinion, once VIX breaks above the range shown in the title picture, the market volatility conditions will start to resemble the market crash in 2020.
That would align with what we outlined about the general stock market progressing into the second stage of the bear market, which will be confirmed by declining corporate earnings over time. As a result, we expect trading conditions to become substantially more challenging; therefore, we voice a word of caution to inexperienced and lay traders.
Illustration 1.01
Illustration 1.01 displays the daily chart of VIX and two trendlines highlighting the uptrend.
Illustration 1.02
Illustration 1.02 shows the daily chart of the Nasdaq continuous futures, which have declined more than 30%. Additionally, the graph shows other major U.S. indices, all in the bear market territory.
Please feel free to express your ideas and thoughts in the comment section.
DISCLAIMER: This analysis is not intended to encourage any buying or selling of any particular securities. Furthermore, it should not be a basis for taking any trade action by an individual investor. Therefore, your own due diligence is highly advised before entering a trade.

VIX - Volatility is likely to continue higher In tandem with our expectations, VIX reached our short-term price target of 30 USD during the FED meeting, constituting a new high. This development hints at a deepening bear market, which foreshadows a more significant spike in volatility over the coming months. We draw this conclusion from a combination of factors. These include fundamental factors on the level of central banks, like higher interest rates and quantitative tightening, and technical factors associated with major stock market indices, all pointing to more weakness ahead. Due to that, we have no reason to change our bullish bias on the volatility index. Accordingly, we stick to our price target of 35 USD; however, we would like to change it from a medium-term price target to a short-term price target.
Please feel free to express your ideas and thoughts in the comment section.
DISCLAIMER: This analysis is not intended to encourage any buying or selling of any particular securities. Furthermore, it should not be a basis for taking any trade action by an individual investor. Therefore, your own due diligence is highly advised before entering a trade.
