VOLTAS In breakoutNSE:VOLTAS in breakout. As it approaches the key level of 1390, I recommend buying once it decisively crosses that threshold. With bullish momentum building, we can set our sights on the first target at 1480 and an ambitious second target at 1565!
Remember, investing requires careful analysis and risk management. Stay informed, and let’s navigate this market together! What are your thoughts? Are you eyeing VOLTAS or any other stocks for potential growth? Let’s discuss in the comments below! 💬💰 #StockMarket #InvestmentStrategy #VOLTAS #BreakoutTrading
Voltas

VOLTAS in BreakoutNSE:VOLTAS in Breakout! Falling trendline breakout in Prices and RSI indicate Positive. Target would be 1350

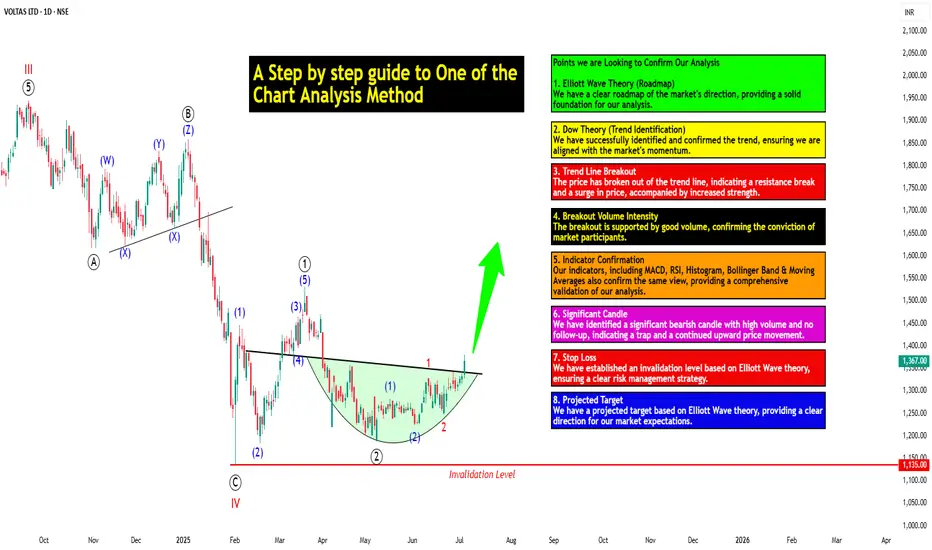
A Step-by-step Guide to One of the Chart Analysis Method: VOLTASHello Friends,
Welcome to RK_Chaarts,
Today we're going to learn step-by-step guide to one of the chart analysis Method by analyzing a chart of " VOLTAS LTD. " to identify a trend change opportunity.(Educational Post).
Let's get started!
Applying Elliott Wave Theory
According to Elliott Wave theory, we can see that the high of September 20, 2024, marked the end of the wave III of the cycle degree in Red. After that, a corrective wave unfolded, which reached its low on February 1, 2025. This was the wave IV of the cycle degree in Red, with a low of 1135.
The approximately 6 months correction ended here, and now the wave V of the cycle degree in Red has begun. Within this, there will be five sub-divisions of primary degree in black, which we can label as waves ((1)) to ((5)). Of these, waves ((1)) and ((2)) are complete, and we are possibly now in wave ((3)) of the Primary degree in Black.
Within wave ((3)), there will be five sub-divisions of intermediate degree in blue, of which waves (1) and (2) are complete, and the (3)rd intermediate degree in Blue is underway. Within this, there will be five sub-divisions waves of minor degree in red, of which 1 and 2 are complete, and today we saw the breakout of the 3 of the (3).
Possibly, this is a momentum move according to Elliott Wave theory, which we can call the third of the third of the third.
Now that we have this low of wave IV at ₹1135, it should not go below this level according to Elliott Wave theory. If it does, our current wave count will be invalidated. That's why we have an invalidation level within Elliott Wave, which according to this chart is at ₹1135. This low should not be breached. If it is breached for any reason, we'll have to re-analyze our entire count, and the counts could be different.
However, if this low holds, then the minimum target for wave V, based on the projection of wave theory, would be at least 100% to 123% of the fall from top III to bottom IV, which could take it to around ₹2000 to ₹2100. Shown in chart image below
Possible Elliott Wave Counts on Daily Time Frame Along with Invalidation level & Target levels.
Dow Theory Suggests now Up Trend
After forming the top of wave III, we can see that the price has moved downwards in a pattern of lower highs and lower lows. However, after completing the bottom of wave IV, the price has started forming a pattern of higher highs and higher lows, indicating that an uptrend has begun.
This is a clear signal that supports our wave counts moving upwards, i.e., towards an impulse move, based on Dow theory. The successful completion of wave IV and the initiation of the higher highs and higher lows pattern suggest a strong bullish trend, and we can expect the price to continue moving upwards. Shown in chart image below
Breakout with good intensity of Volumes
In this chart, we've observed a rounding bottom type chart pattern, and today, we've seen a breakout above the upper resistance trend line. Today's candle volume is also significantly higher than the average. Shown in chart images below
Chart Pattern: Rounding Bottom
Resistance Trendline Breakout with Good Intensity of Volumes
Supporting Indicators & Moving Averages
Also we can see that the current price has closed above the 50-day EMA and 100-day EMA. Additionally, indicators like RSI is above 60 and showing momentum, MACD is positive and above the zero line, and the histogram is also showing a breakout. Shown in chart images below
Breakout above 50DEMA & 100DEMA
RSI Breakout above 60+ on Daily Time Frame
Bullish side Breakout in Histogram on Daily Time Frame
MACD running Positive & above zero line on Daily Time Frame
Bollinger Band on Weekly
If we look at the weekly time frame, the current week's candle is above the middle Bollinger Band, indicating that the price is above the 20-period simple moving average on the weekly time frame. which is very good sign. Shown in chart image below
Price Trading above 20 SMA on Weekly Time Frame (Mid.Bollinger Band)
Significant Observation in Price Action & Volumes
Before the breakout, the rounding bottom chart pattern that was forming at the bottom can be interpreted as accumulation, as a red bearish candle with high volume appeared, marking the highest volume. Notably, no candle has closed below the low of that candle since then.
Although a gap-down candle occurred, it opened and closed bullish, indicating no selling pressure below that level. The absence of bearish follow-up and the subsequent breakout today are significant observations, combining price action and volume. This is a positive sign suggesting the price may move upwards. Shown in chart image below
This is how chart analysis is done for investment purposes. We've seen many signs in our favor, and yet we still use a stop loss to prevent significant losses in case the stock or market moves unexpectedly. This is what stop loss is all about - minimizing potential losses.
We've also discussed the target projection based on Wave theory, 123.6% level, which we explained through an image. So, friends, I hope you've understood the entire conclusion and learned how to analyze charts using different methods, one of which we shared with you today.
I am not Sebi registered analyst.
My studies are for educational purpose only.
Please Consult your financial advisor before trading or investing.
I am not responsible for any kinds of your profits and your losses.
Most investors treat trading as a hobby because they have a full-time job doing something else.
However, If you treat trading like a business, it will pay you like a business.
If you treat like a hobby, hobbies don't pay, they cost you...!
Hope this post is helpful to community
Thanks
RK💕
Disclaimer and Risk Warning.
The analysis and discussion provided on in.tradingview.com/u/RK_Chaarts/ is intended for educational purposes only and should not be relied upon for trading decisions. RK_Chaarts is not an investment adviser and the information provided here should not be taken as professional investment advice. Before buying or selling any investments, securities, or precious metals, it is recommended that you conduct your own due diligence. RK_Chaarts does not share in your profits and will not take responsibility for any losses you may incur. So Please Consult your financial advisor before trading or investing.
Voltas is ready to fly in blue sky, a perfect swing trade setupHello everyone, i hope you all will be doing good in your life and your Trading as well. Today i have brought a company from a TATA Group. Stock name is Voltas and it is engaged in the business of air conditioning, refrigeration, electro - mechanical projects as an EPC contractor both in domestic and international geographies (Middle East and Singapore) and engineering product services for mining, water management and treatment, construction equipments and textile industry.
Voltas was created 6 decades ago when Tata Sons joined hands with a swiss company Volkart Brothers. Voltas is also one of the most reputed engineering solution providers specializing in project management. The company has 5,000+ Customer sites actively managed across India
Unitary Cooling Products(UCP)
Unitary Cooling products comprises Room Air
Conditioners (RAC), Air Coolers, Air Purifiers, Water Heaters, Water Dispensers, Water Coolers, Visi Coolers, Chest Freezers, Cold Rooms & Medical Refrigeration.
As of Q1FY25, company has 21.2% market share in room Acs and 36% in window ACs . It has 30,000+ touchpoints, 330+ EBOs and 5 Experience Zones. The company sold 1 mn units in 88 days.
Market Cap
₹ 46,365 Cr.
Current Price
₹ 1,401
High / Low
₹ 1,946 / 1,013
Stock P/E
65.4
Book Value
₹ 190
Dividend Yield
0.39 %
ROCE
8.51 %
ROE
4.40 %
Face Value
₹ 1.00
Industry PE
82.8
Debt
₹ 871 Cr.
EPS
₹ 21.7
Promoter holding
30.3 %
Intrinsic Value
₹ 272
Return over 5years
15.1 %
Debt to equity
0.14
Net profit
₹ 709 Cr.
Disclaimer:- This analysis is for educational purposes only. Please trade responsibly and consult a financial advisor before making any decisions.
If you found this analysis helpful, don’t forget to like, follow, and share your thoughts in the comments below! Your support keeps me motivated to share more insights. Let’s grow and learn together—happy trading!

Voltas Ltd Technical Analysis1.Chart Pattern:
The stock has been consolidating in a descending channel, with a recent breakout above the upper trendline of the channel.
This breakout could indicate a bullish reversal if sustained.
2.Key Levels:
Support Zone: ₹1,670 - ₹1,700 (highlighted area).
Immediate Resistance: ₹1,732 (horizontal dashed black line).
Target 1: ₹1,762 (short-term resistance).
Target 2: ₹1,838 (medium-term resistance).
Target 3: ₹1,926 (long-term resistance).
3.Indicators:
RSI (14): Currently at 48.58, indicating neutral momentum. A move above 50 could strengthen bullish sentiment.
EMA Levels:
20 EMA: ₹1,697 (stock near this level).
50 EMA: ₹1,720.
100 EMA: ₹1,670 (acting as strong support).
200 EMA: ₹1,517 (long-term trend support).
4.Volume Analysis:
A significant spike in volume was observed during the breakout, supporting the bullish case.
5.Price Action:
The breakout candle indicates buying interest. If the stock holds above ₹1,732, it could move toward ₹1,762 and higher levels.
6.Risk-Reward:
Entry Zone: ₹1,700 - ₹1,732 (post-pullback to breakout zone).
Stop Loss: Below ₹1,670 (key support).
Target Range: ₹1,762 – ₹1,926.
Trading Plan
Bullish Scenario: A breakout above ₹1,732 and sustained momentum could lead to ₹1,762 and ₹1,838.
Bearish Risk: If the stock falls back into the channel and breaks below ₹1,670, the downtrend may resume.
Conclusion
Voltas Ltd. is at a critical juncture, showing potential for a bullish breakout. However, confirmation above ₹1,732 is crucial for the upward move. Traders should watch volume and price action for further clarity.

VOLTAS
NSE:VOLTAS
One Can enter now!
Or Wait for a retest of the trendline(BO)!
Or Wait for a better Risk:Reward Ratio!
Note :
1. One should go long with a StopLoss, below the Trendline or the Previous Swing Low.
2. Risk :Reward ratio should be minimum 1:2.
3. Plan your trade as per the Money Mangement and Risk Appetite.
Disclamier : You are responsible for your profits and loss.
The idea shared here is purely for Educational purpose.
Follow back, for more ideas and thier notifications on your email.
Support and Like incase the idea, works for you.

Voltas comes out of the Bullish TriangleVoltas NSE:VOLTAS comes out of the Bullish Triangle. You can buy at the current Price 1621. First Target would be 1740 and 2nd Target would be 1930( which you can achieve using GTT, if you are ready to take Risk)

Consolidation Breakout - VOLTAS📊 Script: VOLTAS
📊 Sector: Consumer Durables
📊 Industry: Air-conditioners
Key highlights: 💡⚡
📈 Script is giving consolidation breakout on daily chart.
📈 One can go for Swing Trade.
⏱️ C.M.P 📑💰- 1594
🟢 Target 🎯🏆 - 1668
⚠️ Stoploss ☠️🚫 - 1566
⚠️ Important: Always maintain your Risk & Reward Ratio.
✅Like and follow to never miss a new idea!✅
Disclaimer: I am not SEBI Registered Advisor. My posts are purely for training and educational purposes.
Eat🍜 Sleep😴 TradingView📈 Repeat 🔁
Happy learning with trading. Cheers!🥂

Voltas Ltd: Bullish Breakout Confirmed
Bullish breakout confirmed above the ₹1,556.20 resistance level.
Strong volume support indicating potential for continued upward momentum.
RSI indicates a healthy trend, not yet overbought.
Potential for further gains in the near term.
Keep an eye on upcoming market movements for opportunities.

Parallel Channel Breakout in VOLTASStock: VOLTAS
Current Price: 1560
Chart Pattern: Parallel Channel Breakout
Overview
VOLTAS has recently demonstrated a technical breakout from a well-defined parallel channel pattern. This breakout is an indication of potential bullish momentum, suggesting that the stock could experience significant upward movement. The breakout occurred at the 1560 level, which serves as a critical point of reference for further trading actions.
Trade Setup
Breakout Level: 1560
The breakout level represents the point at which the stock price moved above the upper boundary of the parallel channel, signaling a potential trend reversal or continuation in the upward direction.
Entry Strategy:
Go Long: Enter the trade at or slightly above the breakout level of 1560. This ensures that the breakout is confirmed and the trade is initiated in the direction of the new trend.
Target Levels
Initial Target: 1625
This target is set based on a conservative estimate of the stock's movement post-breakout. It represents an intermediate price level where profit-taking or partial exits might be considered.
Final Target: 1684
The final target is derived from the height of the parallel channel pattern. This level projects the full potential upside based on the channel’s dimensions, assuming the breakout sustains.
Risk Management
Stop Loss: 1500
A stop loss at 1500 is recommended to manage risk and protect against significant adverse movements. This level is strategically placed below the breakout point to allow some price fluctuation while still maintaining a controlled risk profile.
Technical Analysis
Pattern Confirmation: The breakout from the parallel channel is a bullish signal, indicating that the stock has moved beyond its previous range of consolidation. This suggests the potential for further upward momentum.
Upside Potential: The height of the parallel channel, when projected upward from the breakout level, provides a target range for potential price movement. The final target of 1684 is calculated based on this pattern’s projected extension.
Summary
Action: Go Long
Entry Point: At or above 1560
Stop Loss: 1500
Initial Target: 1625
Final Target: 1684
Additional Notes:
Continuously monitor market conditions and stock performance.
Adjust stop loss and target levels as needed based on ongoing technical analysis and market developments.
Consider using trailing stops to lock in profits as the stock price moves toward the target levels.
Disclaimer: This recommendation is based on technical analysis and educational purpose. Always conduct your own research and consider consulting with a financial advisor before making trading decisions.

VOLTAS AnalysisThe chart provided is of VOLTAS LTD on a weekly time frame (1W) from TradingView, showing various price levels and targets based on Fibonacci retracement levels and projections. Here's a detailed analysis and summary:
Key Components:
1. Price Levels:
- Current price: 1,490.75
- High: 1,559.85
- Low: 1,481.95
- Close: 1,490.75
2. Fibonacci Retracement Levels:
- 0.618: 1,312.35
- 0.5: 1,205.05
- 0: 750.20
3. Target Levels:
- Target 1: 1,659.85
- Target 2: 2,222.05 (1.618 Fibonacci extension)
4. Significant Support and Resistance:
- Historical support around 750.20
- Significant resistance at the high around 1,559.85
- Perfect retracement noted historically, which acted as a support level.
Analysis:
- The stock has experienced a strong uptrend from the retracement level of 750.20 to its current level.
- The recent price action has breached the Fibonacci retracement levels of 0.5 and 0.618, indicating a bullish momentum.
- The first target is set at 1,659.85 , suggesting a potential continuation of the uptrend.
- The second target, based on the 1.618 Fibonacci extension, is projected at 2,222.05 .
Summary:
The chart for VOLTAS LTD indicates a strong bullish trend with potential upside targets at 1,659.85 and 2,222.05 . The stock has already surpassed key Fibonacci retracement levels, reinforcing the bullish outlook. The significant support level at 750.20 and historical retracement patterns provide a solid foundation for the current uptrend.
The price movement suggests that if the current resistance around 1,559.85 is decisively broken, the stock could aim for the targets mentioned above.


Voltas Ltd (VOLTAS) AnalysisThe chart provided is of Voltas Ltd (VOLTAS) listed on the National Stock Exchange (NSE) of India, on a weekly timeframe. Here’s a detailed analysis and summary:
1. Trend Analysis:
- The stock was in a consolidation phase from mid-2021 to early 2023, trading in a range between approximately 1000 and 1300.
- Recently, the stock has shown strong bullish momentum, breaking out of this range and moving upwards.
2. Support and Resistance Levels:
- Support:
- Major support around 1327.60 and 1251.05.
- Resistance/Targets:
- Target 1: 1540.70 (61.8% Fibonacci retracement level)
- Target 2: 1721.55 (100% Fibonacci extension level)
- Target 3: 2012.15 (161.8% Fibonacci extension level)
3. Breakout:
- The stock has broken above the resistance level around 1327.60, indicating a potential bullish trend continuation.
- The breakout is accompanied by strong bullish candles, confirming the move.
4. Chart Patterns:
- There was a long consolidation period that formed a base, and the recent breakout suggests the beginning of a new uptrend.
- The stock appears to be forming higher highs and higher lows, a characteristic of an uptrend.
5. Fibonacci Retracement and Extension Levels:
- The chart shows Fibonacci retracement and extension levels, which provide potential target areas based on the recent price action.
- The 61.8% retracement level at 1540.70 is a key resistance level to watch.
- The 100% and 161.8% extension levels at 1721.55 and 2012.15, respectively, are further targets in case the bullish momentum continues.
6. Current Price Action:
- The current price is 1451.50, which is just above a key resistance level at 1485.85 (50% Fibonacci retracement level).
- The stock showed a strong weekly gain of 6.75%, indicating strong bullish sentiment.
Summary:
The chart of Voltas Ltd (VOLTAS) indicates a strong bullish breakout from a long consolidation phase, with the current price at 1451.50. Key support levels are at 1327.60 and 1251.05, while key resistance levels and targets are at 1540.70, 1721.55, and 2012.15. The recent breakout and strong bullish candles suggest the potential for further upside, with Fibonacci levels providing clear targets for future price action. The stock is currently showing strong bullish momentum, with higher highs and higher lows indicating an uptrend.

VOLTAS SHOW THE POWER OF TATA PRODUCT Last 4 year study of that share multiple range + flag + channel breakout and breakdown 3 year drama.Now that came on FIBONACCI .5 retracement point take two down side channel ready to take reversal and revenge of investors loss. Voltas price now near by 800 TRG 920/980/1080/1200/1400 that is trg based on quarterly / half yearly and year bases target
depend upon client investment and risk capacity and holding capacity you can adjust your TRG

#VOLTAS 1Hr Time FrameLikely to hit upper targets in a few days.
Rising RSI
Rising momentum
Good volume
Strategy supporting BUY position and hold till Target 4.
All the best.

VOLTAS LTDThe heat waves are running all over India, Voltas May be the beneficiary.
Please ignore the chart earlier published.
This chart is on weekly basis and with all counts in place.

Voltas something bad may is seen in the chart Voltas something bad may is seen in the chart.
As per the Kennedy Channeling Technique the Support is coming at 521.
As per Elliott Wave, Fibonacci retracement for wave 2 is expected to come around 521.
There might be some unexpected news that may impact the price pattern of Voltas Ltd.
Regards

Voltas, India, should target 1338 after crossing 1100Daily chart, the stock is generally in uptrend direction with some tendency for correction to 985, then will rebound to 1090. Above this 1090-1100, the target will be 1338
Technical indicators RSI and MACD are supporting the correction action
Stop loss should be considered below 965

Voltas Reaching Breakout zone Voltas is approaching the breakout zone above then level of 1063
invalid below 1020
target the level of 1140/1220

Voltas can be a high voltage high PE long term investment idea.Voltas Ltd. CMP – 843.65
Market Capitalization Rs 27,915.1Cr
Red Flags:🟥
High Valuation (P.E. = 139.9)
Declining cash from operations annual
FIIs are decreasing stake
Green Flags:🟩
No debt
Zero promoter pledge
MFs are increasing stake
Improving annual net profit
Previous Happy Candles Number – 41/100
New Happy Candles Number – 41/100
Fresh Entry/ averaging / compounding after closing above 854
Targets:872 and 888
Long term target: 902 and 915
Stop loss: Closing below 800
The above information is provided for educational purpose, analysis and paper trading only. Please don't treat this as a buy or sell recommendation for the stock. We do not guarantee any success in highly volatile market or otherwise. Stock market investment is subject to market risks which include global and regional risks. We will not be responsible for any Profit or loss that may occur due to any financial decision taken based on any data provided in this message.

Voltas - Elliott Wave CountVoltas - Elliott Wave Count
It appears that the market correction for Voltas has come to an end, and we can anticipate another upward impulse wave, provided that today's low remains stable. Anyone who opened a short position based on our previous view should consider closing it. However, if the market falls below the current low, the previously mentioned view will no longer be applicable.
Please note that this information is for educational purposes only, and it is crucial to trade with caution.
NSE:VOLTAS NSE:VOLTAS1! BSE:VOLTAS

Voltas - Elliott Wave CountVoltas - Elliott Wave Count
Voltas - The market appears to be in correction. it seems that Wave B is completed so the price is expected to decline with wave C. wave c target 830 to 825 range and consider 888 level for invalidation to this view.
Once the ABC correction is completed we can expect the next impulse up move.
Please note that this information is for educational purposes only, and it is crucial to trade with caution.
NSE:VOLTAS NSE:VOLTAS1! BSE:VOLTAS BSE:VOLTAS

Voltas Mid Term View - Double BottomVoltas is reversing from the 61.8% Fibonacci Retracement levels of the previous swing in Monthly Timeframe with a Double Bottom and Bullish RSI Divergence which is a very Bullish pattern.
Daily timeframe shows a price compression too.
Once the Monthly candle crosses above the Trendline, can look for the marked SUPPLY LEVELS as target levels. Bottom fishing with small SL!
