Gold: AnalysisHello Traders,
We are around a volume POC and we might see some problem at going further.
Scalpers could take short trades with LTF Confirmations,
Intraday (week) Traders could take long trades after breaking the white line regarding the 2h chart.
Longer-term traders could wait for break out of the zone confirmed by 4h chart.
Remember that Trump presidency could affect the geopolitical analysis including giving an end to Russian illegal invasion of Ukraine that make capitals out of gold heading to Stocks, however it may have effects on Longer-term traders.
Volumeanalysis

Distribution Patter for the last few months in Nvidia!Selling started at the top and the price has stayed in range, making multiple attempts for break out.
GREEN TRAPZONE - clear uptrend confirmed with Angle 6 in place now.
RED UMVD - Distribution, i.e. Profit selling.
Most likely a spike above the range as this would be the 3rd attempt, before falling back towards the GREEN TrapZone. Hopefully GREEN UMVD will show up for the strength.

Gold Pullback to Buy Zones Before 2737 TargetTrading Idea Summary CAPITALCOM:GOLD TVC:GOLD
The price has been very **bullish**, and the initial expectation was for it to reach and test the **4-hour order block at 2737**. However, it is now pulling back to **strong buy zones** before continuing higher.
---
Updated Analysis:
1. **Pullback to Key Buy Zones:** The price is approaching critical support levels, such as **Fibonacci 0.5** and high-volume areas.
2. **Preparing for Further Upside:** These zones can serve as good entry points for the continuation of the bullish trend.
---
Strategy:
- **Entry:** Around Fibonacci 0.5 (2,669-2,670) or the "golden pocket" zone (0.71-0.75).
- **Target (TP):** 2737 (4-hour order block).
- **Risk Management:** Stop-loss below high-volume areas, maintaining at least a 1:2 risk-to-reward ratio.
### Conclusion:
The price is showing a healthy pullback, creating a great buying opportunity before resuming the bullish trend towards 2737.

USDCHF ready to continue the upward move! Hello traders!
Price making a candlestick with a long lower shadow indicating a bounce into support. The downtrend was broken a few candles ago. Price at 61.8% Fib after a correction. Volume and CVD supporting the idea.
Timeframe: daily
Idea support:
- Price action
- Volume Analysis
- Trend analysis

Intraday Levels for Nasdaq 100 Futures - 12/12/2024This analysis focuses on the Nasdaq 100 Futures, aiming to identify potential support and resistance levels where the price could experience intraday bounces or trend reversals, as well as zones where the price might potentially break higher or move lower.
Considerations
The range used in this analysis serves only as a reference for broader-level insights.
For intraday operations, it is advisable to utilize a lower timeframe to refine entry and exit points more accurately.
To confirm the validity of these levels, it is essential to evaluate real-time conditions as the price approaches these zones. Factors such as pressure, trading volume, and Order Flow will play a critical role in determining whether these supports hold or are likely to be broken.

EURAUD is all set to continue its downward movement! The price is moving down within a descending channel. Right now, it bounced off the upper boundary and hit a key weekly resistance. A candlestick pattern with a long upper wick and a small body has formed. Plus, there's a rising wedge on the 4-hour chart. A short trade looks good based on price action and backed by volume analysis, which clearly shows a clear exhaustion of buyers.
Time Frame: daily
Idea support:
- Price action
- Volume Analysis
- Trend analysis

APT/USDT Trading ScenarioIn a persistently optimistic market environment, APT has shown a strong increase of over 250% from its local low, reaching $15.3.
Despite a sharp correction, the asset’s growth potential remains significant. Volume profile analysis indicates steady interest from market participants within the current price range. The asset is currently trading near the Point of Control (POC), a strong support zone, making it an attractive buying opportunity for anticipating a continuation of the upward trend.

Intraday Levels for Nasdaq 100 Futures - 12/10/2024This analysis focuses on the Nasdaq 100 Futures, aiming to identify potential support and resistance levels where the price could experience intraday bounces or trend reversals, as well as zones where the price might potentially break higher or move lower.
Considerations
The range used in this analysis serves only as a reference for broader-level insights.
For intraday operations, it is advisable to utilize a lower timeframe to refine entry and exit points more accurately.
To confirm the validity of these levels, it is essential to evaluate real-time conditions as the price approaches these zones. Factors such as pressure, trading volume, and Order Flow will play a critical role in determining whether these supports hold or are likely to be broken.

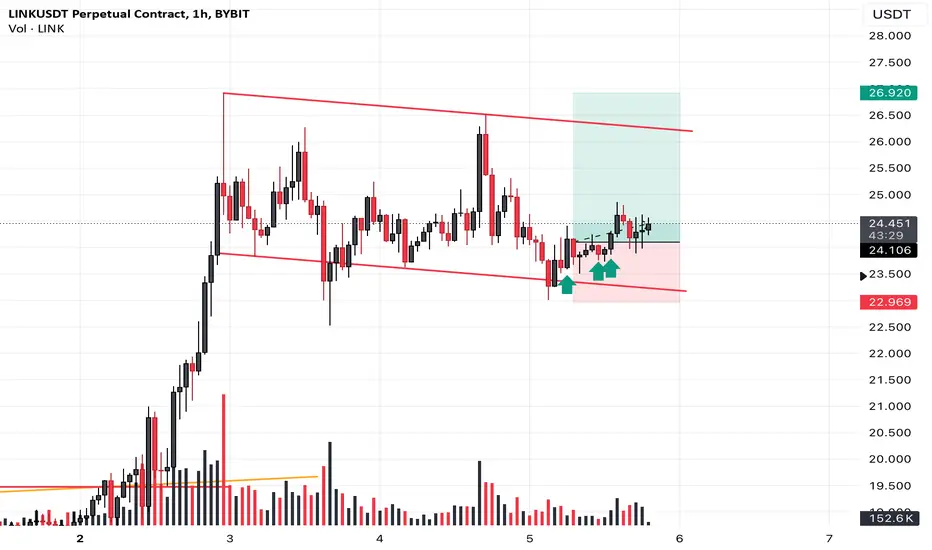
link-- long call
I see overall volume decrease, in addition to that the sellers has a diminished downward result--- a suggestion for seller absorption in the background. i want to see the price behavior around the resistance area.
Pfizer Ltd. - Short Position AnalysisChart Overview:
The chart indicates that the stock is in a clear downtrend, following a descending channel pattern. The price is nearing a key horizontal support level (marked in black), and a breakdown below this level may present a shorting opportunity.
Trade Setup for Short Position:
1.Entry Trigger: Below ₹5,028 on a daily closing basis.
2.Targets:
Target 1: ₹4,885 (first demand zone).
Target 2: ₹4,760 (strong support and lower boundary of the descending channel).
3.Stop Loss: Above ₹5,187 (recent swing high and red-dotted resistance level).
4.Risk-Reward Ratio: Ensure a favorable ratio of at least 1:2.
Alternate Scenario:
If ₹5,028 holds as support, the stock might see a pullback toward ₹5,187, where selling pressure could resume.

Polycab India Ltd. - Short Position SetupAnalysis for Short Position Condition:
1.Key Breakdown Level:
₹7,282 is a critical horizontal support level. A decisive breakdown below this level could trigger a bearish move.
2.Volume Profile Analysis:
Below ₹7,282, the volume profile shows limited buying interest until ₹6,997, suggesting a potential drop to this level.
Further weakness could see the stock test ₹6,746, where significant buying activity has previously occurred.
3.Trendline Breakdown:
The stock is trading within an ascending channel. A breakdown below ₹7,282 will confirm the failure of this channel, indicating a trend reversal.
4.Moving Averages:
The 20-day EMA is currently acting as dynamic support near ₹7,282. A breakdown will likely push the stock toward the 50-day EMA around ₹6,997.
The 200-day EMA near ₹6,746 is a long-term support level to monitor.
5.RSI (Relative Strength Index):
RSI is neutral but could head toward oversold levels if the breakdown occurs, strengthening the bearish view.
6.Volume Confirmation:
Watch for an increase in sell-side volume during the breakdown for confirmation.
Trade Plan for Short Positions:
Entry Trigger: Below ₹7,282.
Targets:
Target 1: ₹6,997
Target 2: ₹6,746
Stop Loss: Above ₹7,438 (previous high near resistance).
Risk-Reward Ratio: Ensure an ideal ratio of at least 1:2 for the trade.
Alternate Scenario:
If ₹7,282 holds and the stock bounces, the immediate upside resistance is ₹7,654, above which the stock may resume its bullish trend.

SBI Life Insurance Co. Ltd. - Technical Analysis UpdateSupport and Resistance Zones:
1.Key Support Zone: ₹1,385-₹1,463
This zone aligns with the Fibonacci 0.236 retracement level and the recent reversal point, making it a strong support.
2.Immediate Resistance Levels:
₹1,555 (Fibonacci 0.382 retracement).
₹1,630 (Fibonacci 0.5 retracement).
₹1,705 (Fibonacci 0.618 retracement), a crucial level to watch.
3.Fibonacci Retracement Levels:
The stock has retraced sharply from its high of ₹1,943 and is showing signs of reversal near the 0.236 Fibonacci level. A breakout above ₹1,500 could confirm bullish momentum toward higher Fibonacci levels.
4.Volume Analysis:
Volume appears to be increasing near the support zone, indicating buying interest from market participants.
The Volume Profile indicates strong accumulation between ₹1,400-₹1,500.
5.Moving Averages:
The stock is attempting to reclaim the 20-day EMA as a dynamic support.
A crossover above the 50-day EMA could signal further bullish strength.
6.RSI (Relative Strength Index):
RSI is recovering from oversold levels, indicating a possible trend reversal. A move above 50 would strengthen the bullish case.
7.Projection:
If the stock sustains above ₹1,463, it could aim for ₹1,555 in the short term and ₹1,705 in the medium term.
A break below ₹1,385 would invalidate this view and could lead to further downside.
Conclusion:
SBI Life Insurance is poised for a potential bounce-back. Traders can consider entries near the ₹1,450-₹1,470 range, targeting ₹1,555 and ₹1,705 with appropriate stop losses below ₹1,385.

Intraday Levels for Nasdaq 100 Futures - 12/06/2024This analysis focuses on the Nasdaq 100 Futures, aiming to identify potential support and resistance levels where the price could experience intraday bounces or trend reversals, as well as zones where the price might potentially break higher or move lower.
Considerations
The range used in this analysis serves only as a reference for broader-level insights.
For intraday operations, it is advisable to utilize a lower timeframe to refine entry and exit points more accurately.
To confirm the validity of these levels, it is essential to evaluate real-time conditions as the price approaches these zones. Factors such as pressure, trading volume, and Order Flow will play a critical role in determining whether these supports hold or are likely to be broken.

A case for long term investment and DCANYSE:VALE Is at an inflection point. It is a stock I have been watching for a long time as it has a nice Elliott wave pattern (If correct)
Here I present the Weekly chart as I consider it for my long term portfolio (3+ years BUY and Hold)
Although the chart presented here looks great (Read: Phenomenal), as an analyst utilising multiple methods, the story does not unfold as easily as I'd like.
As can be seen in the snapshot below there are multiple 'anomalies' still outstanding at those green zones on the magnified weekly chart. They may or may not be filled, but our awareness of them should cause us to move forward with caution.
On the Elliottwave side of things, there are two ways of looking at this. Either the recent top at ~$23 was wave i of 3 of (3) or the top of Primary w(1). If the latter is true then we will likely drop lower in to one of the green bands.
So the question remains - how do we take advantage of this given a drop to just above $3?
1) You can Dollar Cost Average in at each stage distributing your allocated capital
2) Wait for a bounce in a five wave move and enter at the correction for w2 of that bounce. Use the low for a stop loss.
There is no perfect way to manage the unknowns, you can only manage your primary objective, which should be to safeguard your capital -
If you want to know my thoughts on NYSE:VALE and other names give this a boost and follow.
best of luck!

Intraday Levels for Nasdaq 100 Futures - 12/05/2024This analysis focuses on the Nasdaq 100 Futures, aiming to identify potential support and resistance levels where the price could experience intraday bounces or trend reversals, as well as zones where the price might potentially break higher or move lower.
Considerations
To confirm the validity of these levels, it is essential to evaluate real-time conditions as the price approaches these zones. Factors such as pressure, trading volume, and Order Flow will play a critical role in determining whether these supports hold or are likely to be broken.

Bitcoin as Water. Will Bitcoin move towards less resistance?Hello,
The volume profile of this chart with 4-hour candles indicates two levels where high trading interest can be found. One of these levels is the orange level, $91.5k, around which Bitcoin built a strong support zone. The other level is the red line, $98.5k, where BTC has a strong sell zone. I expect the price action to unfold between these two zones. You may ask which would come next. The current price, $97.1k, is closer to the sell zone than the buy zone. Hitting the sell zone requires less effort than falling into the buy zone. A few people observed that the market often moves towards less resistance. This lesser resistance is now moving into the sell zone. Furthermore, MACD goes up like a bullish trend, which means technicals contribute to BTC hitting the sell zone next time. The white trendline on the chart can act as additional support, which means for BTC to fall into the buy zone, it has to cut down the white trendline. Again, the less resistance for the price would be not to cut down the support trendline, but to pump into the sell zone, which is open from the bottom up without additional resistance standing in the way.
Regards,
Ely

Analysis of NBCC (India) Limited ChartOverview:
The daily price chart of NBCC (India) Limited indicates a recovery phase after a significant correction from its 2024 highs. Key support and resistance levels are identified, along with a potential pattern that suggests consolidation followed by a breakout.
Key Observations:
1.Trend Analysis:
The stock was previously trading within an ascending channel, marked by higher highs and higher lows, indicating a bullish trend until August 2024.
Post-August, the stock broke below the channel, resulting in a sharp correction of approximately -30%.
2.Support Levels:
₹84.25: Strong support zone, as highlighted by multiple touches and a bounce from this level. It acted as a demand zone during the correction.
The stock formed a short-term base in the ₹84–₹90 range, leading to the current recovery.
3.Resistance Levels:
₹102.10: Immediate resistance, corresponding to the 100-day moving average (acting as a dynamic resistance).
₹111.44: The next major resistance from previous highs and the upper boundary of the consolidation zone.
4.Potential Pattern Formation:
A possible W-shaped reversal pattern is forming. If the stock sustains above ₹93.09 (mid-level support) and breaks ₹102.10, the next target could be ₹111.44.
The pattern suggests a consolidation phase before a potential breakout above ₹111.44.
5.Volume and RSI Analysis:
Volume: Increased buying interest near the ₹84 zone, indicating accumulation.
RSI: Currently recovering from oversold levels, indicating improving bullish momentum.
6.News Catalysts:
The Housing and Urban Development tie-up to develop a land parcel in Noida could provide a fundamental boost, aiding positive price action.
Projection and Strategy:
Bullish Scenario: Sustained breakout above ₹102.10 may lead to ₹111.44 and beyond. Traders could consider this level as a pivot point for long positions.
Bearish Scenario: Failure to hold ₹93.09 may lead to a retest of ₹84.25, where buyers could step in again.
Conclusion:
The stock is in a recovery phase, supported by strong fundamentals and technical patterns. Traders and investors should monitor key levels like ₹93.09 (support) and ₹102.10 (resistance) for confirmation of further trends.

Voltas Ltd Technical Analysis1.Chart Pattern:
The stock has been consolidating in a descending channel, with a recent breakout above the upper trendline of the channel.
This breakout could indicate a bullish reversal if sustained.
2.Key Levels:
Support Zone: ₹1,670 - ₹1,700 (highlighted area).
Immediate Resistance: ₹1,732 (horizontal dashed black line).
Target 1: ₹1,762 (short-term resistance).
Target 2: ₹1,838 (medium-term resistance).
Target 3: ₹1,926 (long-term resistance).
3.Indicators:
RSI (14): Currently at 48.58, indicating neutral momentum. A move above 50 could strengthen bullish sentiment.
EMA Levels:
20 EMA: ₹1,697 (stock near this level).
50 EMA: ₹1,720.
100 EMA: ₹1,670 (acting as strong support).
200 EMA: ₹1,517 (long-term trend support).
4.Volume Analysis:
A significant spike in volume was observed during the breakout, supporting the bullish case.
5.Price Action:
The breakout candle indicates buying interest. If the stock holds above ₹1,732, it could move toward ₹1,762 and higher levels.
6.Risk-Reward:
Entry Zone: ₹1,700 - ₹1,732 (post-pullback to breakout zone).
Stop Loss: Below ₹1,670 (key support).
Target Range: ₹1,762 – ₹1,926.
Trading Plan
Bullish Scenario: A breakout above ₹1,732 and sustained momentum could lead to ₹1,762 and ₹1,838.
Bearish Risk: If the stock falls back into the channel and breaks below ₹1,670, the downtrend may resume.
Conclusion
Voltas Ltd. is at a critical juncture, showing potential for a bullish breakout. However, confirmation above ₹1,732 is crucial for the upward move. Traders should watch volume and price action for further clarity.

NZD/CAD Short Price ActionI am trading this idea if we get a nice rejection from the zone with am hammer candle. engulfing, 4 hr pattern and a shift in the structure as well in 1hr or 30 min. this idea you can trade to a risk reward ratio of 1:5. the volume suits the zone perfectly as well.

UPL Ltd. (NSE: UPL) AnalysisOverview: UPL Ltd. is currently trading at ₹545.50, showing signs of consolidation near its short-term moving averages. The price is poised at a critical level with a potential for either a breakout or a breakdown, depending on market dynamics and volume activity.
Technical Insights:
1.Support and Resistance Levels:
Immediate Support: ₹528 (marked by recent lows and a strong demand zone).
Key Resistance: ₹549.50 (current level) and ₹584.05 (previous swing high and significant supply zone).
2.Volume Profile:
The visible range volume profile indicates a concentration of volume between ₹540-₹550, suggesting this zone as a pivot for future price action.
A breakout above ₹549.50 could attract higher volumes, pushing the stock towards ₹584.
3.Moving Averages:
The stock is near its 20-day and 50-day EMAs, indicating a neutral short-term trend.
A clear break above the 200-day EMA would signal a shift in momentum towards the bulls.
4.RSI (Relative Strength Index):
RSI is hovering around 50, indicating a lack of strong momentum. A breakout above resistance could drive RSI towards overbought territory, confirming bullishness.
Scenarios:
Bullish Case: A breakout above ₹549.50 with high volumes could see the stock targeting ₹584.05 in the short term. Sustained momentum may lead to further upside towards ₹600.
Bearish Case: Failure to sustain above ₹549.50 might result in a pullback to ₹528. A breakdown below ₹528 could open doors for lower levels, around ₹510.
Trading Plan:
Entry:
Bullish: Above ₹550 for targets of ₹584 and ₹600.
Bearish: Below ₹528 for targets of ₹510.
Stop-Loss:
Bullish: ₹535.
Bearish: ₹540.
Final Thoughts: UPL Ltd. is at a crucial level with a well-defined risk-reward setup. Traders should wait for confirmation of direction with strong volume support before taking positions. Monitor global agrochemical sector trends and news for potential catalysts.

Zydus Lifesciences (NSE:ZYDUSLIFE)Overview: Zydus Lifesciences is currently at an interesting juncture, with signs of a potential reversal from recent lows. The price action suggests a possible recovery towards higher resistance levels, supported by technical indicators and market sentiment. Nomura's revised price target of ₹1,030, while maintaining a Neutral rating, aligns with this view.
Key Levels to Watch:
Current Price: ₹966.65
Immediate Support (SL): ₹902.55
Key Resistance Zones: ₹1,008.35, ₹1,041.45, and ₹1,102.15
Technical Analysis:
Volume Profile: The visible range volume profile shows significant accumulation near ₹1,000, which could act as a strong magnet for the price.
Moving Averages: The stock has started reclaiming its short-term moving averages. A breakout above the 200-day MA would confirm bullish momentum.
RSI (Relative Strength Index): The RSI is trending upwards, indicating improving bullish momentum. Divergence suggests a potential reversal.
Price Action: The formation of higher lows near ₹949 reinforces the possibility of a short-term recovery.
Trading Strategy:
Entry Zone: Between ₹950 and ₹970, as the stock shows stability near support levels.
Stop-Loss: Strict stop-loss at ₹902.55 to limit downside risk.
Targets:
Target 1: ₹1,008.35
Target 2: ₹1,041.45
Extended Target: ₹1,102.15
Risk Management:
Position size will depend on risk tolerance, ensuring a Risk-Reward ratio of at least 1:2.
Avoid chasing the price above ₹970 if momentum wanes.
Final Thoughts: Zydus Lifesciences presents a favorable risk-reward scenario with clear technical signals for a rebound. However, macroeconomic factors and sector performance will play a critical role in sustaining the move. Traders should monitor price action near the resistance zones closely for signs of continuation or rejection.

GMX/USDT Trading ScenarioGMX is another undervalued asset in the current market. Its price is currently 70% below its all-time high (ATH), yet there is potential for it to reach that level again. The asset is currently trading at $28.37, close to its local minimum.
From a volume analysis perspective, the asset is at the Point of Control (POC), which formed in May 2024, when the asset was in an accumulation phase. Trading volumes also indicate heightened interest from market participants in this price range.
Despite the overall positive trend, the asset has not yet shown significant growth. However, with the upcoming altseason, it has strong potential to surpass its historical maximum.
