PAY ATTENTION! Another Anomaly on USD Big Banks Fooling Us...Another anomaly, this time on USD/CAD. Big Banks and big Financial Institutions are trying to fool us again. A huge move up on USD/CAD, huge green candle BUT below average Volume.
The daily candle has stopped a little bit above the March, April, May, June, July, August, September combined POC but below-average volume. Again, to break such strong POC without Volume is REALLY odd.
In my humble opinion, this price will go up until around 1.33826 (which is a strong supply zone and June POC) to shake it up and panic the retailers and then strongly and heavily slump down.
Be ready!
Volumepriceanalysis

CAD/JPY - Volume Profile + Exponential Moving Average + Volume Short on CAD/JPY, as you all can see, the price is at the top of the 2/1 Gann Fan line. Aiming at least 81.324
You have to have patience!!! This is a long-term GAME!

AUDCHF Hitting the Lowest Weekly Support If you take a look at the weekly TF you will see that its at its lowest support zone which makes it a very strong case to start moving up, also if you take a look at the other Forex AUD pairs you will see that they are all poised for a bull run.
as you can see here that the daily had given us great confirmation for the bull move providing us a shooting star candle with high volume at the support level, followed by another Bullish candlestick formation and again a increase in volume.
full Disclosure: Im already in, I got in at the test of the last candle.
based on your trading style you can either wait for a pullback or just enter as is, whichever way you feel more comfortable,
I can not tell you what to do I can only advise you based on my expiriance.
Happy & Easy Trading

Pending Limit Order: Buy EUR/JPY: @ 122.23Pending Limit Order:
Buy EUR/JPY @ 122.23
TP: 122.38
SL: 122.08

BTCUSD 30 minute chart (6/6/2019)Good morning, traders. I am more cautious at this time than what I have been. Price has failed to get back above the 21 EMA on the daily TF, which sits at $7940. As I said yesterday, this doesn't guarantee that price will go down further but it does increase the odds of it doing so. Also, I mentioned yesterday that we have either completed an ABC correction or just the first 3 waves of a 5 wave set. If it is the latter, then we should be looking for price to target daily demand between $6975-$7215 (though I could see price possibly targeting as low as $6500, since the May 17th drop across the exchanges is so different) where a bounce should take us to $7600, at least. Daily Stoch RSI is curled up at this time suggesting that we may see demand kick in on the larger TF sooner rather than later, and the daily pivot remains just below price at $7635. This does not mean that we can't see price fall further before that happens.
In the local TR, I don't like the lack of demand participation so far. We are just seeing low quality demand. The participation, at this time, appears to be on the supply side. That doesn't mean that we can't see things change as the TR continues developing, but currently this suggests that we could see price falling further as mentioned above. If price breaks through the descending blue resistance with volume, then higher prices could be in the cards. However, as long as that resistance holds price in check I am leaning toward further downside at this time. This is a very preliminary look at the TR, so keep in mind that things can, and often do, change as it develops. If we start seeing demand building greater than what it has been, and especially if that's coupled with supply continuing to drop, there is a likelihood that we can see price continue higher as outlined yesterday. But we absolutely need to see demand participation increase (i.e. larger demand volume).
The red horizontal line is the weekly/monthly pivot, so getting back above it would be bullish. Doing so would also take price above the descending channel's EQ, which is also bullish. The purple dashed line is the 2018 TR's EQ. Again, price moving above that level is bullish. As we can see, the 30 minute pivot sits up around $8600, so price has quite a distance to go in order to reach it. But, movement above it is bullish. Remember, price is currently above the daily pivot which is bullish on that larger TF, but if we don't start seeing some upward movement then my expectation is a drop below it. The daily S1 pivot is at $6180 and the bottom 2018 TR support is at $5920. These are some of the guidelines that traders can use to measure how price is doing for now.
Currently, the 30 minute Stoch RSI is bouncing off the bottom in oversold and is nearing a bullish cross while the RSI is slightly bearish at 44. In terms of price, we do see higher lows toward the resistance at the top of the local TR (the overhead supply keeping price in check so far). This means that we could be seeing an ascending triangle forming with a target of $8270. If price closes below the swing low of $7570.90 (dotted blue line) then the odds of falling further increase.
The big picture is that even if we see price head toward the $6000s as I have been talking about as a possibility for weeks now, it should just be wave 4 which means we've got a much higher target to complete wave 5. Then we would see the larger wave 2 retracement. Alts seem to be holding pretty well so far and there are opportunities out there for those not interested in trading BTC at these levels.
Every day, we have a choice to act positively or negatively, so if you get a chance, do something decent for someone today which could be as simple as sharing a nice word with them. You just might change their day, or even their life.
You can always click on the "share" button in the lower right hand of the screen, under the chart, and then click on "Make it mine" from the popup menu in order to get a live version of the chart that you can explore on your own.

BTCUSD 15 minute/1D charts (4/4/2019)Good morning, traders. Price tapped out just shy of the $5300 level at $5282 yesterday. Those in our Discord were alerted three hours prior to the $4800 target of the drop and price hit $4800.50 (missed it by 0.50). I then posted a target of the $5075-$5110 area as resistance and that was hit a few hours later. Unfortunately I often don't think about updating TV. So where are we at now? Sideways, continuing to find resistance at the 15 minute pivot.
The orange zone is the monthly OB and the green inside of it is the daily OB, as I have pointed out numerous times before. My short survived the extra bit of push up yesterday, so I remain short toward $4400-$4500 with the caveats of possible wicks lower which I published yesterday and/or the day before. Initial support will likely be found around $4700 at the top of the monthly OB. The 4H RSI dropped through channel support suggesting that more downside is in the cards. Stoch RSI on the 4H is nearing the bottom. The 1H RSI continues to drop and is expected to reach oversold and Stoch RSI is nearing the top. Price is finding resistance at the 21 EMA on the 1H. As mentioned previously, daily RSI is at the top of the ascending channel and Stoch RSI is topped out, suggesting a reversal on that larger TF. Additionally, yesterday's volume almost hit the previous day's volume, yet the candle spread was much smaller and the day ended with a long upper wick. This is indicative of supply coming in and demand fatiguing. The daily 21 EMA is currently at the R1 pivot around $4250.
If we can get the correction toward $4500, then that should set up a 5th wave targeting the $6250-$6500 zone. In that case, we would then expect to see a retracement back toward the monthly OB for a final time before further price appreciation as the wave 2 of the larger degree completes. Currently, 15 minute RSI has printed hidden bearish divergence and supply volume spikes are showing up increasingly larger near that pivot suggesting increasing selling into demand which should result in price dropping.
Every day, we have a choice to act positively or negatively, so if you get a chance, do something decent for someone today which could be as simple as sharing a nice word with them. You just might change their day, or even their life.
Remember, you can always click on the "share" button in the lower right hand of the screen, under the chart, and then click on "Make it mine" from the popup menu in order to get a live version of the chart that you can explore on your own.

BTC/USD Volume Price Confirmation for Uptrend =>After the big fall into sub 6k level,first time bitcoin is showing us some positive volume feedback.
=>Volume follows the price unlike the other times it tested 4000-4200 resistance.
=>We are probably at the latter stage of Wyckoff accumulation.
Target1:4700 1 Month
Target2:5200 1-3 Months

GBPNZD Going Fishing for Low Volume NodesWe've been trading in previous days range for quite a while. It's likely price will pop out and explore above, or below.
My analysis seems to imply below. If so, we have a pretty sweet short opportunity for about 80 pips (from where I'm entering, which is now). Take profit at or barely above low volume node @ 1.93530.
Long position from there? Possibly.. haven't looked into it yet.
Good luck!

BTCUSD Flash Crash Possibilities! Here's a three-dimensional volume analysis of BTCUSD on Bitfinex memory pool. This is pure VOLUME ANALYSIS based off VPA (Volume Price Analysis). These are the major support levels I'm looking at for the long of a lifetime, cheers guys. Major FUD may be required to reach these levels ie exchange hack or greater crypto takeover(flippening).

Bet on Smart MoneyFSM seems reaching at a level where it couldn't make higher. However, Since June, FSM's volume are increased significantly. It indicates that some Momentum traders accumulated around here(6.00-6.20). This is a good bet to move higher with the smart money.


USDJPY OVERVIEWUSDJPY has been in a congestion phase for almost 2 years on the weekly timeframe. We can see multiple touches both of the resistance line and of the support line and a Fake Out. In the previous weeks we tested the resistance line again with a shooting star with above average volume (VPA). Stochastic shows us that it was overbought on the weekly time frame. Volume At Price (VAP) shows us a very strong area which will be hard to break. Therefore we want to see a big effort by the insiders (visible on our Volume Price Analysis) to aspect a big result and then a True Break Out. I think the market will get around 108.000 in the next few months. Even though it's a bit early to say that and we need more confirmations, I do aspect the market to reach the support level.
This is an overal overview of UJ, in the next hours I will look deeper in the chart, analysing the D1 and the H4 timeframes so that I can provide a good set up for a possible entry.

Goldman Sachs: Most signs are pointing up This will be a short post because there is a lot of verbiage in the chart. Generally while I definitely see a few bearish signs in Goldmans chart most are relatively bullish. Keep in mind these are weekly candlesticks used to project what may happen in several weeks or potentially months time so don't infer anything about day to day movements from this analysis. Questions and criticisms welcome, thanks.

Today's Trading Plan based the on volume analysis: ETHUSDBulls won in the bloody battle with the bears yesterday and pushed the price above 685. Then they confirmed their intentions by buying a single large order for 227 ETH at a price of 675 at 22.37 GMT (1st arrow on the screenshot). In an hour, once again a single large order for 279 ETH went through at a price of 686 USD at 23.57 GMT in Time&sales (2nd arrow on the screen). A good area for shopping is in the price range of 675-680 USD with the first goal 740-750 USD (3rd arrow on the screenshot).
Our backup plan: a breakout through 675 and to test it from below (4th on the screenshot).

Analysis of the current situation based on volume analysis. ETHUSD was not kept by buyers at a price of 680 USD. An order for 300 ETH at ASK price went through on Time&Sales at 12:14 GTM, orders for 78.15,77.70 and 104.656 ETH at ASK price went through at 13:54 GTM. A good option is to short with short stop at 687 test 680 from the bottom.

Ethereum Bottom Starting To FormHey friends,
Here is another example for these unique indicators: UncleBo - ChillyWilly@2 - FibEvaluation
All you have to do for access:
1- Commend & Like on UncleBo , FibEvaluation , ChillyWilly@2
--------------------------------------
Let me know your question right below or if you can not commend, pm me.
Highly recommend using UncleBo indicator which does all the price-momentum-volume analysis all together with FibEvaluation & ChillyWilly@2

Reversal? Low Volume & Downtrend BUT ADX rising(-DI above +DI)..I would feel more confident if the ADX (black line) is above 20 but in a falling state. In this case it looks as if it increasing...
My interpretation of Volume and Price:
Volume Share Price Interpretation
Decline Uptrend Bearish
Decline Downtrend Bullish
Increase Uptrend Bullish
Increase Downtred Bearish
What are your thoughts on GLBS ? How do you translate volume and price increase/decrease?
If you have recommendations or tips - please, let me know below at the comment section.
/Pat

0.7300 region will be a nice resistance. NZDUSD 11/02/18Look at the chart for explanation, entry price and take profit levels.
Good luck
Trading Bug

1.2250 is the keeper of the Slide *Easy 150 Pips EURUSD Setup*Bears are fighting hard at the 1.2500 level and the price action is heading below the value low.
Seeing some bullish momentum in USD and Euro short term weakness, it would be safe to stick with bears.
Remember, this is a counter trend trade.
Watch 1.22500 level, it it breaks, more bear shall follow.
Look at the chart for TP levels.
GL
Trading Bug

*Wait for a higher ground to short. LRE set up on AUDJPY* 7/2/18Look at the charts for description and TP level.
Good Luck
Trading Bug

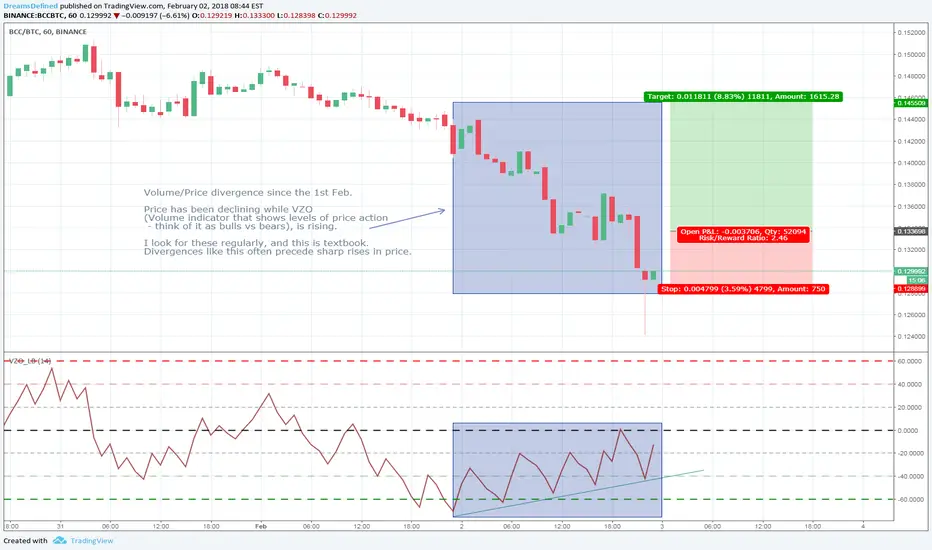
BCC/BTC - Volume/Price Divergence - 8-10% Swing OpportunityBCC/BTC is now exhibiting a Volume/Price divergence, and has been for the better part of a day.
Using the VZO Indicator, which is a leading indicator, gives us an idea of bulls vs bears action in the market. A divergence such as this demonstrates that there are a lot of bulls (and therefore upward pressure on prices) that haven't yet been reflected in the price action. Given this, we look to enter once a strong upward movement is determined. Usually, I wait for a green closing candle (and a strong close relative to total trading range for that period), and then set a conditional buy order above the high of the previous candle. E.g. if the previous candle's high was 0.133300 (such as BCC 0.11% looks like it will), I'll set a conditional buy at 0.133700. This hopefully will catch any potential movement up - price movements based on a Volume/Price divergence can be extremely quick - and prevents us from being bounced into the trade via a high shadow candle.
Look to enter this trade at 0.133700 - 0.134700 , and then set a stop loss below the lowest closing price (which at the moment is 0.130303). This is a very tight stop loss (3.5%), but it's preferable to take a small loss on a volatile movement such as this.
Time is of the essence with these! So get in quickly.
Note: the last candle was a hammer candle, and the current candle has ranged high (and low), so this could go either way yet. Always exercise caution. You're better off missing a few % points of profit to negate the risk of a loss.
lots of buy orders for a bounce back to 10500Based on the volume of BTC i do not see BTC going below 9500 based on the buy orders. I wish i can make my trend lines go lower, but i can only make my trend line go down to 9500, i only see it go down that low then its going back to 10500 don't let the whales fool you i would say entry point is 9700

ADANIPORTS Short term Positional Call Adani Ports Trading technical call for short term
CMP 433.5, Closed Based SL 415 Targets 445 450 456
For Education purpose only
