Volumepriceanalysis

Soybeans look ready to run againAfter a nice pullback and test it could be time to start another move to the upside as long as 930 holds in Beans!

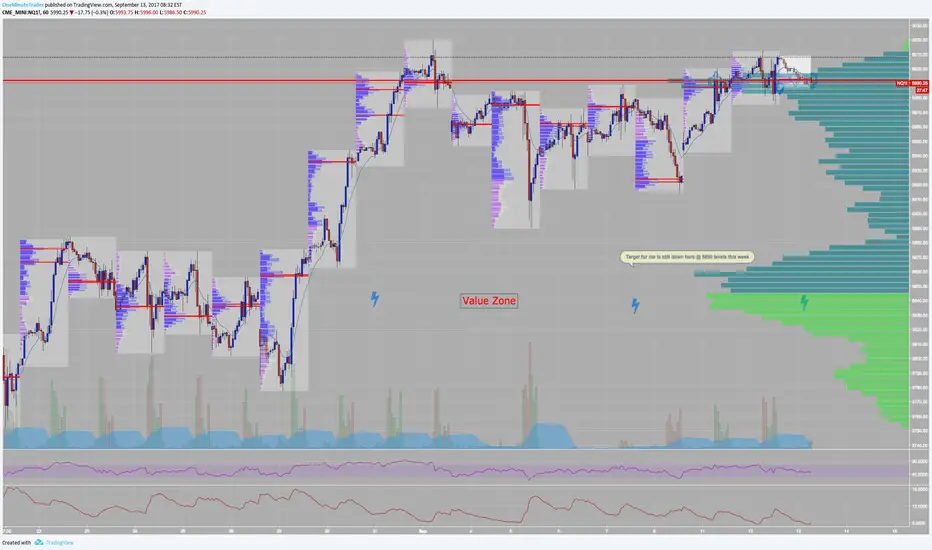
$NQ_F same prices as market open on Monday am, 48 hours Later Nasdaq gapped up to these prices Monday at Open so in 48 hours we have gone nowhere. Much Ado about Nothing so far after failing to make new all time highs in the NQ and Russell and Dow, only the ES has gapped and made new all time highs this week. We see a chance to test the zone lower if we can't close over new highs by week end!
$BTCUSD still plunging and looking like $3700 is next moveCME_MINI:ES The 4 hour chart points lower and rallies continue to rotate lower and lows expanding lower $3700 next stop.


GBPUSD SHORT PROJECT (H4/Daily)GBPUSD faced strong resistance at 1.307x/8x area which may become point IV of a grand bullish formation if this level holds well.
There is a number of factors which support this possibility:
RSI is showing bearish divergence at H4/H1/m30 timeframes.
The volume showed support for possible reversal of the recent bullish trend.
Currently, the price is floating in nearly the same area as when the previous day session started. Neither side is being supported by significant volume change.
If this accumulation phase is followed by bearish candles backed by spikes of medium/high volume, it will be the strong confirmation for further move to the South.
Taking all this into consideration (especially short SL vs good potential TP), even though though no bearish WW is currently active, 6 positions were opened.


Buy 750 points / 75 pips!we have a good oppurtinity to buy, don't forget the main trend is UP Trend!
It is just your personal desicion if you win or lose, be careful and follow your own Strategy and System!
to visit my Facebook page: adf.ly
to visit my Youtube Channel: adf.ly

** EUR/AUD 4HR Update. Short Opportunity**Price rejection at the resistance area. Now its the time to short now with a good RR ratio.
1.4866 region is TP 1
1.4781 region is the TP 2.
GL

EURAUD LONGNice downtrend chanel, but what is happening in that accumulation on then top of channel? High volume activity on lows indcates me that market makers are filling long orders.
I expect that boys will break this chanel and will go test high from past.

Massive Down Trend !!In this Chart we are seeing a very weak Trend *weak = down movement* it all started from there 3 little up bars
look at their volumes, very low, and every up bar with low volume it means lack of demand.
no look at No Demand 2 it tried to test the Demand, the result was no demand! it's very good signal of the down trend.
so we have 3 targets, and each target the prise will take a break to test the demand, if we found high volume on the up bars it could be an alert to exit the short trade,
however, the Resistance 2 it's diffecult to predict if the price will reach this level, because we have the channel down line, and another resistance line, maybe the candle or the bar will have a very long tail then maybe it will close away from the buttom then it will be a signal to continue rising!
It is just your personal desicion if you win or lose, be careful and follow your own Strategy and System!
to visit my Facebook page: adf.ly
to visit my Youtube Channel: adf.ly

Bitcoin Near-term Support LevelsOne month chart showing current support levels in bitcoin based on price action. These levels can be used to set stops or find entry targets. For the curious, P.OC = point of control (see Volume Profile for more info)

OMEX Long Opportunity Diamond/Cloud Breakout/Vol MovAvgExp CrossI have NO idea what the fundamentals are on this stock. I only know what I see here on the chart. I am an intermediate scalper/order-flow/tape-reading and technical analysis stock guy. OMEX caught my attention. I've been testing scanning and new ideas.
Moving average cross of the ~50 over the ~200. All aligned well with the trend aligned up. Ichimoku Breakout on the daily. Diamond pattern. Bull Flag. Bam! Highly manipulated at this level but the TA says what the TA says. It is also trading above long term price on volume. Check it out!
Volume could definitely move this.

NZDUSD long idea (m30/H1)The long blue wave was formed at m30/H1 time frame and once successful, it will become the natural part of the major yellow structure.
As the bulls have been keeping pushing this pair up without significant resistance since 11 May 2017, the minor pattern has good chances to succeed even though currently it is not being supported by RSI divergence/volume/data.
I expect the major resistance to start only at the previous maximum area (point III*).
Opened 3 buy positions at 0.7428, SL 0.7389, TP 0.7470/0.74984

EUR/AUD m15 volumePrice move away form distribution box in short direction after creating SOT pattern and Spread candle type. Good strong down reaction of price.
Potential short after retrace.

CAD/JPY H4Pair from beginning of June on h4 timeframe was in an uptrend.
Now it is possible to observe that Demand is decreasing and SOT formation created.
There is also typical "spread" candle typical to end of trend and price start to be in an accumulation.
I will be looking for sell signal based on cumulate volume indicator.
Also price is in control of Daily Supply zone.

Reversal looking likely here. Need confirming volume. The last few days large blocks have started coming in. The largest block out of all was 150k shares within a 3 minute time period.

*Nice Long*GBP has been recovering from short-term drop due to election loom, given the fact that it didnt break the support trend line clearly. *1.29285* would be a good long entry and TP at 1.304.
Trade Safe


Watch for Bitcoin Weekly Shooting Star Reversal CandleI've been consistent in my analysis since July of last year (see related ideas). It certainly surpassed my projections. The mainstream media is finally covering bitcoin AFTER it has rallied $2000 or moved up at least 300%. Now, "experts" will explain this rally to you and justify why "this time is different." I view this as a major sell signal (i.e. optimism at extremes).
www.cnbc.com
Book recommendations:
Animal Spirits: How Human Psychology Drives the Economy, and Why It Matters for Global Capitalism
This Time Is Different: Eight Centuries of Financial Folly

EURUSD [240] - Deciding Where to Go?Since Monday, price has been hovering at just above the 1.0600 decision area for roughly 9 bars now (good chance something is about to be decided).
Buying potential: If the pair rises past the 1.0700 void to the 1.0730 area, we may have little resistance further up.
If selling, the key area is 1.0440.

GBPUSD [240] Volume AreasFellow traders, if price hits the volume void at around 1.2085 , it'll likely rise to the decision area around 1.2155 before taking a dip or moving on up. There are more ' buyers ' than there are ' sellers ' at these levels, but more sell pressure at around 1.2300 .
I am currently not in any trade before the inauguration, just watching for now.
All the best!

Wyckoff Accumulation Phases of Credit SuisseSome remarks on the price evolution of CS
Credit Suisse stock was in a downtrend which ended with a selling climax (SCLX) on February 11 this year. After that CS showed signs of being accumulated. The Brexit vote initiated a huge shake out. During this shake out it broke below its trading range, after which it trended back up into the trading range. Here it tested the 12.56 support twice; once on the Deutsche Bank fine news and also today after CEO Tidjane Thiam said he expects a challenging third quarter. Currently it is in Phase D, or alternatively it might still be in phase B.
Notice the volume peaks on down swings. This is a sign of buying pressure caused by the Composite Operator (or Insiders as Anna Coulling calls them) which buy in the lower end of the trading range, as discussed in the book "A Complete Guide to Volume Price Analysis " by Anna Coulling.
I posted this idea before (linked below).
On that chart you see the On Balance Volume indicator. Notice the explosion of the on balance volume for CS, right after the Brexit. And you know what they say: "volume precedes price".
I also labeled the chart of CSGNZ. Notice the differences in volume, particularly during the selling climax:
Some facts that support the hypothesis suggested by the technical analysis:
STRONG HANDS HOLDING CS
A very large part of CS shares is held by a few very large long-term investors that don't sell on weakness but use it to add to their core position (smart money). In fact they've added just recently. These kinds of buyers and shareholders explain the pattern we see in the CS and CSGNZ charts.
In the last couple of weeks more than 20 percent of Credit Suisse shares is owned by three shareholders:
Harris Associates (with David Herro as fund manager) owns more than 10 percent of shares ( August 22 , 2016).
The Saudi Arabian Olayan Group , through its registered entity Crescent Holding GmbH, holds more than 5 percent of shares and about 5 percent in convertible bonds ( September 12 , 2016) and is/was represented by someone on the board.
The Capital Group holds more than 5 percent of shares ( August 30 , 2016).
www.credit-suisse.com
www.thecountrycaller.com
www.finews.com
Besides these shareholders there is the state fund of Qatar that owns more than 5 percent of shares and about 13 percent in convertible bonds ( June 17 , 2016) and is represented by someone on the board.
Considering the long and intimate relationship of the Qatar state fund and Credit Suisse it is safe to assume they didn't sell in the past 3 months and this would imply no less than 25% of shares being owned by no more than 4 shareholders in the past month.
Another shareholder worth mentioning is the Norwegian Sovereign Fund (Norges Bank), which claimed beneficial ownership the day after the selling climax on February 11 (owning 5 percent of shares on February 12).
These are the shareholders that were required to file a Schedule 13D with the SEC, due to beneficial ownership. But I bet there are a lot of other institutions buying CS without reaching beneficial ownership.
