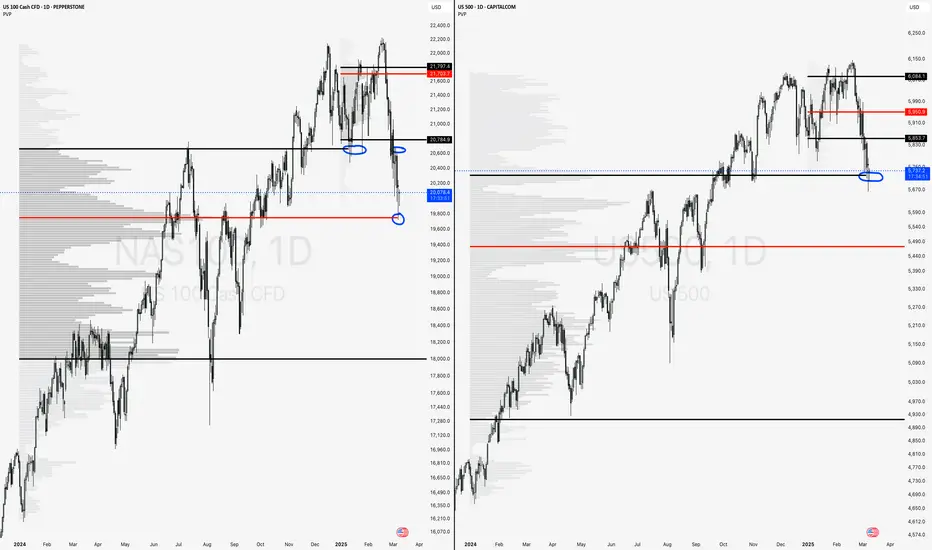
SPY and QQQ at MAJOR LevelsThe charts shown are highlighting the 12 month periodic volume profile chart. Currently, the S&P 500 and Nasdaq 100 are bouncing off major 2024 value areas.
Nasdaq 100:
Last week we can see how bulls lost the 2024 value area high (VAH) and couldn't reclaim. As a result we swiftly moved down to the point of control (POC) where we found buyers show up.
S&P 500:
Coincidently, the S&P 500 moved down to the 2024 VAH where it also found buyers show up.
Moving Forward:
These areas remain very important and should be monitored going forward. If a bounce is to happen here, bulls would like to see the Nasdaq reclaim the 2024 VAH and even work back into the current 2025 VAL.
Volume Profile
Was that it for the rally in US bond prices?Using Volume profile to isolate periods where the market completes a cycle (going from balance to imbalance) , recent price action suggests the end of the correction to the downtrend in bond prices. The spikes lower and higher bookend the period of treading water. Sell rallies above 121.15 looking for sub 120 (stop 122.16)


LOOKS LIKE BULLISH STRONGER as shown on the chart we have very strong resistance levels front for the price
once it can close above them will open the way to retest the above resistance as shown on the chart
once we got weak signal and rejection thats mean we back to support levels below
wish you happy trade

Short CAD CHFHi,
For my daily trades and for swing trades also I'm using historical levels of this pair and trend lines ; volume profile.
Volume profile. VWAP and trend lines are my main weapons to have some perfect trades with 2R+
I always start with the highest time frame and I'm going down up to 15 mins.
In this way, I will have always a clear vision for what matters

TREND SETUP + ACCUMLATION SETUP WE EXPECT NICE REACT TO FOR BOTH OF VOLUME SETUPS
JUST WE PREFER FIRST TOUCH ACTION AND BREAKEVEN STRATEGY
we expect nice react for both of volume profile setups
just we prefer first touch action and breakeven strategy

The ART of the Fade.Tilray is a Cannabis stock, but the importance of this post is the art of fading.
I have numerous posts on Volume profiles and how and why they are very effective, and have kinda made it a mission to show you how great they are!
Here I am showing you how to fade around value, notice the profile, notice how price is trading sideways in this range and building mass of orders, I have used the two blue horizontals to show the outerside of range, and look how price has acted! Absolutely beautiful fades back into Value! honestly so beautiful.
Price attempts to break the outside boundaries before being turned around and heading back into the mass of orders, it is truly beautiful.
The takeaway from this post is the importance of using a volume profile in trading, as the big boys are! step up your game now!

Mountain to Mountain.This example of the CJ daily charts shows you how to trade mountain to mountain style, in other words between orderzones, when price rallies away from these areas of high transactions it flies to new mountain. Low VRVP bars show price will simply fly through it to find the buyers and sellers higher up!

Volume Profile and why you need it.Volume profile is an underused and quintessential part of trading, it tells you build up of orders, it tells you fair price, and it tells you where the majority of the liquidity is.
You can see in this chart, I have taken it apart piece by piece to show you the basic mechanics and why price moves the way it does, now be honest, how many of you rushed into selling GU last minute because the price was collapsing? Well the funny thing is despite not being alone in doing so in the retail trading world, big banks and instituitions were already two steps ahead as expected, check the Volume profile, notice how it declined on a massively falling currency, what this is telling you is that the amount of exchanges is very low, as the shorters pushed price down they began to close positions, also what would have happened is the amount of retail money and money that isnt associated to high end firms would have started to see negative positions so what do they do? they have to close these sells with buys! so not only are the big banks taking profit, they are also using you as rocket fuel! as the masses of small money becomes negative/trapped/stoplosses, price reacts in an equal and opposite reaction, price rallies. So where is price heading too? it is heading back to an area where it can happily trade, and this is shown by larger bars on the VP, price wants to be happy, to be happy it needs to transact alot! So two takeaways... One, dont rush into falling or rising currencies! as they are heading into areas of low volume and will use mean reversion to run you over... Two, Utilise the fact price has low VP build up to your advantage! use price action and catch moves like that GU rally back to an area of more transactions! and a final little trick, use the VP to tell you if your orderblock is real or a figment of your imagination! feel free to drop some questions below, I may have to make more posts on VP for it to make sense. Maybe I will also make some posts on examples of trading using it, and what to do and not to do. Thinking about it, there is more posts to do, I need to show how to trade mean reversion and 'mountain to mountain' tactics. Hope you find this post interesting, as I take a journey of taking back the layers of many traditional strategies, indicators and the deeper world of maths, I am doing this to try help new traders actually get somewhere! So please give me a like and a follow, I want to expand my reach here on tradingview :) All the best ZenFlo.

EURUSD Short 240Short trade on the 4 hour.
Entry based on Volume Profile Resistance.
Sell Stop entry.

TSLA - What happens now?!TSLA had a great earnings on 4/20/22. They beat expectations and bulls rejoiced, sending prices soaring in afterhours.
No one expected the slaughter that would come 4/21/22.
TSLA immediately began crashing and finished the day erasing most of the gains from pre-earnings. IV was crushed, share prices were left in tatters, and everyone started in horror as the retail king dumped 6% with almost no support from the once-thrilled bulls.
What happens now?
Judging by the points of control (POCs) from multiple session volume profiles it would appear as though there is a concentration of both control and value between $985 and $1016 with a low of $962.
If prices can't catch support then the untouched POC at $982 is a logical point to target for anyone playing short or bearish positions.
There is one caveat to all of this...
I sincerely doubt that prices drop freely and easily, allowing all of those puts to print. Games are afoot in this market so be careful and take nothing for granted.
An alternate scenario would be a bounce-up from the current horror show with bulls shaking off the rate hike news and realizing that TSLA is still a powerful company with a potentially bright future. Investors can make the difference here.

$SPY SPY swing 455 CallsSwinging 455 calls here with signs of strength and job #s out, nice VP gap above.
Hedged with shorter strike put, I think we see more upside especially with a strong close .

Quick Position for New York SessionHi guys i made this trade due to the set up im looking for
Indicators used are
Volume Profile, VWAP and some price action

REJECTION SETUP the price has been rejected at these levels cz its over value
so we expect strong rejection downword till reach the buyers levels to defiend there positions
just we need to see the price cross the (BLACK HOLE SUPPORT) than it will become (BLACK HOLE RESISTANCE)
BY THE WAY THIS TERM MADE BY ME JUST FOLLOW MY ANALYSIS YOU WILL GOT THE IDEA
details on the chart
WISH YOU HAPPY TRADING

LYFT Downtrend Range 2HRLFTY has seen a downtrend range since March 21', and keeps making lower lower and lower highs. Chart may look a little messy with the VPA, but here are the notable things about this pattern:
-Both support and resistance have had 2 high touches, with the 2nd touch nearing the resistance (support has had 3 touches)
-The ellipse shows a Head/Shoulder formation, with the neckline confirming a sell on the break, further rolling LYFT down the hill
-VPA suggests that the downtrends overall POC (shown in yellow) and the green POC show a average POC of $54.40-ish
-Red VPA suggests there will be a battle of $50.50, however , most of this volume was realized this last earnings call - nearly 425k to be precise, so 'battle' might be closer to $48.48 (in between red and green POC's)
-Nov. 5th gap. Historically, LYFT has had a decent rate of filling the divots, I expect this to not be different.
-MACD in stagnant divergence over the past few days.
Nevertheless, I believe LYFT will follow the trading bands for the moment, possibly making another touch on the support.

$FSLY Should be on your list this week Fastly (weekly) so far has recaptured 21EMA and right at the volume shelf resistance coming off a triple bottom.
If it breaks higher, good volume pocket above ... Plus keep in mind only 116M shares outstanding so good squeeze potential for a mid cap.
Just look at the run back in June... not saying that will happen again, but with a good ER and the setup, I think this COULD see $68 quick and should be on your watchlist.

$ATVI at supportActivision weekly candle looks like a bullish hammer indicating a reversal in the coming weeks to the upside. The intermediate trend is still up (dashed line) and the option flow was on the bullish side ($2.7M in premiums last week vs $530K on the put side). RSI indicating oversold.
I like the OCT or NOV 85 call as an idea to trade the reversal, or 65P if you're bearish and trade the break below volume pocket.

$JETS Weekly MACD CrossJETS weekly from a technical perspective has bullish momentum with QQE buy signals and MACD curling.
Bullish on the weekly close above 21EMA and in a nice volume gap with room up to 26/27 supply zones.
From an options flow perspective, there was a buyer of the 11/19 21C for $2M in premium. I followed and am currently up +77% and still holding with $26PT
If you're not long, I think an idea would be to swing calls for the move up to $26.

$BTC Key Level HereIn my opinion this is a pretty critical level to see where BTC is heading, as it's acted as critical support and resistance this year.
Bulls need a push back over 21EMA, while bears want to break this support targeting $31K next really demand support.
My bias is to the upside.

EURAUD ANALYSISEURAUD broke uptrend line
price below a key level around 1.6050
price also below SMA 100 and HVN around 1.6070
RSI in downtrend line below 50
MACD shows the start of bearish momentum
so so it expects the bearish movement to demand zone around 1.5800

BROKEN TREND SETUP + VWAP + RETEST POC first we have clear 4H BROKEN TREND so we looking for good retest support levels
second we have strong POC crossing thats why we expect retest for acceptance price as support levels
third we have strong crossing up the VWAP also we expect retest the VWAP center
plus good sign of DIVERGENCE at 4H

GBPCHF | SHORT | Areas of InterestDaily Trend: SELL
LP Sentiment: -23%
Looking for a pull back into the Sell-side imbalance area for a continuation back into the downward trend.
Focus on seeing this setup happen in the London Session.
Don’t forget to follow us on tradingview
Happy Trading
Mr Ionic

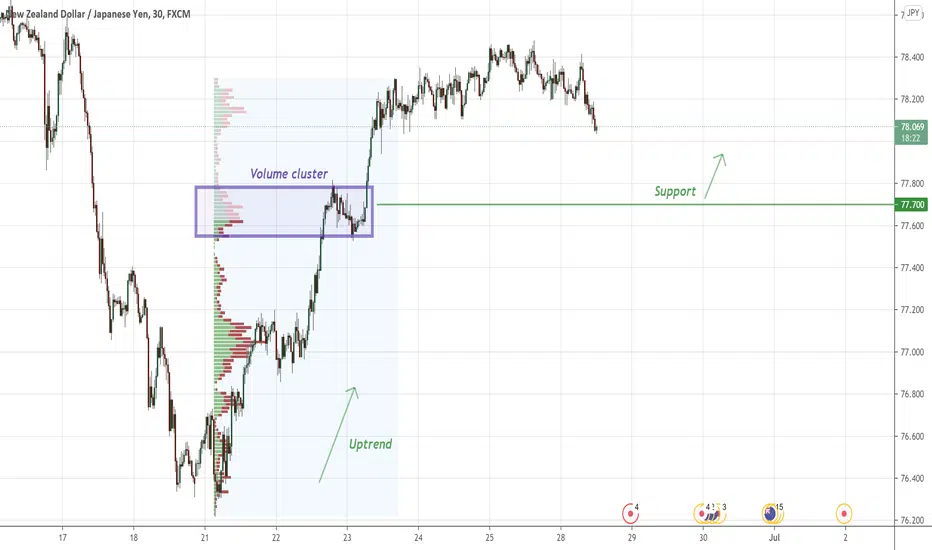
NZD/JPY: Day Trading Analysis With Volume Profile 📊 On NZD/JPY is nice to see strong buying reaction from the price 77.7 , there is nice to see strong volume areas....
Where is lot of contract accumulated...
I thing that buyers from this area will be defend this long position...
and when the price come back to this area, strong buyers will be push up the market again...
Uptrend +Strong buying activity + Strong volume area is my mainly reason for this long trade....
Happy trading
Dale