Volume Profile
Bounce around some then up again (5/27/2019)I analyze the price of COINBASE:BTCUSD to do something similar as seen on chart.
They want the price higher and will most likely do some weird "liquidating" type moves in both directions before moving to the next price range higher.
Volume is the biggest indicator in crypto, in my opinion, and the hardest to predict as to when it will come. Setting volume alerts are one way of sort of knowing. Or just being present when it does come(but who wants to live like that?). It is also worth noting that in cryptos we get to see ALL of the volume information unlike say Forex( FX:USDCAD or FX:GBPJPY ) and/or OANDA:XAUUSD
Any thoughts? Let me know. I love to learn
Potential ~250 pip SHORT on EURJPY - Magic Fibo?I've had a lot of success trading these 'magic fibo' numbers.
IF the price comes up to test the 61.8% retracement (~129.895) of recent down move, test it, fails to break through, reverses, we have a pretty, pretty good look here to make a high probability swing trade down.
We are looking to IDEALLY take profit at ~127.337.. I felt that volume profile was showing me some pretty good support around that area, so I drew a pretty large 'take profit' box. I'll be looking to take profit anywhere in that area.
250 Pips if it works!
I'll update with more info if I find any.
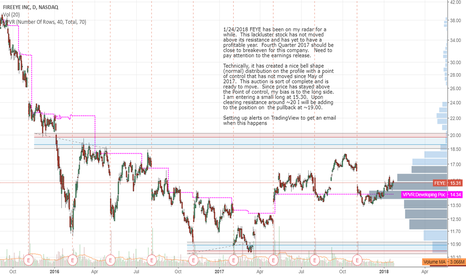
Long FEYE1/24/2018 FEYE has been on my radar for a while. This lackluster stock has not moved above its resistance and has yet to have a profitable year. Fourth Quarter 2017 should be close to breakeven for this company. Need to pay attention to the earnings release.
Technically, it has created a nice bell shape (normal) distribution on the profile with a point of control that has not moved since May of 2017. This auction is sort of complete and is ready to move. Since price has stayed above the Point of control, my bias is to the long side. I am entering a small long at 15.30. Upon clearing resistance around ~20 I will be adding to the position on the pullback at ~19.00.
Setting up alerts on TradingView to get an email when this happens
Gold Rallies at End of Day. Will it Continue?Gold fell to a new 2 week low during Wednesday's trading. That is, until the end of the day when the administration's tax plan was released and Gold rallied higher to close the trading session. However, Gold met resistance at the 21 day moving average and if you look at the Heikin-Ashi chart below, today's trading ended in a strong red Heikin-Ashi candle. That begs the question of whether or not the spike was an anomaly or not. The haDelta indicator is still red. I am still bearish and holding onto my short positions.
As I mentioned last night, there is a strong trading range from 1245 - 1265. I've now outlined that area with a green rectangle. I've also added 2 volume profiles to the chart (you can see them in their entirety on the very bottom chart). The long term Volume Profile dates from the beginning of 2016 to today. What's interesting is that the Point of Control is smack in the middle of that trading range. And that also coincides with the 23% fib retracement of the current year's rally.
The Point of Control on the short term Volume Profile is nearly at the same level as the 38% retracement. If price does drop in the coming days, these would be the areas of interest.
If you've enjoyed this post, please click the Like button, share with your friends and re-tweet!
Disclaimer: This post is for educational purposes only. Trading is at your own risk.
Long - mt - 52 week pop watching mt which has been trading around its 52 week high. We had a breakout of the high recently which since pulled back and consolidated some. I like the volumes here showing some volatility with higher than usual volumes particularly on the swing low.
I think this one could pop with sector also outperforming if we come back up will look to place a buy stop just above $8.50 probably target around $10
Long EXPR3/3 EXPR has rejected the High Value are between 10.25 and 10.75. Due to the recent consolidation I am expecting a move higher with target at 12.50 just before the Low Volume Node and the 200 Daily Moving Average.
Long EXPR


