Pushing Hard To RisePrice has been butting up against the 1.1585 level for days. I believe a large breakout is brewing.
Weekly point of control and the dailies are all in a similar area. Still that huge fair value gap from last week below, but I believe this will stay for now.
I believe the highs at 1.1800 will be tested again and possibly broken. There seems to be little faith in the USD at the moment.
Volumeprofileanalysis

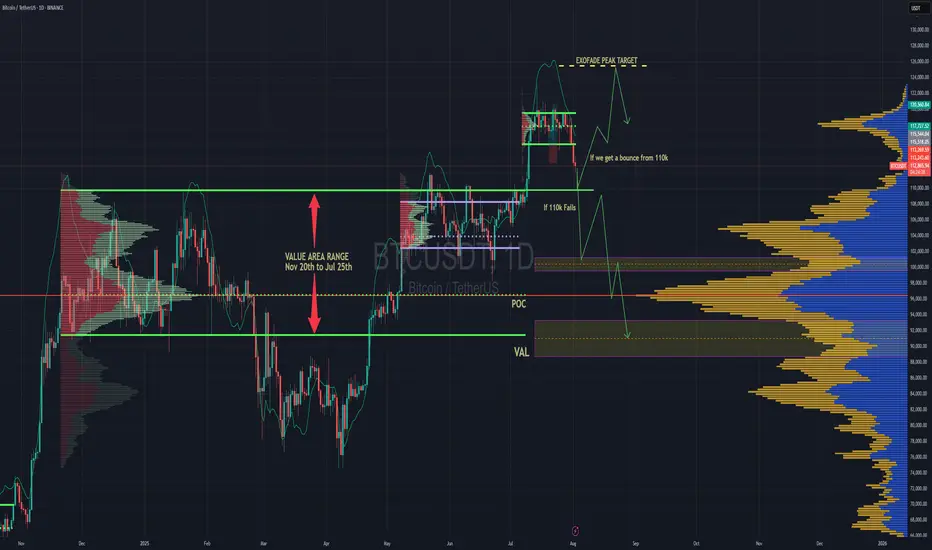
BTC Forecast For August & September. The Only Roadmap You Need !This is one is so obvious, its a no brainer , and would likely be very easy to trade as long as you follow this road map i have provided.
The Value Area High at 110k price range is most important upcoming battle line between bull vs bear. If bulls fail to get a strong bounce from 110k and we close at least 2 daily candles below it. Then it would mean bears have full control and the implication of that is that since we would at that point be closing back inside an established Value Area range, formed between Nov 20th to Jul 25th, then it would mean the probability of price selling all the way down to re-test the VAL (value area low) at $91.6k would instantly become very very high.
After re-testing $91.6k we'll watch and see what happens.
It'll either hold after grabbing some liquidity below and stay in the Value Area Range until further notice Or we lose it and the sell off continues. Bear market will be in full swing if that happens and you can bet a ton of weak hands will start to exit due to max pain & cascading long liquidations. Fear index will be back in the red at that point as capitulation starts to set in. Alot of new alts and meme coins will be completely obliterated.
Bullish Continuation Scenario
If bulls get a strong bounce from 110k and don't close back inside the Value Area Range below, then we could continue up to a make a new ATH for a classic trend pullback continuation trade. Once we get back above 115.4k, the dream of a new ATH will become much more realistic. There is an UFA(Unfinished Auction) at 120.8k which is only visible to traders using the market profile or footprint chart. This make poor high and needs to be taking out at some point.
For the Price target to the upside, we would be using the peak formation line of the ExoFade indicator.
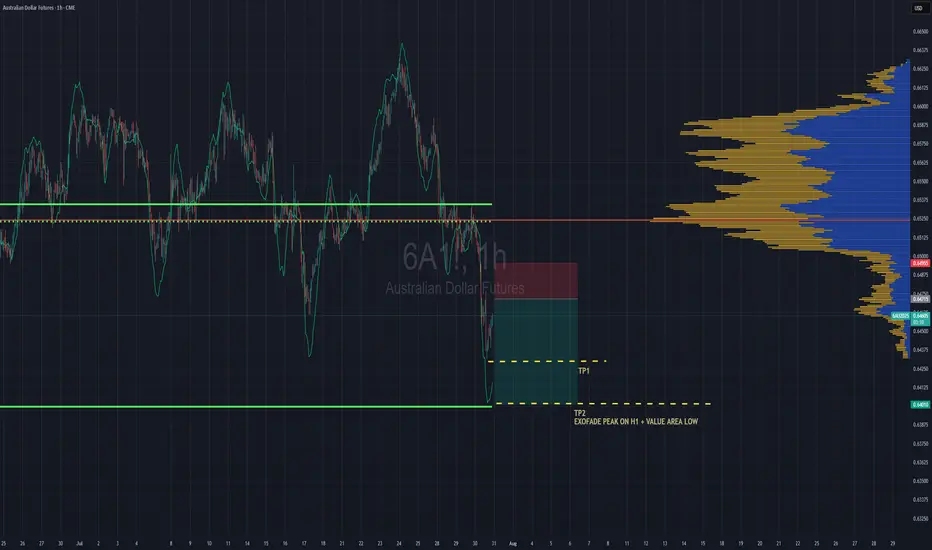
Aussie Shorts Looks Promising This is a pullback trend trade anticipating trend continuation. Entry is based on LVN (low volume node) for entry. Also looking on the footprint chart there is a high volume node with -ve delta that was traded at 0.64715.
If the sellers return to defend that price then this pullback should give some strong rejection once we pierce the entry zone and send bulls packing.
TP1 - First swing low
TP2 - Value area low of the range, which also is in confluence with the ExoFade peak on the 1HR timeframe. ExoFade peaks always gets taken out in a strong trend, that's why i love using them as price targets for exits. ExoFade is free on Tradingview for those curious about it. Just search for it.
GBP/USD Professional Analysis – “Trap Trigger at Support”GBP/USD Professional Analysis – “Trap Trigger at Support”
📈 Market Overview:
• Pair: GBP/USD
• Timeframe: Likely 1H or 2H based on candle spacing
• Date: July 28, 2025
• Current Price: 1.33529
⸻
🔍 Technical Breakdown
🔴 Resistance Zone: 1.35800 – 1.36200
• Strong supply area where the last bullish impulse failed.
• Price got rejected hard, initiating a new downtrend.
• Sell-side pressure was confirmed with Supertrend turning red.
🟤 Support Zone: 1.32860 – 1.33400
• Major demand area where price previously reversed sharply.
• Currently being tested again after a clean sweep into the Trap Trigger zone.
⚠ Trap Trigger Zone (Liquidity Sweep Area):
• Price wicked just below support, tapping into a low-volume/high-liquidity area.
• This wick likely cleared sell-side liquidity and trapped breakout sellers.
• Followed by a bullish rejection wick, implying smart money accumulation.
⸻
🛠 Indicators & Tools:
• Supertrend (10,3): Currently red, indicating short-term bearish momentum.
• However, if price closes above 1.34032 (Supertrend level), it could flip bullish.
• Volume Profile (VRVP):
• Low-volume node under support suggests a quick “stop hunt” move, not genuine selling.
• High-volume acceptance area sits higher, near 1.34500–1.35000.
⸻
🎯 Forecast:
🔴 Bearish Invalidations:
• Price closing below 1.32860 with volume would invalidate this setup.
• That could signal continuation to deeper liquidity (1.32500 or below).
⸻
🧠 Smart Money Perspective:
• Liquidity engineered beneath support
• Trap Trigger activated — ideal for institutional reversal setups
• This is a classic “Stop Hunt → Reclaim → Expand” model

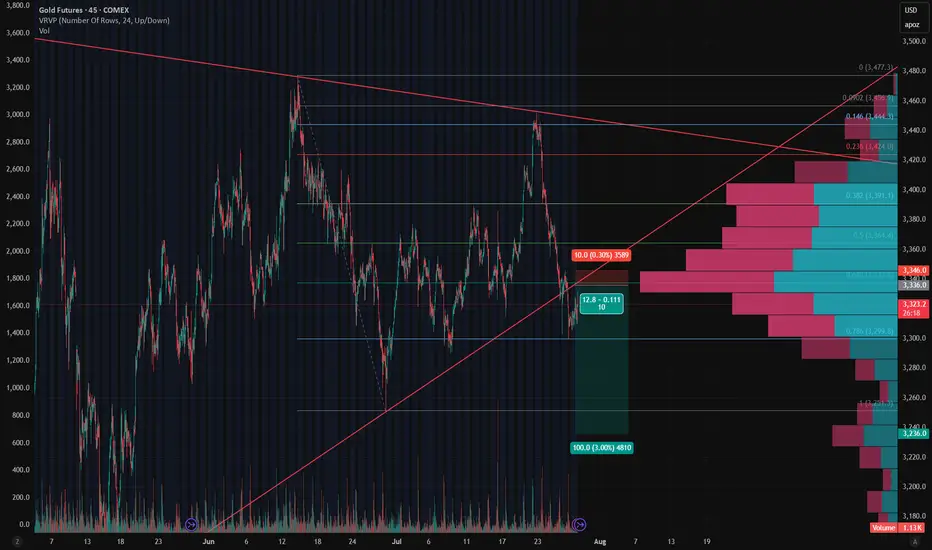
Gold - Short Setup Off Major Trendline Rejection📉 Gold - Short Setup Off Major Trendline Rejection
Gold has broken down through the rising trendline and is now retesting it — the moment of truth! 🧐
🔻 Short Entry: 3,336
🎯 Target: 3,236 (Fib 1.0 + HVN gap fill)
🛑 Stop: 3,346 (Above trendline retest)
⚖️ Risk/Reward: ~1:10
📊 Bonus: High volume node above adds resistance. Bearish volume profile structure confirms the breakdown bias.
Watching for volume to pick up on the move down. Let's see if GC bleeds into August. 🩸📆
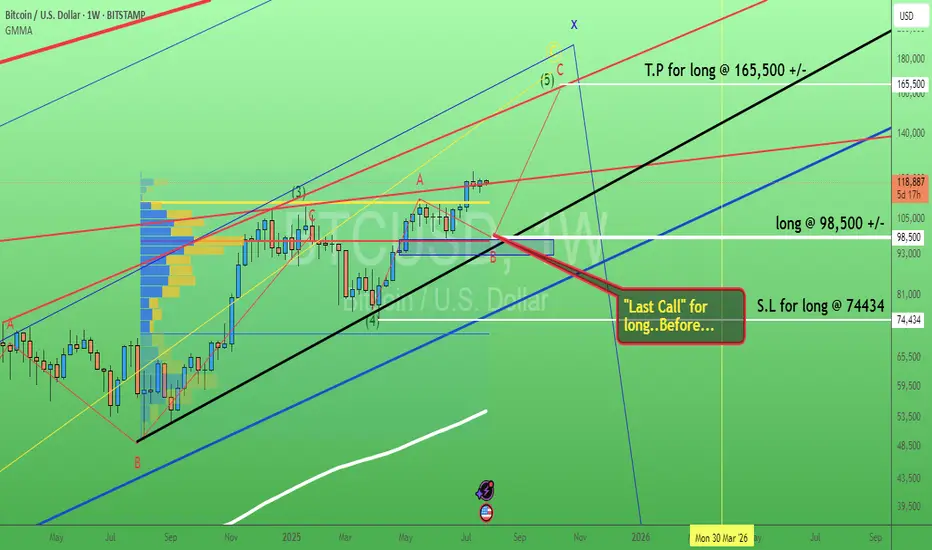
Bitcoin. Last call buy level? 29/July/25BTCUSD probably will have pullback toward confluence zone of 1) Trendline Support 2) Order Block 3) POC of volume before hitting ATH again
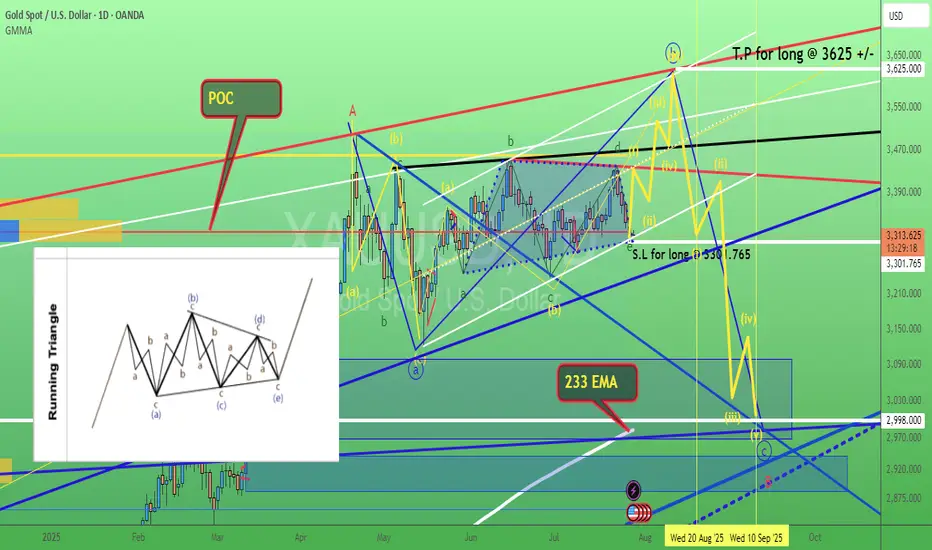
Gold. wave e (green) of triangle possible reached. 29/July/25XAUUSD based on speed of chart + confluence zone 1) Channel Support 2) POC of volume profile 3) Trendline support. Gold probably completed its wave e (green) of triangle.
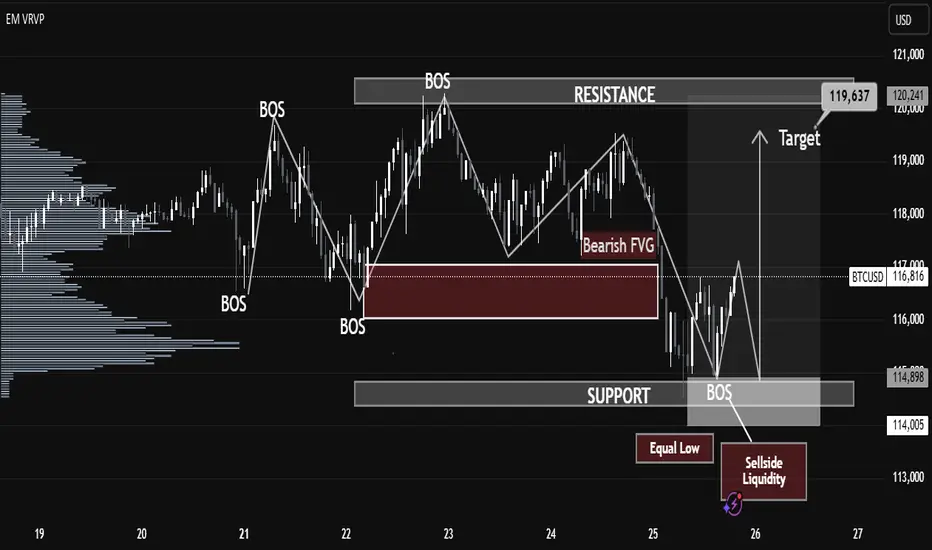
BTC Breaks Structure After Liquidity Grab! Massive Move Loading…BTC/USD Technical Analysis – July 25, 2025
Structure Overview:
The current BTC/USD price action showcases a classic market structure shift, with multiple Breaks of Structure (BOS), liquidity grabs, and a clear intent to revisit premium pricing zones. The chart follows a Smart Money Concepts (SMC) methodology, identifying key supply and demand areas.
Key Highlights:
🔹 Break of Structure (BOS):
Several BOS events indicate momentum shifts and short-term trend reversals. The most recent BOS near the support zone suggests a potential bullish move after liquidity sweep.
🔹 Sell-Side Liquidity & Equal Lows:
BTC swept the Equal Low level near $114,000, triggering Sell-side Liquidity. This liquidity grab is often a manipulative move by institutional players to collect orders before driving price higher.
🔹 Support Zone:
The support zone near $114,900–$114,000 is holding strong. Price wicked into this area, collected liquidity, and reacted with bullish intent.
🔹 Bearish Fair Value Gap (FVG):
A Bearish FVG exists around $117,500–$118,000, which may act as short-term resistance. Price could partially fill this gap before resuming direction.
🔹 Target Zone:
Projected target lies at $119,637, aligning with the prior resistance zone and offering a high-probability area for price delivery based on the current bullish market structure.
🔹 Volume Profile Support:
The volume profile suggests high volume accumulation in the current range, further supporting the possibility of a bullish expansion phase.
Forecast Summary:
Bias: Bullish (Short-term)
Entry Zone: Confirmed after BOS and liquidity sweep near support
Target: $119,637 (resistance zone)
Invalidation Level: Sustained break below $114,000
⚠️ Risk Note:
A rejection from the Bearish FVG or failure to break above $117,800 may cause a deeper pullback. Monitor reactions around key levels before continuation.
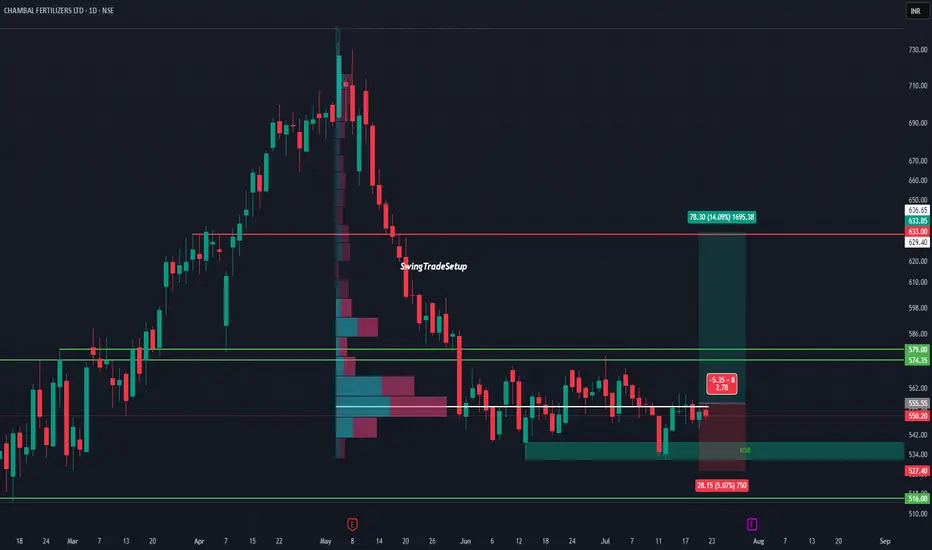
CHAMBAL FERTILISERS LTD – Potential Bottoming Out‽CHAMBAL at Demand Zone | Volumes story
After a steep fall from 730 to 516, Chambal is now consolidating in a critical demand zone backed by visible volume activity. This range has previously triggered price reversals, and now history might repeat.
The stock is respecting the support between 527–516, forming a potential base. On the upside, a clean breakout above ₹555.55 can unlock a near-term target of 633+, a move of over 14%.
The risk-to-reward ratio remains attractive with a tight invalidation below ₹527, while the volume profile suggests accumulation in this range.
Technical View :
• Major support: ₹516–527
• Breakout trigger: ₹555.55
• Upside target: ₹633–636
• Risk below: ₹527
• Volume profile: Dense node suggests buyer interest
Valuation :
• PE: ~10.3 (undervalued vs peers)
• Dividend Yield: ~6.5% (steady income potential)
• Promoter Holding: 60.62% (strong & stable)
• No recent equity dilution
• DII/FII: Activity neutral, could turn if technical align
A good mix of fundamentals, attractive valuation, and technical structure makes this a stock to keep an eye on. If it crosses ₹560 with volume, it may kick off a short-term trend reversal.
This chart is for educational use only and not a buy/sell recommendation.
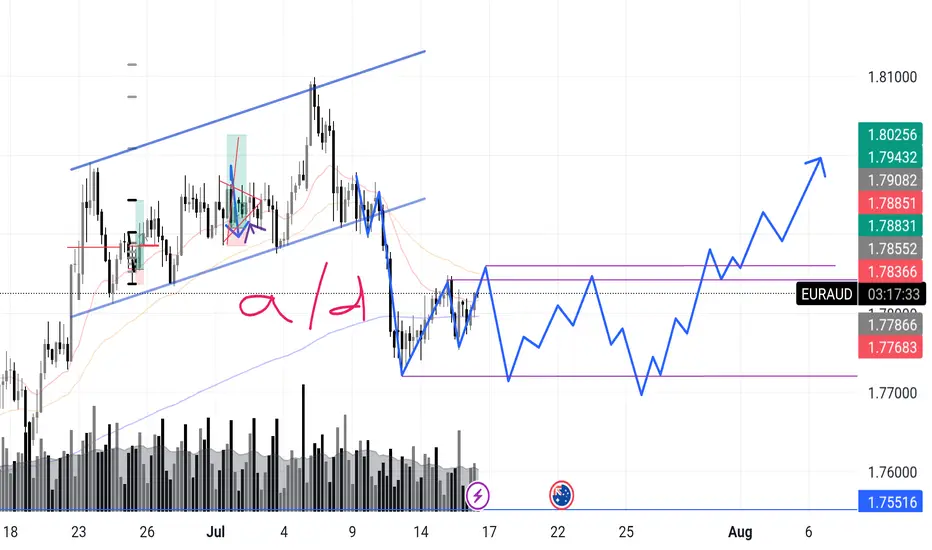
EURAUD – Incoming Upthrust? Accumulation or Distribution? Chart Context:
EURAUD recently completed a sharp markdown after a textbook rising channel break. What’s interesting now is that price has entered what looks like a potential box range between 1.7768 and 1.7885.
I'm anticipating a possible upthrust move into the 1.788x zone — and what follows will reveal the true intent.
Here’s the internal debate:
Are we looking at reaccumulation — smart money trapping shorts before driving higher in line with broader money flow?
Or is this a distribution — where the market builds a false sense of support before deeper downside?
🔍 What tips the scale for now is this:
>The overall money flow direction (via volume patterns + structure) has leaned bullish, so I’m favoring accumulation with a shakeout scenario.
Signs I’m watching:
✅ Absorption volume near the bottom of the range
✅ Higher lows inside the zone
✅ Fake breakout / upthrust into prior structure
❌ Failure to hold above 1.7855 could flip the bias short-term
📉 Expecting one more dip to test demand, followed by range tightening, and if buyers show up strong — the breakout can get explosive.
What’s your take?
Are we prepping for a markup or will this fakeout and roll over?
"I go long or short as close as I can to the danger point, and if the danger becomes real, I close out and take a small loss"
CL1! Short Setup – Fading Into Volume Shelf📉 CL1! Short Setup – Fading Into Volume Shelf
🔹 Context:
Price just tapped into a heavy upper volume shelf (68.35–68.50) — the exact area where the prior breakdown started. This zone aligns with rejection highs and the upper edge of the VRVP profile.
📌 Setup Logic:
🔺 Entry: 68.36–68.50 (into supply zone)
⛔ Stop: 68.75 (above liquidity peak)
🎯 Target: 66.78 (prior demand + volume node)
📐 RRR: ~4.0:1
⚠️ Trigger: Do not enter early — wait for rollover of price which it looks like we are getting now.
📊 Why It Matters:
📈 VRVP shows clear upper and lower volume shelves
📛 Price has overextended into a prior rejection zone
🔁 Potential for a mean-reversion leg once we confirm momentum breakdown
📷 See attached chart for full zone layout
🧠 Let me know if you’re entering or watching this one 👇
#CrudeOil #CL1 #FuturesTrading #VolumeProfile #SciQua #OrderFlow

XAUUSD 4H – Full Technical & Fundamental Deep Dive🔷 Chart Structure & Trendlines
Since early June, gold has formed a clean descending channel on the 4‑hour chart. Each bounce and rejection has respected these channel edges, which reflect consistent lower highs and lower lows.
A long-term ascending trendline (from late March lows) was recently broken. This broken support has now flipped into resistance, and price is currently retesting it.
The intersection of the descending channel’s top, the trendline resistance, and the 200 EMA creates a major triple-confluence zone—a classic area of institutional interest.
🔷200 EMA
The 200 EMA on the 4H chart is acting as dynamic overhead resistance, which price is currently testing.
Historically, during bearish regime, retests of the 200 EMA from below often trigger strong rejections.
If price breaks above and holds, it would mark a significant shift in market sentiment. If rejected, it adds weight to the bearish trend.
🔷Fair Value Gap (FVG) & Supply Order Blocks
A Fair Value Gap (vicinity of $3,340–3,350) remains structurally unfilled from the previous breakdown.
Price is now re-entering that FVG region—an area often used by smart money to target liquidity and trap retail traders.
This is a logical zone for sell orders, as price frequently reacts where gaps exist.
🔷Volume Profile: High/Low Volume Nodes
A High-Volume Node (HVN) sits around $3,360, where most sustained trading has occurred. This acts as a strong resistance/distribution area.
The current zone ($3,330–3,340) is a low-volume pocket, meaning moves through here can be fast, but rejections are still frequently seen.
Below, there's another HVN around $3,280–3,290—a logical demand area and intermediate target for retracement.
🔷Fundamental Perspective – This Week to Friday
🔸 U.S. Fed Outlook & Dollar Dynamics
U.S. dollar is weak, with growing speculation on imminent Fed rate cuts, partly due to pressure from political sources
Fed remains cautious—no July cut likely, more probable in September
Persistent volatility in Fed messaging means gold remains in play as a hedge.
🔸 Geopolitical & Macro Drivers
Geopolitical tensions (Middle East, trade) continue to add safe-haven support
Central banks, especially Australia, are upping gold purchases—may add structural support
🔸 Market Sentiment & Investment Flows
ETF inflows remain robust—global central bank demand offsetting retail weakness
Some macro research houses expect sideways action into early July, with range likely between $3,200–3,350
🔸 Risks Ahead of Friday
Watch for U.S. jobs data, Fed speakers, and geopolitical headlines—any surprise could spark sharp moves.
If Fed hints at delays in rate cuts or geopolitical risk cools, gold could see a rapid reactive drop.
🔷🤔 Possible Scenarios into Friday
✅ Bearish Rejection
Price fails to clear $3,340–$3,360 zone.
A strong rejection candle retests $3,280–$3,290.
Could accelerate down to $3,240 if momentum picks up.
⚠️ Bullish Breakout
Clean, high-volume break above 200 EMA and $3,360 HVN.
Likely continuation to $3,380–3,400, especially if supported by fundamentals (e.g., inflation, Fed dovish pivot).
🔷My Personal Bias into Friday
Slight bearish lean due to triple resistance confluence.
Fundamentals are mixed: Fed caution supports gold structurally but no immediate catalyst.
I will monitor price action closely: a sharp rejection off the 200 EMA area would confirm suspicion; but a clean breakout would require reassessment.

HNST: When honesty turns into a breakout formationOn the weekly chart, The Honest Company (HNST) is shaping a textbook broadening formation. Four waves are already in place, and the fifth is unfolding. The recent bounce came exactly after a retest of the long-term trendline at point (4), pushing the price above the critical $4.97 resistance (0.236 Fibo) — a clear signal that buyers are reclaiming control.
Volume is steadily rising, and the golden cross (MA50 crossing above MA200) further confirms a mid-term trend shift. The volume profile above current prices is nearly empty — indicating minimal resistance. Immediate targets are $6.33 and $6.94 (0.5 and 0.618 Fibo), while the full breakout projection lands at $8.91, $10.31, and even $12.09 (based on 1.0, 1.272, and 1.618 expansions).
Fundamentals (as of June 28, 2025):
— Market Cap: ~$460M
— Revenue (TTM): ~$344M
— YoY Revenue Growth: +7.6%
— EPS: –0.18 (loss narrowing)
— Cash on hand: ~$24M
— Debt: under $10M
— P/S ratio: 1.34
Despite being unprofitable, HNST is showing strong signs of operational improvement — rising gross margins, controlled costs, and increasing leverage. Growth in both online and retail sales adds further support. With institutional buying picking up, the market may be slowly re-rating this small-cap FMCG player.
Trade Plan:
— Entry: by market
— Targets: $6.33 → $8.91 → up to $12.09
When even an "honest" stock starts drawing broadening patterns and volume’s rising — it’s not a hint, it’s a launch sequence. And the bears? Might want to take a seat in the back.

Long & Short Entry Forecast For GoldCooling war tensions seem to be cooling the Gold bullish rally as well.
But we're still in the same range since April 15th and will likely stay in the range until further notice *or the next tweet*
The Sell entry is great now cos we're near the top of the high volume node, so even if we consolidate around that POC this sell entry will still be putting us closest to the top of the node.
Hold your sell and TP at the VAL . We have a very deep low volume area there and its being a point of support since April. So we can place bets with small risk on hoping it holds cos if it doesn't, it wont be pretty. That is still the best place to buy regardless. So manage your risk accordingly
TP 1 for the Buy trade is at the POC , which also happens to be the top of the huge volume node. Totally make sense to take a decent chunk of profit of your position there, then move you stop loss into profit and grab some pop corn. Depending on the news , the best case scenario of for the uptrend is to continue all the way up to TP2 which is at the VAH
Secure the bag :)
Enjoy

$BANANOUSDT New ATH possible, nay, plausible??
An extreme local inverse head and shoulders formation can be observed in the area circled in white.
trading just under local VWAP, great entry for anyone lacking potassium.
HL double bottom observable on the daily chart.
if recent trends continue to develop, a strong surge past $0.00162477 could lead to a increase in momentum.
$0.00210914 would be the next resistance, although weaker than the one currently testing. if price continues to develop past $0.00236478, ill be looking for TP1 at $0.00274825, another rough patch through til $0.00339408 follows, about 50% thru that zone would be a good TP2 and 100% thru the zone would be my TP3. the last major resistance would be at $0.00385154 (TP4). after that, a new ATH for COINEX:BANANOUSDT becomes an increasing plausibility. i am long potassium at $0.00143801
ANYONE HAVE MUSCLE CRAMPS?


Profit Target/Reverse on EUR/USDOld volume accumulation from April about to be approached at 11463 area. This area should be a natural resistance and a good take profit on buy trades.

BTCUSDT 4H – Key Support Test | Bounce or Breakdown?
Bitcoin has been in a clean uptrend for the past few weeks, making consistent higher highs and higher lows. Recently, we’ve seen a pullback that’s now testing a major confluence zone, which makes me lean bullish in the short term.
Here’s what I’m looking at:
1. 200 EMA (4H)
Price is currently testing the 200 EMA, which has acted as dynamic support throughout this uptrend. This is often a key level where bulls step back in after a healthy correction.
2. High Volume Node (102.5K–103.5K)
This area lines up with a visible HVN on the volume profile, suggesting strong previous acceptance and institutional interest. Holding this area implies a potential base for the next leg higher.
3. Retest of Ascending Trendline (Broken)
We’ve broken the minor ascending trendline, but price is now testing horizontal demand + EMA, which could act as the real support. This isn’t invalidating the uptrend structure yet — just a deeper pullback.
4. Demand Zone + Volume Spike (Recent)
The previous demand zone is still valid, and we saw a decent spike in sell volume into support — which could indicate a liquidity sweep or stop hunt, setting up for a reversal.
Trade Setup
📈 Long Setup: Bounce from Confluence Zone
Entry Zone: $102,300 – $103,300
Stop Loss: $101,400 (below HVN + 200 EMA)
Target 1: $106,000
Risk/Reward: ~1:2.5
This setup banks on BTC holding the 200 EMA and key HVN, continuing its overall bullish structure. A clean 4H bullish engulfing or a strong close above $104K would add even more confirmation.
Invalidation Criteria
If BTC closes a full 4H candle below $101,500 with no immediate buyback, I’ll consider the setup invalid and step aside — the next major HVN is around $96K, and I’ll look to long there instead.
BTC is pulling into a beautiful confluence of structure, volume, and dynamic support.
Short-term bearish pressure looks more like a corrective move within a bullish trend.
I’m looking to scale into longs if this zone holds. Tight invalidation and clean structure — great R/R.
Bullish Argument
First real test of 200 EMA since early April — trending markets often bounce here
Consolidation on top of prior demand — this could be a liquidity sweep / fakeout
High-volume support just below price = buyers likely interested here
We still haven't broken any key swing lows, so higher timeframe structure is intact
Bearish Risks to Watch
Trendline break and sustained lower highs = momentum shift
Lack of immediate bounce = could mean support is weakening
Break and close below $101.5K likely opens the door to $96K–$97K next HVN

EUR/USD Price Retrace and Reaction to RejectionQuite a significant rejection of price at around the 11256 level. Didn't think much of it at first, however there is a surprisingly large volume node at 11268.7. This has been resistance in the recent past.

XAUUSD LONG AND SHORT Hi Guys,
Weekly VP prints out some important levels, which I have marked on the chart. Each of those levels acts as a support level therefore buyers showing up is expected. Break below 294 and confirmation would result in price further dropping to 272.
Also 316 and levels above it have been marked as resistance and seller showing up is expected.
Make sure add your own logic into this before taking any position.
Be honorable

Price Retreat to Close Opening GapPrice on the EUR/USD gapped up on the week opening and accelerated upwards unencumbered after a long morning consolidation period. I expect to see a pull back towards the daily point of control towards the existing gap.

Two target/Take Profit Levels on EUR/USDDaily EURUSD still below the 10EMA, so I am bearish. Levels as you can see at the below dashed ray lines (1.11464 and 1.11156) looking to take profit on the short at these points and reverse into a buy for a quick day trade/scalp.
First level reached has confluence as a previous resistance and a fair value gap (still not convinced on the validity of these).
Lower level has also been a previous resistance creating a weak high on 3rd April. 2025.

Master HBAR with Fibonacci: The Golden Pocket BlueprintSince topping out at $0.20151, HBAR has spent the last nine days in a corrective pullback. Digging into a rich confluence of supports that offers a long trade setup. Here’s how to spot the high‑probability entries, manage your risk, and scale out for maximum reward.
Current Context
Two days ago, price was firmly rejected at the weekly open ($0.19029) right alongside the anchored VWAP drawn from the $0.28781 swing high.
HBAR now trades below the monthly open ($0.18210), the weekly open ($0.19029), and the daily open ($0.18024), sitting at about $0.177.
Just beneath today’s level lies the swing low at $0.17543. Breaching this could flush out stops before any meaningful bounce.
The Golden Support Zone
All signals converge between $0.170 and $0.1725:
The anchored VWAP from the $0.12488 low sits at around $0.17.
The 0.618 fib retracement of the $0.15396→$0.20239 move falls at $0.17246. Just under the swing low where the liquidity lies.
The secondary 0.666 fib retracement lands at $0.17014, reinforcing that floor.
Volume‑profile analysis of the past 27 days pins its Point of Control right at $0.17, great confluence with the anchored VWAP.
This “golden pocket” is your pivot for a low‑risk, high‑probability long.
Long Trade Setup
Ladder buy orders between the swing low ($0.17543) and the 0.666 fib at $0.17014.
Aim to average in around $0.1725.
Place a single stop‑loss just below $0.17
Scaling Your Exits
First Partial Exit at the monthly open ($0.18210). This offers roughly a 2:1 R:R.
Second Exit Zone around the weekly open and VWAP resistance (~$0.19) for about a 3:1 R:R.
Final Target at the 0.618 fib retracement of the entire down‑wave (from $0.28781 to $0.12488) near $0.2256. An astounding 10:1 payoff for the patient trader.
Keep in mind a potential false‑break (SFP) at $0.17543: if price briefly dips below then snaps back up, with increased volume.
Short Trade Setup
For traders looking to play the downside from the “golden pocket” flip, here’s a clear short strategy:
Entry Zone: Ladder short entries between the 0.618 fib at $0.22557 and the 0.666 fib at $0.23339.
Confluence: The 0.666 level aligns perfectly with the negative 0.618 fib from the prior swing, creating a resistance zone.
Stop‑Loss: Place your stop just above $0.23339, invalidating the confluence.
Take‑Profit: Target a return to around $0.206, where you can lock in gains as HBAR retests its previous high.
By scaling into shorts across that fib band, you balance your risk and capture the high‑odds reversal offered by stacked Fibonacci confluence. Let the golden pocket guide both your longs and shorts!
Key Takeaways
Confluence is king: VWAPs, Fibonacci retracements, Liquidity and volume‑profile all align in the $0.170–$0.175 zone.
Risk control: One stop‑loss under $0.17 protects the entire laddered entry.
Tiered targets: Small wins at $0.182, larger as you clear $0.19, and a big payoff if HBAR rallies toward $0.225. Trail your SL accordingly.
Patience pays: Wait for price to enter the golden pocket, avoid chasing!
With these confluences lining up and clear levels to work from, HBAR’s next high‑probability long setup is staring you in the face. Trade smart, size appropriately, and let the market reward your discipline.
Happy Trading!
___________________________________
If you found this helpful, leave a like and comment below! Got requests for the next technical analysis? Let me know.
