AUDUSDThe tight space between important levels of Aussie makes it so hard for me to open medium-term trades.
I suggest if you are not into short-term trading avoid decision making before breaking of the two levels.
After breaking the stronger levels I'll expect an almost sharp move.
The United States CPI announcement could be a fuel to a level-breaker market move.
Volumeprofileanalysis

UAL United Airlines Pre Earnings LONGUAL has been in a persistent trend up for a couple of months after great earnings were reported
in early May with another due on July 19th. The airports have been quite busy with vacation
travel and UAL has been part of that action. On the 1H chart, price has been supported by
the mean VWAP and has oscillated to the one standard deviation line above that. I see a target
as 56.80 where the the second deviation lines above the mean aVWAP while placing a stop loss
just under the blue line of one STD above VWAP. The price is below the POC line of the volume
profile which should act as a magnet pulling the price higher. The MACD indicator shows 4
the lines in parallel and above the zero horizontal line with a positive histogram. The relative
volatility indicator shows sufficient volatility to support momentum trading.
I will take a long trade going into earnings. I will do this with ten call options contracts
with a strike at $57 expiring on July 21st. On the last trading day, this contract had
a low of $ 0.95 and a high of $1.32 for a range of 35% in a single day. I expect similar
price action as the earnings date approaches. I expect to pay about $1320 for ten contracts
and the profit expectation is 100% over the next 10 trading days.

Can USD/JPY rally through this 300-pip liquidity gap?Divergent monetary policies between the Fed and BOJ have allowed USD/JPY to extend its bullish trend on the daily chart. Whilst the Fed are very close to their terminal rate, they have to keep the threat of further hikes on the table to tame inflation expectations. When coupled with the ultra-easy policies of the BOJ, we've seen USD/JPY return to its cycle highs.
However, the current resistance level around the November high marks the lows of a ~300-pip liquidity gap - and such areas can see prices move swiftly through them if revisited.
Soft US inflation data last November sent USD/JPY aggressively lower on the day, and left the liquidity gap to potentially be filled. The question now is whether bulls can persist and send prices within it, which could see USD/JPY head for the range highs around 145.
Of course, a building threat for bulls to keep in the back of their mind is that Japan's Ministry of Finance or the BOJ could become vocal about yen volatility to spook JPY bears. But until then, we prefer to buy dips on the daily chart or seek bullish continuation patterns on lower timeframes.

GBPUSD : The most likely scenariosI can imagine three different scenarios for GBPUSD.
Set different TP points and entering condition in order to reach best money management possible.

NQ Futures Hitting June 22nd LevelsCME_MINI:NQU2023
With the help of USA news release during NY session, price action reached the upper highly traded levels of June 22nd
Trade Well
Trade Smart

UNG continues to rise UNG the ETF that tracks natural gas futures has continued on a significant uptrend since June
1st The 2H chart suggests to be that the trend will continue this upcoming week. UNG is now
above the POC line of the long multi-session volume profile. UNG has had support from the
VWAP line representing two standard deviations below the mean. In recent days, price has
crossed that mean VWAP in a sign of bullish momentum. The volatility oscillator indicator
is showing bullish volatility while the RSI is high above 80 and staying there without any fade
to suggest bearish divergence. Overall, I will continue to run my position without any partial
take profit. My target is the VWAP line that is two standard deviations above the mean
anchored VWAP and so presently about 7.85. Any new trade would have the same target
while setting the stop loss just below the POC line.

Is UADUSD turning down?UADUSD rose over 6% since the end of May. Can it go higher? Analysis on the 2H chart suggests
that it cannot. It is presently deep in the resistance/demand zone as delineated by the
luxalgo indicator. A long mult-session volume profile shows the high volume area fairly s
symmetrical about a POC line which roughly corresponds to a 50% Fibonacci retracement of
the uptrend which occurred from May 31st to June 16th. On the MACD the lines have crossed
and are trending down. I can easily conclude that the pair is likely to retrace. I will take a
short selling forex trade.

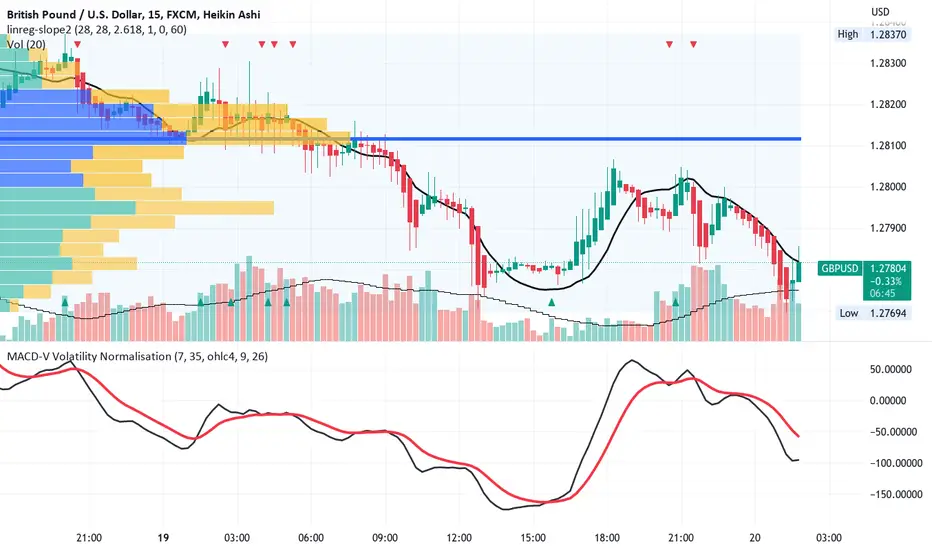
GBPUSD possible reversal from a double bottomWith recent Bank of England actions it makes sense the GB pound might strengthen a bit.
On the 15 minute- chart, the pair appears to be rising from a double bottom far below the
high volume area of the multi-session volume profile. On the MACD indicator, the MACD line
is downgoing but appears to be curling toward a reversal and is considerably below zero.
Overall, I will take a long forex trade with moderate leverage targeting 1.281 which is below
the POC line of the volume profile and so the value where the greatest volume of trades
took place recently. The stop loss is the pivot low at 1.2772.
EURUSDEURUSD is Bullish in the big time frame, but first some imbalances need to be filled, and as price break previous structure we can take this good opportunity.

GBPAUDChart is clear, in the bigger picture price tends to fall at least one more time to reach some important liquidity areas. And price is clearly consolidating for gaining some momentum. I expect to see price falling from one of the previous highs.

TSLA tyring to get to blue skyTSLA on the daily chart descended from a triple top Summer '22 into a downturn which
reversed after earnings in late January. Since then with the usual waves of up action and
retracement it has risen into its current range also going through a cup and handle pattern
from early April into late May. On the chart with the volume profile and anchored VWAP
overlaid, price is at the confluence of the POC line and the mean anchored VWAP - over the
past year the highest volume of trading was at about $185. RSLA is now above that
bullish momentum. TSLA short-selling bears are getting destroyed right now. Their buying to sell
is the genesis of a potential short squeeze. The latest trend started after an announcement of
partnership with Ford regarding charging stations. I have drawn onto the chart what I see
as horizontal resistance lines for targets in a trade. Aslo on the chart is a set of zero-lag EMAs
to provide further context. I will take a trade of four additional call options with a strike of
$185- I will close one for each horizontal target reached. I will run the last contract on a
trailing stop loss of 20% while expecting an overall conservative realized take profit of over
300%. The stabilization of macroeconomic headwinds in both the US, Europe and China
will allow significant tailwind to push TSLA higher. One of those tailwinds could be the
imperative that a rising price places on short sellers including a vast array of put options.

External Range Liquidity RunBias: downgrade from Bull to Neutral.
Positioning: Looking for entries to short.
15m fractal: So I began a short position in the form of long puts after trading back into Premium and making a run on internal buyside liquidity. Currently up 30% so may cover this position if we do not see displacement below 4100.
60min fractal: An idea here would be to long the BISI at 4100-4090. Dial in the entry on a BoS on a smaller time frame such as the 15m to get long and ride into the PDoL and then pivot the position short.
Daily/Weekly: Just ran some relative equal highs. Currently trading at a premium as notated "D/W EQ". Will add size for a mean reversion play if market trades into and purges external range liquidity.
Levels: I am using the impulse from the large sell side imbalance (4432 to 4303) as a premium draw on liquidity. 4320 is the prior Point of Control before the impulse down so some supply should be present there. 4350 should be the optimal trade entry.

Seeking Hidden Treasure: Navigating Virgin Points of ControlIntroduction: Anchoring in Unfamiliar Waters
Raise the Jolly Roger, folks! We’re setting sail into unexplored waters today. The stock market can be as unpredictable as the seven seas, and every now and then, you need a little treasure map to help navigate through the tempest. Virgin Points of Control, or VPOCs, are like the hidden coves full of buried treasure. Often overlooked by the untrained eye, these gems can be a goldmine if you know how to wield their power. So, batten down the hatches as we dive deep into the enigmatic world of Virgin Points of Control.
Casting the Net: What are Virgin Points of Control?
In the trading world, VPOC is the lingo for the price levels where heavy trading volume once took place, but hasn't been retested by price action since. In layman’s terms, imagine a bustling pirate market where a boatload of trading went down. Then, one day, the market moves elsewhere, leaving behind a ghost town. That, my friends, is your Virgin Point of Control.
The Ghostly Beacon: Spotting VPOCs
A VPOC can be a beacon in the stormy market. To find these mystical points, you’ve got to have your sea charts (read: price and volume charts) handy. Keep an eye out for volume peaks where the price hasn’t returned in a while. There’s your ghost town!
Charting the Course: How to Trade with VPOCs
Setting Sail: Identify the VPOC
First things first, whip out your spyglass and spot those VPOCs. Look for significant volume peaks and valleys that haven’t been revisited.
Heave Ho: Monitor Price Action
Don’t go in guns blazing just yet! Wait for the price to creep back towards the VPOC. When it's within reach, watch how it behaves.
Full Steam Ahead or Abandon Ship: Make the Call
If the price bounces back from the VPOC, there might be a treasure chest waiting. However, if it breaches the VPOC, it’s best to cut your losses and abandon ship.
Pirate’s Bounty: The Benefits of Trading VPOCs
Why should you care about these ghost towns? Here’s why:
High Reward Potential: Hidden treasures, anyone? The untested waters of VPOCs can offer rich pickings.
Valuable Insights: Understanding VPOCs can give you insight into what other traders are thinking, which is like having a pirate’s parrot eavesdrop on your rivals.
Beware the Kraken: The Risks
Just like the high seas, Virgin Points of Control have their fair share of risks:
False Signals: Sometimes, it’s just a siren’s call leading you to shipwreck. The price might tease you by nearing the VPOC and then leaving you high and dry.
Requires Patience: These ghost towns don’t crop up every day. It’s a waiting game, and sometimes the wait can be as long as the voyage of the Flying Dutchman.
FAQs
1. Can I use Virgin Points of Control for any market?
You bet! The stock market, forex, and commodities are all fair game.
2. Is it necessary to use other indicators along with VPOCs?
It's like having a crew on your pirate ship - the more, the merrier! Combining VPOCs with other indicators like moving averages can be a winning strategy.
3. How to identify a VPOC on a chart?
Look for peaks in volume where price hasn’t returned for a significant amount of time.
Charting New Waters: Concluding the Voyage
Virgin Points of Control are like the secret treasure maps of trading. Navigating these waters requires a keen eye, patience, and a dash of daring. With the right mix, VPOCs can be the buried treasure that catapults your trading voyage into legend. Just remember, the sea is a fickle mistress, and a smooth sea never made a skilled sailor. Weigh anchor and set sail, but keep your wits about you! May the trade winds be ever in your favor. Happy treasure hunting!

AUDJPY is impending reversal SHORTOn the one-hour chart, AUDJPY is in the area of overhead resistance and the supply zone. Both
the zero-lag MACD is showing bearish divergence. The mass index indicator has already given
a reversal signal where mathematically the indicator goes over 27 and then triggers when
it crosses down on 26.5 This indicator often misses a reversal but seldomly generates false
signals. Japan has had rock-solid central bank actions and policies perhaps propping up the
currency value in comparison with others including the Australian dollar. Overall, I have
high confidence in a short leveraged forex trade of the pair at this time. The stop loss is
just above the red supply zone while the target is just above the POC line of the volume
profile yielding a trade with a reward for risk of over 20.

KBE ( in top of ascending channel ) is ready to shortKBE on the one-hour chart has been in a rising parallel channel for a month. It is now near the
the top of the channel having pivoted within the past few trading sessions. The MACD which is
no lag shows a line cross above the histogram while the RSI is topped out as it was on May 23rd
the most recent previous pivot downward. I see this as a short setup. The stop loss is at
the recent pivot high while the target is $35.15 at the bottom of the channel and somewhat
confluent with the POC line of the volume profile which is a natural bounce and reversal
value. I would also short the banks by going long on BNKD which adds the extra risk and
potential reward of leverage ( see that idea)

DE traders buy on favorable earningsDeere Company had favorable earnings in May reporting quarterly earnings of about 3.5 % on
their share's market price. DE is a blue-chip industrial sector stock comparable to CAT. It not
a fast mover but very suitable for options trading or investment. On the 4H chart DE had been
trending down through earnings in a descending parallel channel and relying on a lower VWAP
for support. At the middle of this past week, DE made its reversal move into a trend up. This
was accompanied by a change in the volume to predominantly buying volumes relatively high
compared with the period before the earnings. This surge of volume of sorts is the fuel for
upward price action. The zero-lag MACD indicator shows moving average divergence Price is
breaking out of the channel moving towards the mean VWAP and POC line of the volume profile.
demonstrating bullish momentum. Accordingly, I see DE as well setup for a long trade.
( SL $345 pivot low TP1 $400 ( 1 std above mean VWAP ) TP2 $420 ( 2 std above mean VWAP)

SOFI in consolidation so can it continue bullishSOFI on the 2H chart is showing a massive bullish move of 30% in ten days. Most of the trading
volume was near to the present price and indicated by the POC line on the volume profile.
Price has not moved since most of the trades as there is now a consolidation phase more or less
in the style of the high tight bull flag pattern. The three pat indicator of RSI, momentum and
money flow index is red for momentum which went over 60 and then 80 and otherwise green.
Overall, the indicator is a bullish bias. The volume indicator interestingly shows most of the
the massive increase in volume is at the consolidation phase. This makes sense to me because in
a nearly parabolic up move without a pullback it is hard to find a decent entry. Many traders
including those based in large institutions will simply wait until a consolidation phase begins.
The price is in the upper VWAP bands showing buyer has successfully pushed against the
well-entrenched short sellers. The rise in price could force short sellers to buy to cover and
close. In doing so they would actually help entrench bullish momentum. I believe I will join
others in a long trade awaiting the next leg up. My stop loss is the mean VWAP +1 std dev while
the target will be mean VWAP +3 std dev. Fundamentally, I believe that the financial sector
including the fintech subsector are getting hot as technology is overextended.

Is DISH ready to dish out some profits?On the weekly chart, DISH has been in a steady decline for over a year and is now on sale for
20% of the asking price a year ago. It is sitting on the long term support zone and has passed
over the POC line of the volume profile putting buyers in control. The red doji candle followed
by the green doji candle is the capitulation of the bottom. Volume in 2023 has steadily and
persistently grown compared with 2022. The accumulation/distribution curve slope has
finally approached zero to suggest a price action reversal
. I will take a long trade early and beon the leading edge of the uptrend after noting a 15%
breakout to kick off the month of June.

⚖️ Auction Market Theory📍Auction Market Theory, developed by J. Peter Steidlmayer and expanded upon by Jim Dalton in his book Mind Over Markets, explains how financial markets function as auctions where buyers and sellers interact. The theory focuses on two main objectives: facilitating trade through a two-way auction process and determining the fair value of assets. Supply and demand dynamics and price discovery play a crucial role in this process. Auction Market Theory is represented using tools like Market or Volume Profile, which utilize bell-shaped curves to identify the value area, representing 68% or 1 standard deviation from the mean.
🔷 In a balanced market , buyers and sellers agree on prices based on their perception of fair value. This leads to lower volatility and prices that remain relatively stable, resulting in a ranging market. The fair value can be recognized using the Market or Volume profile, which appears as a Gaussian bell-shaped curve. However, financial markets rarely stay in balance indefinitely. New information, whether fundamental or technical, causes markets to move away from fair value and transition into a different environment.
🔷 Imbalance refers to the opposite of balance, where there is a disagreement about fair value. In this scenario, one side of market participants becomes more aggressive, leading to a trending market. Typically, markets tend to trend only about 20% of the time and range about 80% of the time. When the market is within the value range, it is more likely to remain in balance and explore within that range. However, in the case of an imbalance, the market often drifts higher or lower until it reaches a stop, typically within a previous value area.
💥Key Takeaways:
🔸 Auction Market Theory explains how financial markets function as auctions, focusing on facilitating trade and determining fair value.
🔸 Supply and demand dynamics and price discovery are essential in the Auction Market Theory process.
🔸 Tools like Market or Volume Profile use bell-shaped curves to identify the value area, representing 68% or 1 standard deviation from the mean.
🔸 In a balanced market, buyers and sellers agree on prices based on their perception of fair value, leading to lower volatility and a ranging market.
🔸 Financial markets rarely stay in balance indefinitely, as new information causes them to move away from fair value and transition into different environments.
🔸 Imbalance occurs when there is disagreement about fair value, leading to a trending market.
🔸 Markets tend to trend about 20% of the time and range about 80% of the time.
🔸 When the market is within the value range, it is likely to remain in balance and explore within that range.
🔸 Imbalanced markets often drift higher or lower until they reach a stop, usually within a previous value area.
👤 @AlgoBuddy
📅 Daily Ideas about market update, psychology & indicators
❤️ If you appreciate our work, please like, comment and follow ❤️

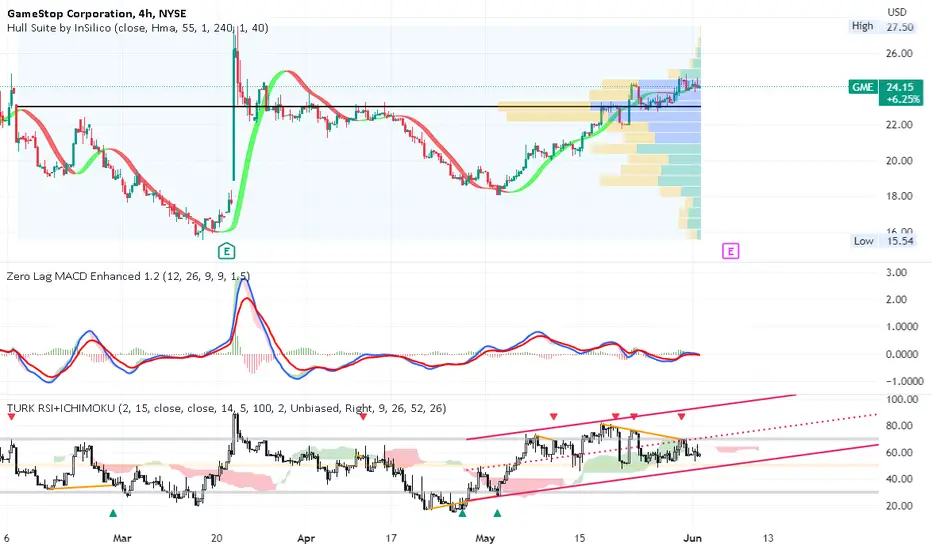
GME appears to be ready to sell in JuneGME on the 4H chart appears to have topped out at the end of May after a decent rise of
30% after the May 2nd bottom. At present, the Hull Suite trend indicator is signaling a
reversal while the MACD zer0 lag indicator shows the lines have crossed under the horizontal
zero and the histogram has turned red. The RSI Indicator is showing a bearish divergence with
strength decreasing from 80 to 60. I see this as a short setup and will take a position of
put options with some long stock shares as risk management and hedging strategy. My target is
a 50% retracement of May's move up and a stop loss above the swing high. GME is still above
the POC line of the volume profile. Once it drops to that value, I expect bearish momentum
acceleration. Earnings are coming. If in profit before earnings, I will take off half the position
for the earnings and then expect GME to rise and stop out the remaining position or drop
quite a bit more.
SNOW pulls bak on Earnings Discount SaleSNOW on the daily chart pulled back from decent earnings to in a massive bearish candle down
into its intermediate-term fair value zone near to the mean anchored VWAP and the POC line
of the volume profile. It is entirely possible that many traders sold SNOW at its highs when
they got FOMO over NVDA and needed to free capital to get more cash in their accounts
after buying NVDA . This could have easily helped SNOW go down despite decent earnings.
No matter if SNOW is on sale, I will buy it now setting a stop loss @ $145.00 and watch for
a Fibonacci-style retracement halfway back to the Pirvot high from which it fell for a first
the target of $ 170, a second of $180 ( one third of the position for each) and the final at
$170. In the meanwhile, I have a position on NVDA to play a possible drop.

FSR follows TSLA / NIO in uptrendFor the month of May on the 15-minute chart Fisker is up 27% while the general market QQQ
is up merely 4%. FSR riding an ascending parallel channel tested the channel yesterday. This
was met with high relative buying volume. (Fundamentally, TSLA and NIO are rising as well
as EV stocks gain some momentum ) The Better RSI indicator is oscillating between oversold
and overbought providing reasonable entries. The volume profile shows the highest volume
support from $ 61.0 to 6.65. The uptrend started at 5.10 and the POC line which is the likely
Fib 0.5 level on a future retracement combined in context suggest a target of 7.10 for the
current uptrend. I find this to be suitable for a long trade setup also factoring in a stop loss
at 6.55 just below the parallel channel.

Is ROKU ready to reverse and recover?ROKU here is on a one hour chart. IT has trended down from from its supply/ resistance area
of 65-68 and has dipped into its demand/ support zone of 52-53 per the Luxalgo indicator.
Price is presently far below the high volume area of the volume profile which shows the
the highest volume at 64. At this point, short sellers are buying to cover and take profit.
Price is now at the lowermost VWAP bands in the deep undervalued area. Bargain hunters
such as myself now have an interest. Fundamentally, the last earnings report was
reasonably favorable given the context of the general market and the economy.
I see ROKU as a long-trade candidate at this point. It should follow AAPL, TSLA, META GOOG
and other mega-caps and begin an uptrend. ROKU has high volume high liquidity and
relatively narrow spreads. I will take a call option trade striking $50 with a
DTE of 30-45 days. IF it performs well, at 21-30 days I will roll it into another.
