A little bit of tiny help that offer great resultsprnt.sc
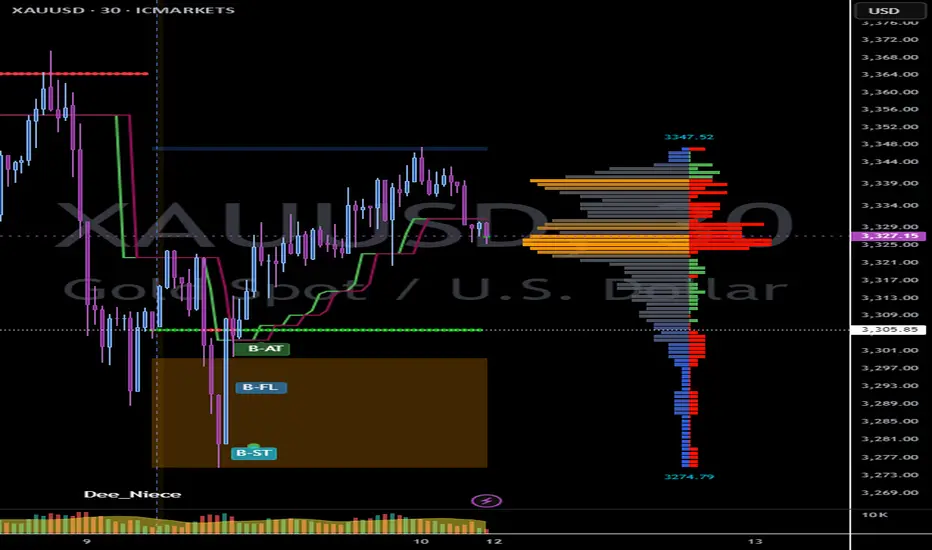
As always I based my charting on trend following method, but knowing where the exhaustion is crucial in helping when to take profit or make a sniper entry.
As I always rely on periodic Volume Profile, recently I switch to using Luxalgo Liquidity and Sentiment Profile. For timeframe 30 mins and lower, I used the fixed range with a total of bars per timeframe as my range. For 1 hour and 2h, I will used the weekly setup.
So far it brings great combination results. Check above link for my current open trade.
Volumeprofileanalysis
SOL Analysis Deep Dive: Identifying Optimal Entry and Exit ZonesYesterday, SOL gave a sharp downside shakeout, dropping from the weekly open at $147.98 (perfectly retested) down to the 0.5 Fib retracement of the swing at $140.25. Here’s a structured breakdown of the key levels, trade setups, and R:R profiles for both longs and shorts:
🔑 Key Levels & Confluences
1. Higher-Timeframe Opens
Weekly Open & Retest: $147.98 – pivoted price before the drop
Monthly & Prior-Day Open Cluster: $147.98–$146.31 – strong support confluence zone
2. Fibonacci Support Zones
0.5 Fib at $140.25 – primary mean-reversion entry
0.786 Fib (smaller wave) at $138.78 – secondary, deeper support
3. Order Block
Daily Bullish Order Block at $139.87 – just below 0.5 Fib, adds extra support
4. Volume-Weighted Average Price
Anchored VWAP (from ATH $295.83) at ~$166.45 – key upside resistance
5. Market Profile Value Areas (10-Day Range)
Value Area High (VAH) at ~$153.00 – overhead resistance confluence
Value Area Low (VAL) at ~$145.75 – underpins support
📈 Long Trade Setups
1. 0.5/0.786 Fib + Daily Bullish Order Block
Entry: $141-138.78
Stop-Loss: $137.5
Target: $165 (anchored VWAP / Fib zones)
R:R ≈ 9:1
2. Higher-Timeframe Open Cluster
Entry Zone: $147.98–$146.31(monthly/weekly open)
Stop-Loss: $142.5
Target: $165
R:R ≈ 3:1
• Why these levels? The 0.5 Fib is a classic mean-reversion zone, bolstered by the daily order block. The $147–146 zone ties together multiple opens (weekly, monthly, prior-day), offering a solid demand area if price retraces back up.
📉 Short Trade Setup
Trigger: Rejection / swing-failure around $153.4
Entry: $153.4
Stop-Loss: $154.3
Target: Weekly/Monthly open (~$147)
R:R ≈ 6:1
• Low-risk short: A clean rejection at the recent high lets you define risk tightly above the swing, aiming to capture the retrace back to the opens.
🎯 Summary & Game Plan
Primary bias: Look for long entries at the 0.5 Fib ($140.25) or the open-cluster zone ($147–146), with targets toward the anchored VWAP at ~$166.
Alternate bias: A short on clear rejection from $153.4, targeting the opens as support.
Risk management: Keep stops tight (SL below $137.5 or above $154.3) to maximize R:R on your favored setups.
Volume & Price Action: Confirm entries with an uptick in volume or bullish price structure (for longs) or swift failure patterns (for shorts).
Now it’s a waiting game! Let price revisit these zones, watch for confirmation signals, and then scale into your chosen side. Good luck! Don't chase, let the charts come to you!
____________________________________
If you found this helpful, leave a like and comment below! Got requests for the next technical analysis? Let me know.

Weak Low in Trading RangeVery weak low in this range shown at the horizontal ray. I expect this to be taken out at some point to "grab" liquidity. Fairly large HVN also though which could suggest a bounce as buyers defend.
When this range breaks I am unsure if it will break up or down. EUR/USD trading fairly high and dollar sentiment seems to be picking up a little, so I think it will break low, however the technical outlook says it will break up.
As mentioned previously, on the daily/weekly chart we have one half of a very clean head and shoulders and the exact mirror image on the DXY chart. So lets see.

Short Idea on EURUSDBased on :
- Periodic volume profile
- Seasonality
- Currency strength of usd and eur are weakest vs strongest
- small divergence on Poiv but on weekly timeframe is more evident
- Cot data

Are getting strong 4 long lol??✅ Summary of Top-Down Analysis:
🟢 Daily (Macro Bias):
Bias: Neutral → Leaning Bullish
Context:
MACD and price both made lower lows (convergence = no divergence, but momentum weakening).
Price hit strong support at 16,457.
Bullish close post-FOMC + macro catalyst (Trump’s tariff changes) = positive sentiment.
Key note: China-specific tariff at 125% could inject volatility, possibly sector-specific.
🟠 4HR:
Bias: Bullish
Confluence:
Higher high in price and MACD = bullish momentum confirmed.
Price reclaimed structure after failed low.
Approaching last week's POC → possible liquidity grab + continuation.
4HR bullish imbalance could be a key reaction zone (support).
🔴 1HR:
Bias: Bullish
Context:
Clear bullish structure + MACD higher high.
Aligned with 4HR bullish flow = continuation potential.
🔵 15min:
Bias: Bullish
Micro Context:
Structure and MACD aligned → price above previous NY POC = showing strength into next session.
May look to use NY POC or VWAP pullbacks for entry.
🎯 Gameplan Suggestions:
Scenario 1 – Continuation Entry:
Look for pullbacks into 4HR imbalance zone or 15m demand + VWAP area.
Use MACD + price action confirmation for entry (e.g., engulfing, break of lower highs).
Targets: swing high above 4HR structure + liquidity zones.
Scenario 2 – Reversal Risk:
If price shows exhaustion near last week’s POC, especially with MACD divergence on lower timeframes → consider a quick short scalp or stay flat until new structure forms.
👀 Key Levels to Watch:
🔹 16,457 = macro support
🔹 Last week’s POC = near-term resistance/liquidity
🔹 Bullish 4HR imbalance zone (mark this for entries)
🔹 Previous NY POC / VWAP area = short-term entry pullback zone

Watching For Consolidation, Correction or ContinuationWeekly:
Price took out old swing low after a lower low was printed — confirming bearish intent.
However, price is now inside a new HTF support zone.
MACD remains bearish, signaling potential continuation lower, but watch for possible slowdown or divergence signs in this zone.
Daily:
Structure is firmly bearish — lower low confirmed.
MACD bearish and showing momentum strength — favors continuation lower unless lower timeframes suggest a deeper correction.
4H:
Bearish convergence confirmed — price action aligns with HTF bearish bias.
However, current price action is corrective/bullish — likely a pullback within a bearish trend.
MACD still bearish but weakening — signals caution for late shorts, or potential for deeper retracement.
1H:
Monday's failure to make a new low overnight hinted early market structure shift — bullish correction in play.
MACD turned bullish into Friday's POC, and price rallied into 4H bearish imbalance above it.
Currently:
1H hidden bearish convergence developing — early sign correction may exhaust.
MACD weakening — signals reduced bullish momentum.
Key overnight scenarios:
Consolidation near current highs (distribution?)
Continuation of bullish correction into deeper supply
Bearish continuation if sellers step in aggressively from imbalance zone

we might continue dropping daily hidden divergence, price might want to continue seeking sell side liquidity
4hr is making a new low and taking out old lows (sell side liquidity) to the left MACD is not converging as of yet
1hr hbrsh-div price is dropping ahead of red news this Friday, could head to 1hr old low or weekly low, waiting to see how price reacts to news
m15 price is below POC of previous NY session POC, as well as overnight Asian and London session converging nicely ahead of news I would favor price reacting short-term from m15 bearish imbalance before reaching the lows around the NY open after news but we will see

INTRADAY MOVEMENT EXPECTEDi can see still there is liquidity above at the poc of the weekly volume
but if the price can cross up the level it can visit the next resistance above
so if the price at london session cross down the value area i will expect visit the levels shown on the chart as support and make the rejection
so we have to follow the plan and and use the levels on the chart risk management safe the profit secure the orders after the price move stop at break even
we wish happy trade for all

Sweet Spot To Sell The BTC Pullback In a strong downtrend. Every pullback on the 4hr and Daily chart will be hyped by the bulls & super cycle evangelists as a "WE'RE BACK" moment.
I will continue to take this same setup, selling Major swing highs on 4HR & Daily chart on BTC until the Daily Chart flips bullish. Until then or some news come out, we will remain in the downtrend until we hit the target shown in my last analysis, see link below.

Full Market post NFP Review: Pure Consolidation as expectedEverything seems to be at an inflection point with currencies taking the reigns for profitability 💪🏽 EU/GU are inversing the dollar really well as always with that strong direct correlation. This is why we at Hollywoood Trades believe in market diversity. It is good to understand what should happen and what will be the result of an out of sync indices and metal market vs. the currency direct correlation pairs.
Share with someone in need of strong levels 🎯

Bonus Update: Scalpers notes on 1 min chartBAR method applies to every times frame. Those break and retest candle levels are so good on lower time frame when you know what to look at 🔑
Share with a friend in need 🫡

Indraday Update: NAS respecting bearish imbalance targetingWe have created yet another nearish imbalance range that price has used to continue to build short interest 🎯
Share with a friend in need of great levels 🔑

BTC getting bullish closes on daily after a mean fib retestGet your eyes back to the sky after receiving the double bottom retest using last weeks levels as support 🎯 As we like to keep it simple using previous candle levels as support or resistance, we can expect all levels closed over to act as Break and Retest (BAR Method) points to hold us up.
Share with a friend in need of trustworthy and logical levels 🔑

EUR GBP & DXY Update--DXY Tanking as expectedFrom pre-new year analysis we expected by the printout that last year's high would be purged for liquidity and then we would fall out of the old imbalanced short range 🔑
Voila, what else could we expect. We are always on point with long term analysis.
Share with a friend in need 💰

Intraday Update: Gold acting just as it should in this range As outlined previously, gold is in a consolidation range and rebounding from all of it's liquidity zone 🎯
Share with a friend who wants to learn true levels 🔑

Gold resuming it's usual bullish narrativeAs we always say, after a bullish daily close, we will remain bullish until a bearish daily close. With that being said, there was def a short opportunity today after reaching our buyside goal.
We will continue to track the development here and keep you on point with expectations.
Subscribe & Share this with a friend!

Gold back to it's normal bullish programAs we always say, after a bullish daily close, we will remain bullish until a bearish daily close. With that being said, there was def a short opportunity today after reaching our buyside goal.
We will continue to track the development here and keep you on point with expectations.
Subscribe & Share this with a friend!

NAS & Indices are continuing to meltAll the indices are still seeking correction of inefficiencies existing in the sellside. There isn't much else to be said of this current situation until we start receiving bullish closes on higher time frame 4H/Daily.
Be sure to share this with a friend. I assure you this is trustworthy information and levels 🫡

BTC hitting key demand zone as forecast weeks agoIf you've been following the narrative here, you know what we are looking at. This dip is to establish the yearly low in BTC as forecast before the new year's candle started.
Let me know what you're seeing and we'll discuss it in the next video. Be sure to sub & like. Thanks for watching.

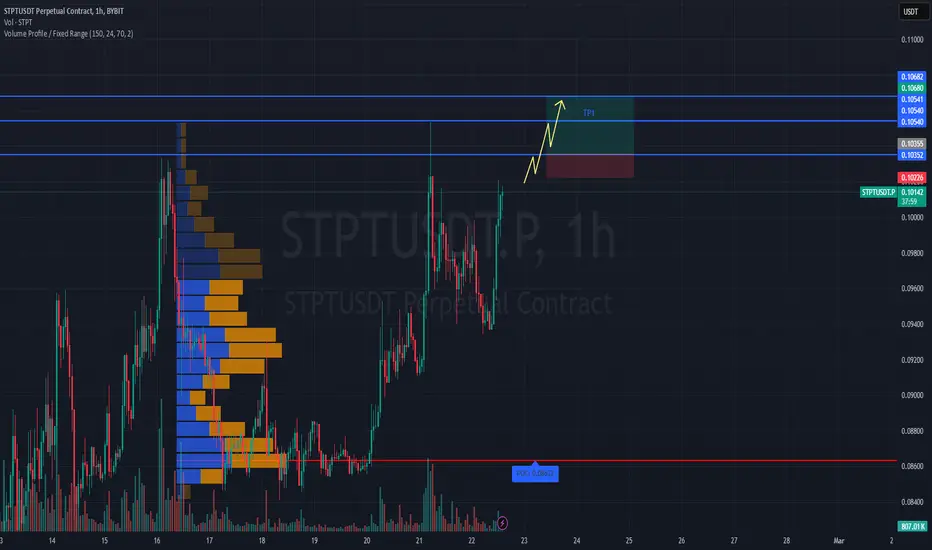
#STPTUSDT maintains bullish momentum📈 LONG BYBIT:STPTUSDT.P from $0.10355
🛡 Stop Loss: $0.10226
⏱ 1H Timeframe
✅ Overview:
➡️ BYBIT:STPTUSDT.P is showing strong bullish momentum after consolidating at lower levels, indicating buyer presence.
➡️ Volume Profile suggests that the main liquidity (POC) is positioned significantly below the current price, confirming demand dominance.
➡️ A breakout above $0.10355 and holding above this level will validate the bullish continuation.
➡️ The nearest resistance zone is between $0.10540 and $0.10680, where partial profit-taking may occur.
⚡ Plan:
➡️ Long entry upon breaking $0.10355, confirming buyer strength.
➡️ Stop-Loss at $0.10226—placed below the nearest support to minimize risk.
➡️ Main target range: $0.10540–$0.10680, where selling pressure might emerge.
🎯 TP Targets:
💎 TP 1: $0.10540
🔥 TP 2: $0.10680
🚀 BYBIT:STPTUSDT.P maintains bullish momentum — expecting further upside!
📢 BYBIT:STPTUSDT.P remains within an uptrend. If the price consolidates above $0.10355, further acceleration is expected.
📢 Volume suggests strong buyer activity, supporting the bullish outlook.
📢 However, the $0.10540–$0.10680 zone could act as a profit-taking level, so monitoring price action and partial profit-taking is advisable.
SOL/USDT Trading Scenario UpdateThe overall negative sentiment in the altcoin market, along with the beginning of the FTX customer repayment process, is putting downward pressure on the price of Solana (SOL). Currently, the asset's value has declined by more than 45% from its local peak and has dropped below the 300-day moving average.
From a volume profile perspective, market participants' interest in SOL remains high within the current broad price range. At its current price level, the asset appears attractive for long-term investments.

HNT/USDT Trading ScenarioThe price chart of the asset shows a significant increase in trading volumes within a broad range from $2.875 to $11.153. From a volume analysis perspective, despite pronounced volatility, market participants continue to accumulate the asset within the current price corridor. At the moment, the asset's price is below the POC (Point of Control) level and has bounced off the support level at $2.875, which marks the lower boundary of the active range.
Given the current dynamics, a gradual price movement toward the upper boundary of the range can be expected, which may lead to a breakout of this level and further development of the upward trend. Such scenarios are supported by the fact that increasing trading volumes in the direction of the current trend typically signal its stability and the likelihood of continuation.

Weekly price prediction: $71.49 (Min) and $77.37 (Max).Projected Price Range
The anticipated weekly price range for Brent Crude Oil is expected to fluctuate between $71.49 (Min) and $77.37 (Max).
Contended Price Levels
$74.50 – Point of Control (POC) – potential support
$73.22 - $71.49 – High Volume Node (HVN) – potential support
$77.32 - $81.62 – Low Volume Node (LVN) – potential resistance
Technical Analysis
Fibonacci Retracement & Price Movement:
The price reached the 0.5 Fibonacci retracement level in mid-January before retracing.
This level has demonstrated consistent horizontal price movement over the past six months, indicating it as a key reference point.
Volume Profile Analysis:
High Volume Node (HVN): Found between $73.22 and $71.49, indicating strong liquidity and potential support.
Low Volume Node (LVN): Between $77.32 and $81.62, which could lead to rapid price spikes if the price enters this zone.
MACD and Stochastic RSI:
Stochastic RSI (Bottom Indicator): Has shown low bearish momentum over the last two weeks and appears poised for an upward crossover, signalling potential price growth.
MACD (Top Indicator): Remains in the negative region, with a few weeks left before a possible crossover, implying continued caution for bullish sentiment.
Additional Factors
Support & Resistance Considerations:
Point of Control (POC) and HVN are close to the current price, reinforcing these as key support zones.
The price is currently resting on a previous resistance level that has now turned into support.
The black rectangle above the price highlights the LVN region, where rapid price movements could occur.
The white rectangle represents a large support zone, which may contribute to horizontal price movement.
Geopolitical & Market Sentiment:
As always, geopolitical events could significantly impact price fluctuations, and traders should remain alert to any market-moving developments.
Conclusion
Brent Crude Oil prices for the upcoming week are likely to remain within the projected range, given the strong support levels in the current price zone. However, any breakout downward could be swift, while an upward breakout could be accelerated due to the LVN region.
