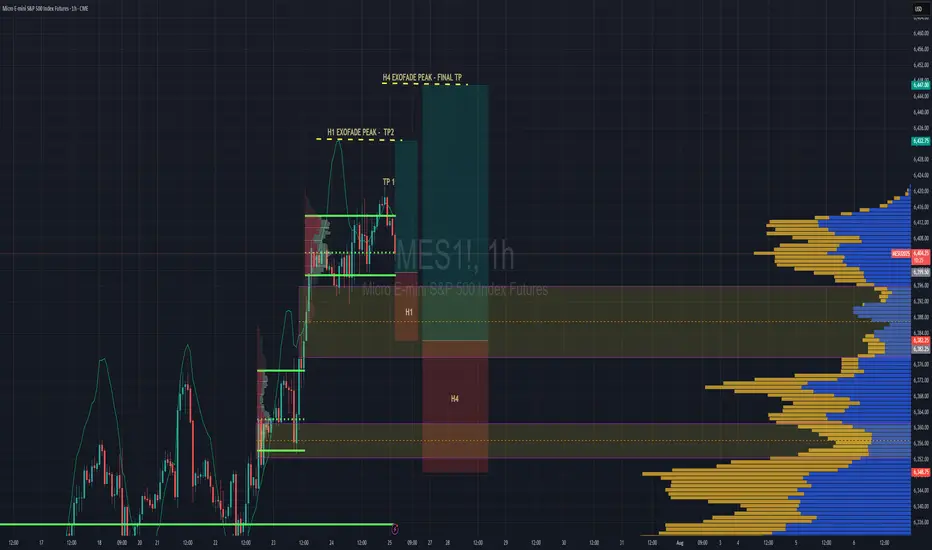
S&P 500 Intraday & Swing Entries H1 entry is close to getting activated for intraday.
If you want a swing trade then wait for H4 entry (you might be waiting a while obviously)
Reason for entries - We have broken out of Balance since July 25th and currently in a trend phase until we establish a new value area, or return to the one we broke out from.
So since Trend and Momentum is UP, then we should find Low Volume Areas to enter in the direction of the trend for a classic pullback entry trade.
Volumes
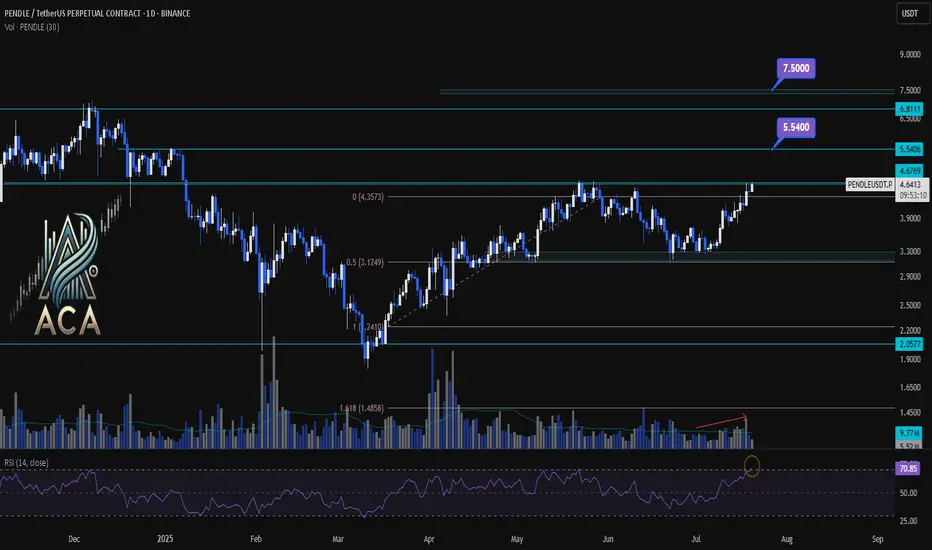
PENDLEUSDT 1D Chart Analysis|Bullish Breakout Eyes Higher TargetPENDLEUSDT 1D Chart Analysis | Bullish Breakout Eyes Higher Targets
🔍 Let’s break down the PENDLE/USDT daily chart, focusing on breakouts above key resistance, Fibonacci retracement dynamics, RSI momentum, and volume confirmation for a comprehensive bullish setup.
⏳ Daily Overview
PENDLE has staged a powerful recovery after pulling back to the 0.5 Fibonacci retracement level (around $3.12). Price is now testing the critical $4.68 resistance—the ceiling from the last corrective wave. RSI has jumped above 71, entering the overbought zone, a classic precursor to strong momentum moves. Volume is rising as bulls attempt a breakout, confirming participation behind the price action.
📈 Technical Convergence and Trend Structure
- Fibonacci Structure: The correction held the 0.5 retracement, a textbook bullish reversal zone in rising trends.
- Resistance Breakout: Price is challenging the $4.68 resistance. A daily close above, especially with high volume, would confirm the breakout and trigger bullish continuation.
- RSI Indicator: RSI has cleared the 70 mark, reinforcing strong momentum. Overbought RSI often supports further rallies when backed by breakout moves and rising volume.
- Volume Confirmation: Volume surged as PENDLE reclaimed lost ground and is now accelerating into the resistance test, suggesting trend conviction and confirming the move.
🔺 Bullish Setup & Targets
- First target: $5.54 — the next resistance based on historical supply and Fibonacci extension.
- If macro conditions like interest rate cuts align, the next potential target: $7.50 — the major extension target where price discovery is likely.
- Key trigger: A strong daily (or weekly) close above $4.68, combined with breakout volume, is likely to ignite the next leg up.
📊 Key Highlights
- Correction held at the 0.5 Fibo, signaling trend health and resetting momentum.
- A bullish daily structure aligned with a weekly breakout confluence.
- RSI and price action both making new local highs — strong uptrend indication.
- Volume confirming the move—a real breakout is underway, not a false start.
🚨 Conclusion
PENDLE/USDT looks primed for continuation higher. The blend of a successful 0.5 retracement retest, breakout attempt above $4.68, robust RSI, and volume surge all point to bullish follow-through. Watch for a confirmed close above resistance as the catalyst for further upside, with $5.54 and $7.50 the next logical targets if momentum persists.
Gold. 14.07.2025. The plan for the next few days.The nearest resistance zones are where it's interesting to look for sales. It's not certain that there will be a big reversal, but I think we'll see a correction. We're waiting for a reaction and looking for an entry point.
The post will be adjusted based on any changes.
Don't forget to click on the Rocket! =)

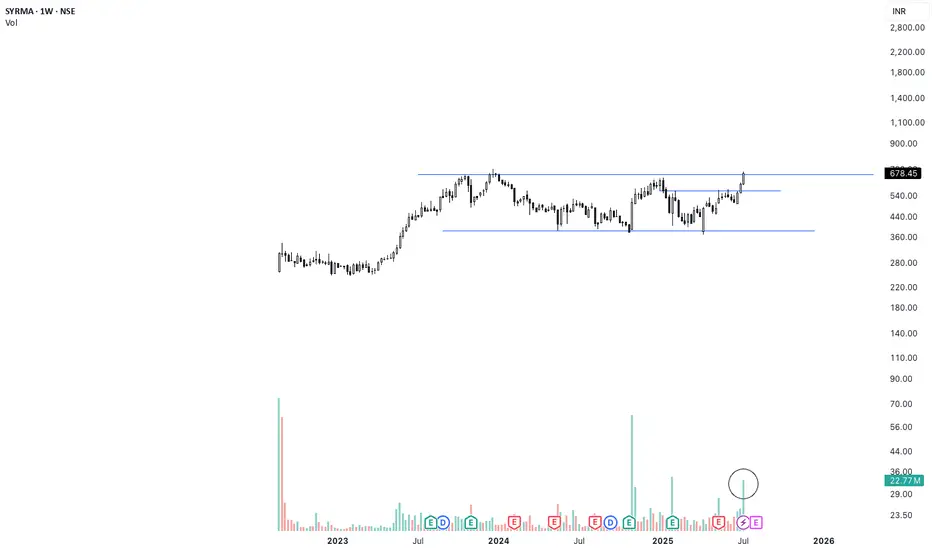
SYRMA Weekly Breakout | High Volume + 1.5-Year Base Structure🚨 Breakout Alert on SYRMA (Weekly)
After 1.5 years of sideways consolidation, SYRMA has finally broken out with strong conviction. The breakout is supported by the highest weekly volume seen in months — signaling smart money accumulation.
📊 Technical Setup:
🔹 1.5-year base formation now broken
🔹 Breakout candle closed above resistance with strength
🔹 Volume spike confirms breakout validity (HVE)
🔹 Structure resembles classic Stage 2 breakout
🟢 Ideal retest zone: ₹670–₹680
🛑 Support zone: ₹635–₹645
Fundamental Snapshot:
✅ Revenue: ₹2,000 Cr → ₹3,800 Cr in 2 years
✅ Net Profit up 50% YoY
✅ EPS (TTM): ₹9.57
✅ Promoter holding: ~46%
✅ Dominant player in EMS & IoT hardware
⚡Macro trend supports domestic electronics manufacturing — still early in the cycle.
You Haven’t Missed It**⏰ Timeframe: 1H**
**🛠 Tools Used: Dow Theory, Support & Resistance, Volume, RSI**
**📈 Market Overview**
Bitcoin BINANCE:BTCUSDT is currently trading at **110,982**. After hitting a new all-time high at **12K**, the price is undergoing a mild correction. Despite the retracement, price remains supported by both volume and the 25-period moving average.
Yesterday, BTC broke through the **110,267** resistance level with a strong bullish candle, but encountered aggressive selling from market makers and is now consolidating with weak candles below the **12K** mark.
Typically, in such market phases, it’s advisable to close previous positions and consider new entries. However, given the likelihood of **interest rate cuts** and the fact that price is holding near its ATH, keeping previous **long positions** open may be wise, as a **strong upward move** is still on the table.
**⚙️ Technical Analysis**
Yesterday’s breakout above **110,267** was met with seller pressure near **12K**, leading to a shallow correction.
**BTC Dominance (BTC.D)** has broken above **65.04** and **64.69**, moving toward **64.51** resistance. However, a weakening candle structure is visible on both **4H and 1H** timeframes. This indicates that while long opportunities on bullish **BTC pairs** may still exist, we might see a lower high forming above **64.51** and below **64.69**, followed by another move back toward **64.51**.
Meanwhile, **USDT Dominance (USDT.D)** broke below the **4.75** support with a strong candle and is now ranging above **4.63**, suggesting a possible pause or rest phase here.
The **Total Market Cap** shows a similar pattern to **BTCUSDT**, reflecting consolidation with slight bullish bias.
The **Others** chart (excluding BTC & ETH) shows a healthy uptrend and is now facing resistance at **248.68**. A breakout above this level could pave the way for stronger performance among altcoins with bullish BTC pairs.
**🧭 Potential Scenarios**
📗 **Bullish Scenario:**
If BTC forms a **higher low above 110,654**, an entry could be considered above **12,000**, with a stop-loss placed below the higher low (based on the 1H timeframe). Volume confirmation is necessary to support the move.
📕 **Bearish Scenario:**
As long as the price remains **above 109,409**, **short positions are not recommended**.
**💡 Conclusion, Warnings & General Suggestion**
Bitcoin is currently in a **healthy bullish phase**.
The **key resistance at 111K** has been broken, and price is pulling back toward that level.
The structure remains bullish, supported by **sufficient volume** and **no clear bearish divergence**.
If current support holds, there’s potential for continuation toward the **113,500–114,000** range.
⚠️ **Warnings:**
* If the pullback turns into a breakdown (falling below **110,200**, then **109,000**), it would signal **buyer weakness**, and strategy must be reconsidered.
* Watch for **RSI divergences** or **declining volume** during further rallies—they may indicate caution.
* Prolonged consolidation **below broken resistance** could also indicate market weakness.

EUR/USD Price Retrace and Reaction to RejectionQuite a significant rejection of price at around the 11256 level. Didn't think much of it at first, however there is a surprisingly large volume node at 11268.7. This has been resistance in the recent past.

Follow the Flow: Trading with Liquidity ZonesLiquidity is where the market breathes. The Liquidity Zones indicator by BigBeluga helps traders visualize where large players may be hiding orders—revealing the zones where price is most likely to react, reverse, or accelerate.
Let’s break down how this tool works, how we use it at Xuantify, and how you can integrate it into your own strategy.
🔍 What Is the Liquidity Zones Indicator?
This open-source tool identifies pivot highs and lows filtered by volume strength and plots them as liquidity zones —highlighting areas where buy/sell orders are likely to accumulate.
Key Features:
Volume-filtered pivot detection (Low, Mid, High)
Dynamic or static liquidity zone boxes
Color intensity based on volume strength
Liquidity grab detection with visual cues
These zones act as magnets for price , helping traders anticipate where reactions, reversals, or stop hunts may occur.
🧠 How We Use It at Xuantify
We use Liquidity Zones as a contextual map for structure and execution.
1. Entry & Exit Planning
We align entries near untested liquidity zones and use them as targets for exits—especially when confirmed by structure or momentum.
2. Liquidity Grab Detection
When price pierces a zone and reverses, it often signals a liquidity sweep . We use this as a trigger for reversal setups.
3. Volume Context
Zones with higher volume intensity are prioritized. These are more likely to attract institutional activity and generate stronger reactions.
🧭 Dynamic vs. Static Zones
The indicator offers both dynamic and static zone modes:
Dynamic : Box height adjusts based on normalized volume, showing how much liquidity is likely present.
Static : Consistent box size for cleaner visuals and easier backtesting.
Why this matters:
Dynamic zones reflect real-time volume strength
Static zones offer simplicity and clarity
Both modes help visualize where price is likely to “grab” liquidity
⚙️ Settings That Matter
To get the most out of this tool, we recommend:
Volume Strength = Mid or High for cleaner zones
Enable Dynamic Mode when trading volatile assets
Use Color Intensity to quickly spot high-liquidity areas
🔗 Best Combinations with This Indicator
We pair Liquidity Zones with:
Market Structure Tools – BOS/CHOCH for context
Momentum Indicators – Like RSI or MACD for confirmation
Fair Value Gaps (FVGs) – For precision entries near liquidity
This layered approach helps us trade into liquidity , not against it.
⚠️ What to Watch Out For
Liquidity zones are not signals —they’re context . In fast-moving or low-volume markets, price may ignore zones or overshoot them. Always combine with structure and confirmation.
🔁 Repainting Behavior
The Liquidity Zones indicator is designed to be non-repainting . However, due to waiting for pivot confirmation, the zones are plotted in hindsight. This makes it suitable for real-time execution .
⏳ Lagging or Leading?
This tool is partially lagging —it waits for pivot confirmation and volume validation before plotting a zone. However, once plotted, these zones often act as leading levels , helping traders anticipate where price may react next.
🚀 Final Thoughts
The Liquidity Zones indicator by BigBeluga is a powerful visual tool for traders who want to understand where the market is likely to move—not just where it’s been. Whether you’re trading reversals, breakouts, or mean reversion, this tool helps you stay aligned with the market’s hidden intent.
Add it to your chart, test it, and see how it sharpens your edge.

EURUSD. Weekly trading levels 14 - 18.04.2025During the week you can trade from these price levels. Finding the entry point into a transaction and its support is up to you, depending on your trading style and the development of the situation. Zones show preferred price ranges WHERE to look for an entry point into a trade.
If you expect any medium-term price movements, then most likely they will start from one of the zones.
Levels are valid for a week, the date is in the title. Next week I will adjust the levels based on new data and publish a new post.
! Please note that brokers have a difference in quotes, take this into account when trading.
The history of level development can be seen in my previous posts. They cannot be edited or deleted. Everything is fair. :)
----------------------------------------------
I don’t play guess the direction (that’s why there are no directional arrows), but zones (levels) are used for trading. We wait for the zone to approach, watch the reaction, and enter the trade.
Levels are drawn based on volumes and data from the CME. They are used as areas of interest for trading. Traded as classic support/resistance levels. We see the reaction to the rebound, we trade the rebound. We see a breakout and continue to trade on a rollback to the level. The worst option is if we revolve around the zone in a flat.
Do not reverse the market at every level; if there is a trend movement, consider it as an opportunity to continue the movement. Until the price has drawn a reversal pattern.
More information in my RU profile.
Don't forget to like Rocket and Subscribe!!! Feedback is very important to me!

Wait for a Proper Support!Wait for some Bullish Candles to appear at Support level with Good Volumes.

Strength on HPQ ChartHP Inc., stock approaches the bottom of the sideways channel (black horizontal lines) from which it may bounce again.
During the May 29, 2024 bar, professionals bought (blue rectangle), and since then, whenever the price reached this zone, they were buying more.
It should be noted that the buying around the bottom of the sideways is much bigger than the selling around its top which is bullish behaviour. Wyckoff's Spring on the recent activity adds to strength too. Another good sign for bulls is the decreasing volume on the down move, which indicates an absence of professional interest in lowering prices.
The testing process is ongoing as of today. If the price reaches the buying zone and no supply reappears, there is a big probability for a move up towards $37.30 - $ 39.29 with minor resistance around $34.62 - $34.72.
If supply reappears and the price breaks the bottom of the sideways channel ($32.41) we may see another leg down to $29.00 - $30.00 for more buying.

Strength on PCAR stock Paccar Inc. stock looks strong. We can see that since October 2024, the largest volume occurred after publishing earnings reports or on ex-dividend dates. Please note that:
- All bars on those days are down with the closing price in the middle of the bar which in Volume Spread Analysis (VSA) indicates strength.
- The volume on the October 22nd 2024 daily bar is the largest till now and the current price is above it.
- All professional activity after October 2024 is happening around the buying zone created during the October 22nd bar (blue rectangle $104.38 - $104.91).
- Recent buying (February 12th) breaks the previous low ($102.64) and recovers above that level which is a Wyckoff's Spring.
This all is very bullish. Still, the last testing showed the presence of supply.
If professionals can absorb the supply, we may expect a rally towards $116.01 - $117.83 with potential resistance in the $112.18 - $114.73 zone. Otherwise, another leg down to $100.01 for more buying is possible.

Strength on FMC stockAfter publishing the February 5th 2025 earnings report, the FMC Corporation stock gapped down, losing almost 34% of its value. Moreover, nowadays, the company is under serious pressure after being accused of publishing false Sales and Inventory information and downgrading shares from "Buy" to "Neutral" by some analytic companies (e.g. Redburn). Logically, in such circumstances, prices should continue down, but as a matter of fact, it is not the case. Why?
First, the February 5th bar is a down bar on a huge (largest in the last 15 years) volume, which, according to Volume Spread Analysis (VSA), indicates professional buying. Then, 2 days later, professionals bought again and the market responded by the higher prices.
Finally, the gapped-down bar reached the level of the previous support (blue rectangle on the daily and weekly charts), which adds strength.
Even though it looks very bullish on the daily chart, the price should be tested before the rally. Therefore, we may expect a shallow correction to $35.13 - $36.34 or, if supply is still there, to $30.80-33.73.
If testing is successful and the up move begins, the potential resistance on the way up will be around $48.06-$48.73 and $52.65 - $54.54 areas.

Weakness on HOOD stockRobinhood Markets, Inc. (NASDAQ: HOOD) shares appear to have sold off after publishing its February 12th earnings report. Following the report's good news, the market gapped up on opening and triggered a buying surge, allowing professionals to sell. The next day, the price recovered on a significantly lower volume, indicating absence of the professional interest on the upside (weakness). Then, on February 18th, another selling took place, which absorbed the remaining demand and pushed the price below the low of the gapped-up bar. This is bearish behaviour.
It has to be noted that there were a few more selling activities in December 2024/January 2025 (red rectangles), making the overall situation on the stock even weaker.
Despite the serious weakness, we may still see a retracement up into the $62.09 - $65.21 area for either more selling or retesting of demand, after which a move down to the $41.04-$42.66 zone could be expected. In this case, the support might reappear around the $52.96 level and at the $49.56 - $50.19 area.

HNT/USDT Trading ScenarioThe price chart of the asset shows a significant increase in trading volumes within a broad range from $2.875 to $11.153. From a volume analysis perspective, despite pronounced volatility, market participants continue to accumulate the asset within the current price corridor. At the moment, the asset's price is below the POC (Point of Control) level and has bounced off the support level at $2.875, which marks the lower boundary of the active range.
Given the current dynamics, a gradual price movement toward the upper boundary of the range can be expected, which may lead to a breakout of this level and further development of the upward trend. Such scenarios are supported by the fact that increasing trading volumes in the direction of the current trend typically signal its stability and the likelihood of continuation.

KAVA/USDT Trading ScenarioThe asset's price, like most altcoins, has undergone a significant correction and is currently trading near its local low. However, despite the decline in quotations, the market is experiencing a noticeable increase in trading volumes, indicating strong demand from buyers. A confident absorption of supply during the downturn suggests potential interest in KAVA from large players.
From a volume analysis perspective, the price is within the Point of Control range, reflecting the highest trading volume in the current price corridor. This confirms substantial market participant interest and the formation of a liquidity zone, which may act as support if consolidation continues. If volumes continue to rise and the price holds above key levels, this could signal a trend reversal and the development of an upward momentum.

Ethereum Analysis: Mid-Term Outperformance PotentialWith the market currently in a Risk-On environment and Bitcoin achieving a new All-Time High (ATH) , an analysis of Bitcoin Dominance and the ETH/BTC chart suggests that Ethereum may outperform Bitcoin in the mid-term.
Two potential target zones have been highlighted on the chart for reference. As always, proper risk management is crucial when planning trades.
Good luck dears
Masoud Eskandari

APE/USDT Trading ScenarioThe asset is currently trading 95% below its all-time high (ATH). Unlike most cryptocurrency market categories that are showing growth despite significant corrections, the NFT and metaverse segments remain in the shadows, not showing significant dynamics.
APE is currently near its all-time low, and in terms of volume profile, there is interest from market participants, as well as accumulation of positions in the current range. Fundamentally, the token is still associated with one of the most famous projects in the NFT sphere – Bored Ape Yacht Club (BAYC), as well as with the Otherside metaverse. However, it has fallen outside the zone of active investor attention amid the rapid growth and popularity of meme coins.
This asset deserves close attention, as it has the potential for significant upward movement.

Analyzing Key Forex Patterns and IndicatorsAnalyzing the SPX500 chart reveals several key patterns and indicators critical for forex trading
1. Support and Resistance Levels:
Resistance Zone: The blue-shaded area around the 6,071 level is a significant resistance zone where the price has struggled to break through.
Support Level: The horizontal blue line at approximately 5,840 (labeled "SMS") represents a notable support level where buying interest has emerged in the past.
2. Swing High (SH):
The red horizontal line marked "SH" around the 6,077 level highlights a failed swing high, indicating a previous peak in price.
3. Price Movements:
There is a notable decline from the resistance zone around 6,020 to a low near 5,770, followed by a recovery towards the 6,000 level.
4. Volume:
The volume, indicated as "Vol 7.14K" at the top of the chart, provides insight into the trading activity during this period.
Potential Effectiveness of this Technical Signals:
Resistance Zone: If the price breaks above this level with strong volume, it could signal a bullish trend continuation. However, failure to break through may indicate a reversal or consolidation.
Support Level: Maintaining above this support level is crucial for a bullish outlook. A break below could signal a bearish trend and further downside potential which the break has occured.
Swing High (SH): The swing high at 6,020 serves as a reference point for potential resistance. Approaching this level again will be a key area for observing either a breakout or a reversal.
These technical signals are effective in predicting market movements as they reflect historical price action and trader behavior. However, they may fail due to unexpected news, economic events, or changes in market sentiment that can cause deviations from historical patterns.
In summary, the chart offers valuable insights into support and resistance levels, swing highs, and price movements, which are essential for making informed trading decisions in the forex market.

FIL/USDT Trading Scenario
From the beginning of November and throughout the month, FIL, driven by the overall positive market sentiment, demonstrated confident growth from $3.125 to $8.322, an increase of over 158%. This movement was accompanied by a rise in trading volumes.
Subsequently, a correction occurred, triggered by heightened volatility amid anticipation of the new U.S. president's inauguration, their statements, and the Federal Reserve's reaction to these events. As a result, the asset's price dropped to a mirror level that previously acted as resistance but now serves as support.
From a volume profile perspective, this level is confirmed by market participants' interest. In the near term, moderate volatility within this range can be expected, followed by a potential price reversal, a return to the local high, and its possible renewal.

Decoding Reversals: Technical Analysis of ONGC: Educational postEDUCATIONAL POST
Technical Analysis of ONGC Stock
This post is for educational purposes only and should not be considered as investment advice.
In this post, we'll analyze the ONGC stock chart using technical indicators.
Key Points:
1. Bullish Divergence: Price and MACD are diverging, indicating a potential reversal.
2. Bullish Divergence: Price and RSI are also diverging, supporting the reversal idea.
3. Resistance Breakout: The stock has broken through a key resistance level with strong volume.
4. MACD Turns Positive: MACD has turned positive after the breakout, confirming the reversal.
5. Elliott Wave Counts: Wave counts suggest a potential reversal.
What to Expect:
Based on these indicators, we can see a potential reversal in ONGC's stock price. It may retrace to Fibonacci levels (50-61.8%) before continuing upward.
Conclusion:
This post is meant to illustrate how technical indicators can be used to analyze a stock chart. Please do your own research and consult with a financial advisor before making any investment decisions.
I am not Sebi registered analyst.
My studies are for educational purpose only.
Please Consult your financial advisor before trading or investing.
I am not responsible for any kinds of your profits and your losses.
Most investors treat trading as a hobby because they have a full-time job doing something else.
However, If you treat trading like a business, it will pay you like a business.
If you treat like a hobby, hobbies don't pay, they cost you...!
Hope this post is helpful to community
Thanks
RK💕
Disclaimer and Risk Warning.
The analysis and discussion provided on in.tradingview.com is intended for educational purposes only and should not be relied upon for trading decisions. RK_Charts is not an investment adviser and the information provided here should not be taken as professional investment advice. Before buying or selling any investments, securities, or precious metals, it is recommended that you conduct your own due diligence. RK_Charts does not share in your profits and will not take responsibility for any losses you may incur. So Please Consult your financial advisor before trading or investing.

Technical Analysis of Coca-Cola (KO)The stock ( KO ) is currently in a retracement phase from its all-time highs reached in September 2024, having momentarily paused at previous relative highs.
Given Coca-Cola’s long-term uptrend, we can identify several key support levels where the retracement may halt and resume its upward trajectory:
SUP 1 : The first support area could be the current level, marked as SUP 1.
SUP 2 : The second area is around $64, labeled as SUP 2. Analyzing the Volume Profile, we notice significantly higher volume levels here.
POC : Just below SUP 2, we find the POC (Point of Control) area in the Volume Profile, located around $60.
SUP 3 : Another support level, marked as SUP 3, is around $57.
In the worst-case scenario, a drop down to SUP 3 would represent a drawdown of around 20%. Historically, Coca-Cola has seen similar drawdowns of 15%-20% and even as much as 40% at times.
The final potential support area is between $54-$53, corresponding to a secondary peak in the Volume Profile and an area where the stock has previously found resistance. This scenario would reflect a drawdown of about 30%
An additional note: the SUP 2 and POC levels align precisely with the 0.382 and 0.618 levels of the Fibonacci Retracement indicator.

BAL/USDT Trading ScenarioAfter reaching a local maximum in 2024 at a price of $6.192, the asset has since declined, hitting a low of $1.544, a drop of over 94%. Currently, the asset is trading near this minimum price. The volume profile in this price range indicates strong interest from market participants for accumulation.
Given this interest and the current market dynamics, there is a likelihood of continued short-term decline, which could trigger additional liquidation of weak positions and create more favorable conditions for further accumulation. This may lay the groundwork for recovery and potential growth of the asset as the market stabilizes and investor sentiment shifts.

BNB/USDT Trading Scenario UpdateAt the beginning of 2024, after a short-term accumulation phase, BNB showed a significant increase, reaching a local maximum of $723.5. This growth amounted to more than 140% from previous levels. Currently, the asset is in a prolonged accumulation phase, which has been ongoing since March until the present day.
From a volume profile perspective, the current price zone represents significant interest for market participants. It is also important to note the shift of significant volumes and the Point of Control from the $315 level to $584.
The shift of the POC to a higher level ($584) indicates that market participants are showing interest in buying at higher prices, which in turn could serve as a prerequisite for sustainable price growth in the future.
A breakout of the local maximum level at $723.5, followed by consolidation above, could open up the potential for further growth of BNB. If this resistance level is successfully overcome, the asset may enter a bullish trend phase with new price targets.
