DALBHARAT - Bullish Swing Reversal with VolumesNSE: DALBHARAT is closing with a bullish swing reversal candle supported with volumes.
Today's volumes and candlestick formation indicates strong demand and stock should move to previous swing highs in the coming days.
The stock has been consolidating for the past few days which is indicating demand.
One can look for a 8% to 12% gain on deployed capital in this swing trade.
The view is to be discarded in the event of the stock breaking previous swing low.
#NSEindia #Trading #StockMarketindia #Tradingview #SwingTrade
Disclaimer:
This is for educational purposes only.
Volumes

CERA - Bullish Consolidation with VolumesNSE: CERA is closing with a bullish consolidation candle supported with volumes.
Today's volumes and candlestick formation indicates strong demand and stock should move to previous swing highs in the coming days.
The stock has been consolidating for the past few days which is indicating demand.
One can look for a 8% to 11% gain on deployed capital in this swing trade.
The view is to be discarded in the event of the stock breaking previous swing low.
#NSEindia #Trading #StockMarketindia #Tradingview #SwingTrade
Disclaimer:
This is for educational purposes only.

ESABINDIA - Bullish Swing ReversalNSE: ESABINDIA is closing with a bullish reversal candle supported with volumes.
Today's volumes and candlestick formation indicates strong demand and stock should move to previous swing highs in the coming days.
The stock has been consolidating for the past few days which is indicating demand.
One can look for a 8% to 11% gain on deployed capital in this swing trade.
The view is to be discarded in the event of the stock breaking previous swing low.
#NSEindia #Trading #StockMarketindia #Tradingview #SwingTrade
Disclaimer:
This is for educational purposes only.

GSPL - Bullish Consolidation with VolumesNSE: GSPL is closing with a bullish consolidation candle supported with volumes.
Today's volumes and candlestick formation indicates strong demand and stock should move to previous swing highs in the coming days.
The stock has been consolidating for the past few days which is indicating demand.
One can look for a 8% to 12% gain on deployed capital in this swing trade.
The view is to be discarded in the event of the stock breaking previous swing low.
#NSEindia #Trading #StockMarketindia #Tradingview #SwingTrade
Disclaimer:
This is for educational purposes only.

AETHER - Swing Reversal supported with VolumesNSE: AETHER is closing with a bullish swing reversal candle supported with volumes.
Today's volumes and candlestick formation indicates strong demand and stock should move to previous swing highs in the coming days.
The stock has been consolidating for the past few days which is indicating demand.
One can look for a 8% to 11% gain on deployed capital in this swing trade.
The view is to be discarded in the event of the stock breaking previous swing low.
#NSEindia #Trading #StockMarketindia #Tradingview #SwingTrade
Disclaimer:
This is for educational purposes only.

RCF - Bullish Swing ReversalNSE: RCF is closing with a bullish swing reversal candle supported with volumes.
Today's volumes and candlestick formation indicates strong demand and stock should move to previous swing highs in the coming days.
The stock has been consolidating for the past few days which is indicating demand.
One can look for a 8% to 11% gain on deployed capital in this swing trade.
The view is to be discarded in the event of the stock breaking previous swing low.
#NSEindia #Trading #StockMarketindia #Tradingview #SwingTrade
Disclaimer:
This is for educational purposes only.

SIYSIL - Bullish Reversal with VolumesNSE: SIYSIL is closing with a bullish reversal candle supported with volumes.
Today's volumes and candlestick formation indicates strong demand and stock should move to previous swing highs in the coming days.
The stock has been consolidating for the past few days which is indicating demand.
One can look for a 8% to 13% gain on deployed capital in this swing trade.
The view is to be discarded in the event of the stock breaking previous swing low.
#NSEindia #Trading #StockMarketindia #Tradingview #SwingTrade
Disclaimer:
This is for educational purposes only.

RAIN - Bullish Swing Reversal with VolumesNSE: RAIN is closing with a bullish candle supported with volumes.
Today's volumes and candlestick formation indicates strong demand and stock should move to previous swing highs in the coming days.
The stock has been consolidating for the past few days which is indicating demand.
One can look for a 8% to 13% gain on deployed capital in this swing trade.
The view is to be discarded in the event of the stock breaking previous swing low.
#NSEindia #Trading #StockMarketindia #Tradingview #SwingTrade
Disclaimer:
This is for educational purposes only.

ITI - Bullish Swing Reversal with VolumesNSE: ITI is closing with a bullish candle supported with volumes.
Today's volumes and candlestick formation indicates strong demand and stock should move to previous swing highs in the coming days.
The stock has been consolidating for the past few days which is indicating demand.
One can look for a 8% to 13% gain on deployed capital in this swing trade.
The view is to be discarded in the event of the stock breaking previous swing low.
#NSEindia #Trading #StockMarketindia #Tradingview #SwingTrade
Disclaimer:
This is for educational purposes only.

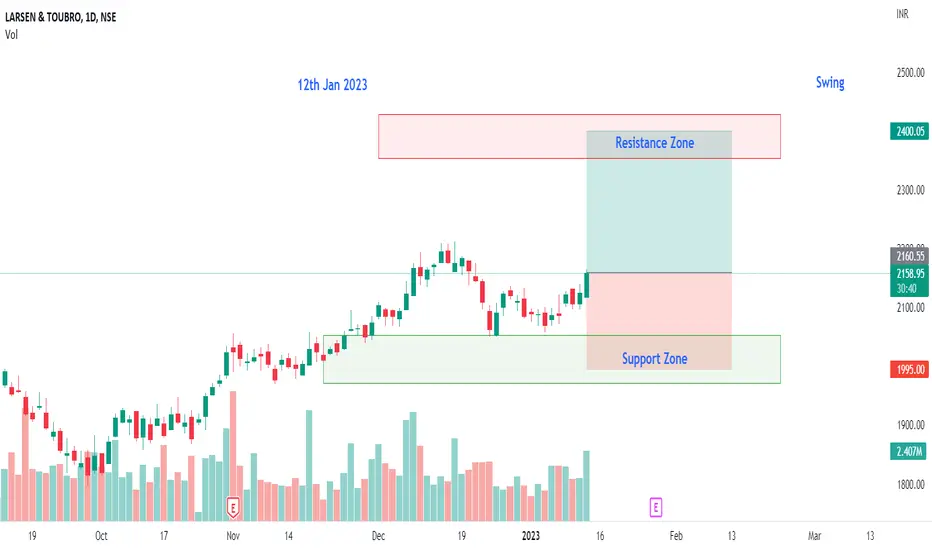
LT - Bullish Swing ReversalNSE: LT is closing with a bullish candle supported with volumes.
Today's volumes and candlestick formation indicates strong demand and stock should move to previous swing highs in the coming days.
The stock has been consolidating for the past few days which is indicating demand.
One can look for a 8% to 11% gain on deployed capital in this swing trade.
The view is to be discarded in the event of the stock breaking previous swing low.
#NSEindia #Trading #StockMarketindia #Tradingview #SwingTrade
Disclaimer:
This is for educational purposes only.
EDELWEISS - Bullish Consolidation BreakoutNSE: EDELWEISS is closing with a bullish candle supported with volumes.
Today's volumes and candlestick formation indicates strong demand and stock should move to previous swing highs in the coming days.
The stock has been consolidating for the past few days which is indicating demand.
One can look for a 8% to 12% gain on deployed capital in this swing trade.
The view is to be discarded in the event of the stock breaking previous swing low.
#NSEindia #Trading #StockMarketindia #Tradingview #SwingTrade
Disclaimer:
This is for educational purposes only.

💎 Analyzing the Various Shapes of Volume ProfilesVolume Profile is a tool that shows how much volume (i.e. the number of trades) is happening at different price levels for a given asset.
It is used by traders to analyze order flow and make inferences about market direction, support and resistance, and potential reversal areas.
The patterns in a Volume Profile may appear random at first glance, but there are certain recurring shapes that can be used to make predictions about the market.
🔵 P-Shaped Volume Profile
A P-shaped Volume Profile is a chart pattern that typically occurs when a market experiences a sharp rise followed by consolidation.
The lower part of the P-shaped profile represents low volume rejection, while the wider upper part shows an increase in trading activity at a "fair" price.
These patterns are often seen during uptrends, but can also indicate the end of a downtrend and a potential short covering rally, which is seen as a bullish signal.
🔵 b-Shaped Volume Profile
A b-shaped Volume Profile is a chart pattern that forms when a market experiences a sharp decline followed by consolidation.
It is the opposite of a P-shaped profile and is often seen during downtrends. The upper part of a b-shaped profile represents low volume and an "unfair" perception of price,
while the wider bottom part shows an increase in trading activity and a balance between buyers and sellers.
If a b-shaped profile appears during an uptrend, it could potentially indicate a reversal. These patterns are generally seen as bearish signals, as they often represent longs exiting the market.
🔵 D-Shaped Volume Profile
A D-shaped Volume Profile is a chart pattern that occurs when there is a temporary balance in a market. The Point of Control (POC), which is typically located in the center of the profile,
indicates an equal number of buyers and sellers. Some traders view a D-shaped profile as a sign of a choppy or sideways market without a clear direction,
while others see it as an opportunity to anticipate a potential breakout in either direction as institutional players build up their positions.
🔵 B-Shaped Volume Profile
A B-shaped Volume Profile is a chart pattern that occurs when two D-shaped profiles appear within a specific time period. It is characterized by a single value area and Point of Control (POC),
although some traders may divide the profile into two separate "D-areas" with their own value areas. B-shaped profiles are generally seen as a continuation of a trend,
but it is important to note which POC is more dominant, as this can indicate whether activity was highest at the top or bottom of the profile.
👤 @algobuddy
📅 Daily Ideas about market update, psychology & indicators
❤️ If you appreciate our work , Please like, comment and follow ❤️

Downtrend. Breaking through the level on higher volumesThe general trend is downward. The coin formed a horizontal level of 9.10, confirmed by several touches. At the increased volume, the instrument broke through the support level in the downward direction. I expect the continuation of the downward movement with the support of volumes in the seller's glass and the movement of the instrument to the lower support levels.

Large limit order. Rebound from the zoneThe graph shows the area of buyers from which there was previously a good reaction. Considering the rebound from the zone with targets of 1%-2% of the price movement. In the spot order bok there is a large limit order from which I plan to type.

Bull pattern. Triangle breakdownOn the graph we can see how the bullish pennant pattern was formed. I expect a breakdown of the upper boundary and growth to the nearest resistance level of 3.58-3.6$

SOL is still retracing support.Today's Solana price analysis is pessimistic.
The most resistance is found at $14.57.
At the time of writing, SOL was trading at $12.31.
Solana's price analysis for December 17, 2022, suggests that the market is completely bearish; however, Solana has achieved enormous negative momentum, indicating a decrease in the SOL market. Solana's pricing has stayed negative in recent hours. Today, the price dropped from $13.06 to $11.94. However, the market began to rise in value again soon after, since the cryptocurrency had already gained more of its value. Furthermore, Solana has surged to $12.31, barely shy of the $12.50 level.
Solana's current price is $12.31, with a trading volume of $383,744,102. Solana has been taken ill. This gives us 8.37% in the last 24 hours. Solana currently ranks at #15 with a live market cap of $4,510,324,801.

The price has formed a triangle. Good entry pointThe asset is traded on volumes. The price has formed a triangle, a situation for the continuation of the movement. Fixed below the volumetric level of POC. The market is negative. I expect a fall, the target is 0.2809$

📊How to use HORIZONTAL VOLUMES? Tutorial with examples!Horizontal Volume Indicator or Volume Profile is a simple indicator that helps to identify: value areas (support or resistance zones) and liquidity gaps. In this idea I will explain how to use the indicator and mark these areas to make trades and why it works.
Let's start at the beginning.
💹What are value areas (support and resistance zones)?
🔶The value zone is the price range at which the most trades are made. On the chart we can mark the value zones: 33600-41000, 46000-49500, 54600-58200. I also marked how these zones were support or resistance to price. The value zone becomes a support for price if the price, when it is tested, does not continue its downward movement. A value zone becomes a resistance if price does not continue to rise above that zone. The zone simply doesn't let the price go higher because there aren't enough buyers.
🔶Liquidity gaps are called that way because no trades were made in that zone and there is no liquidity for traders (buyers or sellers), and price, as we know, goes from liquidity to liquidity (from one zone to another). On the chart I have marked for you the liquidity gaps and we can see that the price can' t stay in these zones for a long time.
✅Why do horizontal volumes work? Price reacts to these zones for a simple reason. Many traders pay attention to these areas and put their limit orders to buy or sell or when the area is tested, so the price moves up or down. If there are more sellers than buyers, the price will go lower and lower ; if there are more buyers, the price goes higher and higher.
🚩How can I add this indicator to my chart?
3 steps to add the indicator to your chart:
1. open "prediction and measurement tools" at the left part of chart
2. choose the "Fixed Range Volume Profile"
3. choose the price range from some date till another date. I chose from Dec 10, 2021 till May 6, 2022.
So now you can see and mark all areas on your chart.
🏁This indicator helps to identify areas and can suggest stop points or price reversal, but it should be used with different methods. If the market is in a strong rising trend (UPTREND), it is unlikely to be stopped by a local zone of value, but a global zone may stop it. Also, the support zones can be good entry point. Be more tricky than the market and use different tools. You can use the indicator on different timeframes for scalping or swing trading and with different ALTCOINS. Also, pay attention to the volume indicator, trend lines and key levels that I show in my ideas.
💻Please write in the comments if you still have questions about Horizontal volumes! I`ll try to explain you additional tips 🎇
Press the "like"👍 button, write comments and share with your friends - it will be the best THANK YOU.
P.S. Personally, I open an entry if the price shows it according to my strategy.
Always do your analysis before making a trade.

Technical analysis for Bitcoin (BTC)BTC. Positive angle and quite neutral news background facilitated the recovery of the instrument to capture above 17400. Volumes are higher than average and the activity is rising to break the level. Watch the activity on the level.

For BTC, trading volumes increase locally. Get ready to buy15m TF. For BTC, trading volumes increase locally, the limit buyer pushes the price to update the highs. A cascade of local highs has been formed, beyond which there is liquidity. I am waiting for the formation of trading and impulse exit to the long in order to withdraw liquidity behind the level.

BILI - will the next break up succeed?Chinese stocks have been on a roll recently due to a combination of factors:
1. the potential easing of their zero-covid policy
2. hope that the tensions between US and China could be thawing after the recentG20 summit
3. very attractive valuations
Preferably we wait for a breakup and a retest back towards the neckline and with higher lows in place.
Disclaimer: Just my 2 cents and not a trade advice. Kindly do your own due diligence and trade according to your own risk tolerance and don't forget that money management is important! Take care and Good Luck!

The coin is traded on volumes. Support for the POC volumes levelThe price broke through the inclined level and fixed higher. The coin is traded on volumes. After the impulse, we returned to the retest. At the bottom there is support for the POC level, stop for the level. I recommend entering the position from $ 4.723. First goal - 4.85$

🔥 ARUSDT Primed for LONG on DAILY TF ✅Daily Time Frame:
1. Strong Bullish Candle Close and Lagging Span have crossed up Ichimoku Cloud
2. Ichimoku Cloud has printed green (look right)
3. Conversion Line has crossed up Base Line
4. 9 and 21 EMA have crossed up 55 EMA
5. Absurd Volume on Breakout (look left)
6. Buy Signals have been printed on various indicators since Oct 11
Entry: ~$14/wanna take a chance on a pullback which might never happen ~$10~$12) = Strong Demand/Support Zone, Even Number
TP: ~$40 = April High, Even Number, Strong Supply/Resistance Zone
SL: ~$8.2 = some pips below previous swing low/if you really believe in this coin ~$6.99 (some pips below ATL)/DCA for HODLING
Cross 25x
1:4 R:R
!! NOT A FINANCIAL ADVICE !!
