NFLX builds more momentum LONG for nowNFLX has been trending up for three weeks. If the trend is getting old it is now showing.
Based on a set of two anchored VWAP bands originating June 1 and June 15, Netflix is
breaking through VWAP bands from the lower -2 standard deviation lines to the +2 standard
deviation lines and nearly the third upper deviation lines. This is a clear and convincing
VWAP breakout with buyers in overwhelming control Trading volume today is about 4 or 5
times the running average and about 1M. Volume support for price action is obvious.
The dual time frame RSI shows 1 hr TF RSI (blue line) shot up crossed over the daily TF RSI
(black line) and is retreating a bit. The daily RS is below 80 and still trending up.
The MACD shows a classical bullish momentum pattern with the lines well above the histograms.
Overall NFLX has the risk of overextension and possible topping with a fade afterwards.
The mass index indicator shows a value into the reversal zone but until the value rises and the
drops to 26.5, the trend is still intact. I will take a long trade here, hoping for a quick
5% ROI between now and the end of the week and about 50% on an options trade with
a strike of $500 expiring July 28th which I will close upon a confirmed reversal and use
the profits realized therefrom to buy a put option to take a ride down.
Volumespike

NQ Power Range Report with FIB Ext - 5/30/2023 SessionCME_MINI:NQM2023
- PR High: 14409.50
- PR Low: 14391.75
- NZ Spread: 39.75
Extremely high volume coming off the holiday close.
- Holding the new daily highs off Friday's strong close.
CB Consumer Confidence report at 10:00.
Evening Stats (As of 1:25 AM)
- Weekend Gap: +0.50% (filled)
- Session Open ATR: 210.70
- Volume: 112K
- Open Int: 284K
- Trend Grade: Neutral
- From ATH: -14.2% (Rounded)
Key Levels (Rounded - Think of these as ranges)
- Long: 14675
- Mid: 14103
- Short: 31531
Keep in mind this is not speculation or a prediction. Only a report of the Power Range with Fib extensions for target hunting. Do your DD! You determine your risk tolerance. You are fully capable of making your own decisions.

CAn RDFN ( RedFin) Maintain its Post Earnings High ?RDFN jumped with a 30% + pop from very favorable earnings with a volume spike
Can it hold the price in the sessions of next week or will in bounce down
from the supply /resistance zone charted by the LuxAlgo indicator. What
are the probabilities? Long or short? What do you think? Is this a drop about to
drop or can the momentum catch a breath and run hard again?

VAXX Biotech Penny Stock Earnings Play VAXX is a speculative penny biotechnology NASDAQ stock with high volatility. On the 2H chart, it is currently trending up from a swing low
on April 25 with earnings to be reported Monday 5/8. May's relative volume compared with that of April is about 2-3X higher. To confirm
the bullish bias, VAXX is currently trading above its intermediate-term POC line on the volume profile. This confirms buyers as being in
control. Although this is speculative as are all biotechnology penny stocks, impending earnings as a catalyst has been considered.
Continued development in the vaccine subsector at large may suggest VAXX may have a favorable report to fuel further price action.

IMGN Biotech Post Earnings IMGN had great earnings the last days of April and has been trending up ever since.
It is riding the upper Bollinger band consistently in this past wee. The volume spike
after earnings has subsided but ongoing volume is at about 5X the moving average of
early April and March. Increased volume supports price momentum. The volume spike
here is obvious and significant.
IMGN announced a public offering. I see this as a positive. It is primed for increasing
growth but needs the fuel. Interest rates are high. Stock offering will raise cash
and all shareholders will be rewarded. IMGN is resting and consolidated in a narrow
range during this public offering. See also the favorable article from IBD linked below.
I see IMGN as a solid swing long until the next earnings. I will watch for an uncoiling
upon completion of the offering with resumption of momentum moving forward.

FAZ Bear Leveraged Financial Economy ETF LongAs the fed raises rates to try to throttled down inflation, the economy and the financial sector
suffer. FAZ got its catalyst today in the federal news. It is a bearish fund that will go up
while the FAS ETF will go down.
On the 2-hour chart, the price can be seen rising to crossover the VWAP anchored a month back.
It is nearly crossing over the POC line of the intermediate-term volume profile.
These are both bullish moves confirmed by a dramatic increase in trading volumes perhaps
4-5X of the moving average volume.
The overall picture is a long trade setup either with stock or strategic but more risky
call options which could 10X.

TNYA Biotechology Penny NASDAQ LONGTNYA has been in consolidation the past two days being in the flag of
a bull flag pattern on the 1H chart. Earnings about six weeks ago were
solid especially for a biotechnology stock which are generally priced
based on future potential and not current performance.
( Fundamentally TNYA is in the gene splicing /slicing place which is
perhaps the most lucrative and therapeutic of all of the various
areas in the biotechnology realm. Seemingly, its potential is
expodentially high. )
The zero lag MACD lines have crossed under the histogram which in
general can be considered as a buy signal. The histogram has flipped to
positive.
Upside to the overhead resistance zone by the Luxalgo indicator
is from an entry of about 5 to 6 or about 20%.
Very recent high relative volume as compared with
the 50 day moving average further supports a long trade at this
time. The stop loss would be $.02 below the POC line of the
volume profile.
I will play this with options to further leverage the price action.
Both options and stock are inexpensive for a small account.

MGRX Biotech Penny Stock Pullback for Continuation LONGMGRX with some FDA news catalyst got a lot of action on the last session of the week.
With the pullback and overwhelming volume during the session, a continuation into
the upcoming week is entirely reasonable. ( see also the link)
MGRX had a last price of about $1.50 about a 50% retracement from the high of the day.
I will take a position at market price in the pre-market opening the week. The
target will be $2.25 or midway between the current price and the high of the last session.
This will represent a 50% Return on Trading Position. I will set a stop loss at $ 1.40
representing a 10% loss. Price at present is sitting on a confluence of support of
both the 20 and 50 HMAs along with the lowermost VWAP band. The reward for risk is 5X.
MGRX does not have options. I expect the long trade to hit the continuation target
in less than 5 days. I will set a buy-stop order to take a position when the price exceeds
$ 1.55 with a stop loss of $0.15 to account for the expected volatility.

FLUOROCHEM - Bullish Momentum with Volume SpikeNSE: FLUOROCHEM is closing with a bullish momentum candle supported with volumes.
Today's volumes and candlestick formation indicates strong demand and stock should move to previous swing highs in the coming days.
The stock has been moving along the horizontal support for the past few days which is indicating demand.
One can look for a 8% to 12% gain on deployed capital in this swing trade.
The view is to be discarded in the event of the stock breaking previous swing low.
#NSEindia #Trading #StockMarketindia #Tradingview #SwingTrade
Disclaimer:
This is for educational purposes only.

📊The Effects of Volume Cheatsheet📍 In trading, volume refers to the number of shares or contracts that are traded within a specific period of time. It is a key technical indicator used by traders and investors to analyze the strength and direction of price movements in the financial markets.
The volume of a security can be used to confirm trends, indicate potential reversals, and identify areas of support and resistance. For example, a sudden increase in trading volume for a particular stock may suggest that a significant news event has occurred or that there is an increase in investor interest. On the other hand, a decrease in volume may indicate that investors are losing interest or that a trend is weakening.
Volume is important in trading because it provides information about market activity and helps traders make informed decisions. By analyzing trading volume along with other technical indicators such as moving averages and price patterns, traders can gain insights into market trends and make more accurate predictions about future price movements.
💥Key Takeaway:
When prices are rising or falling with high volume , it suggests that there is strong participation in the market and that the price movement is likely to continue in that direction . Conversely, when prices are rising or falling with low volume, it may indicate that there is not enough market participation to sustain the price movement and that a reversal could occur.
👤 @AlgoBuddy
📅 Daily Ideas about market update, psychology & indicators
❤️ If you appreciate our work, please like, comment and follow ❤️

WSC - WillScot Mobile Mini HoldingsSimple base breakout accompanied by a surge in volume, albeit not a massive surge. Would like to see continued volume surges to get a cushion to allow for a hold thru earnings on 2/21.
Great growth numbers, earnings & sales accelerating at a strong pace on a YoY & QoQ basis.

ALLCARGO - Bullish Swing Reversal with VolumesNSE: ALLCARGO is closing with a bullish swing reversal candle supported with volumes.
Today's volumes and candlestick formation indicates strong demand and stock should move to previous swing highs in the coming days.
The stock has been consolidating for the past few days which is indicating demand.
One can look for a 8% to 12% gain on deployed capital in this swing trade.
The view is to be discarded in the event of the stock breaking previous swing low.
#NSEindia #Trading #StockMarketindia #Tradingview #SwingTrade
Disclaimer:
This is for educational purposes only.

YFUUSDT - Long by Moving average & Volume 1/14/2023- Market long when eMA20 > eMA50.
- Open a buy at green candle with volume > 4 times volume average 20.

Renko: SweetSweetLuciaThis indicator is good, it can be utilized for timing entries and exits.
The Cross symbol, is the opening (Bearish or Bullish).
The Square symbol, is a pivot crossing (Bearish or Bullish).
The moving averages, aide the price wave identification.
The settings for Renko:
Seven Bars: a recent wave count with a line graph, on Bollinger Band breaches.
Traditional: seems more responsive.
OHLC: to include inside bars.

SAFARI - Bullish Reversal BreakoutNSE: SAFARI is closing with a bullish candle supported with volumes.
Today's volumes and candlestick formation indicates strong demand and stock should move to previous swing highs in the coming days.
The stock has been consolidating for the past few days which is indicating demand.
One can look for a 8% to 11% gain on deployed capital in this swing trade.
The view is to be discarded in the event of the stock breaking previous swing low.
#NSEindia #Trading #StockMarketindia #Tradingview #SwingTrade
Disclaimer:
This is for educational purposes only.

ASTRAL - Bullish Candle with VolumesNSE: ASTRAL is closing with a bullish candle supported with volumes.
Today's volumes and candlestick formation indicates strong demand and stock should move to previous swing highs in the coming days.
The stock has been consolidating for the past few days which is indicating demand.
One can look for a 8% to 11% gain on deployed capital in this swing trade.
The view is to be discarded in the event of the stock breaking previous swing low.
#NSEindia #Trading #StockMarketindia #Tradingview #SwingTrade
Disclaimer:
This is for educational purposes only.

MFSL - Bullish Swing ReversalNSE: MFSL is closing with a bullish candle supported with volumes.
Today's volumes and candlestick formation indicates strong demand and stock should move to previous swing highs in the coming days.
The stock has been consolidating for the past few days which is indicating demand.
One can look for a 8% to 13% gain on deployed capital in this swing trade.
The view is to be discarded in the event of the stock breaking previous swing low.
#NSEindia #Trading #StockMarketindia #Tradingview #SwingTrade

TATACOMM - Spinning Top with Volume SpikeNSE: TATACOMM is closing with a spinning top candle supported with high volumes
Today's volumes and candlestick formation indicates strong demand and stock should move to previous swing highs in the coming days.
The stock has been consolidating for the past few days which is indicating demand.
One can look for a 8% to 11% gain on deployed capital in this swing trade.
The view is to be discarded in the event of the stock breaking previous swing low.
#NSEindia #Trading #StockMarketindia #Tradingview #SwingTrade

IBULHSGFIN - Bullish Consolidation with VolumesNSE: IBULHSGFIN is closing with a strong bullish consolidation candle supported with volumes
Today's volumes and candlestick formation indicates strong demand and stock should move to previous swing highs in the coming days.
The stock has been consolidating for the past few days which is indicating demand.
One can look for a 8% to 11% gain on deployed capital in this swing trade.
The view is to be discarded in the event of the stock breaking previous swing low.
#NSEindia #Trading #StockMarketindia #Tradingview #SwingTrade

INDIGO - Bullish Consolidation with VolumesNSE: INDIGO is closing with a strong bullish consolidation candle supported with volumes
Today's volumes and candlestick formation indicates strong demand and stock should move to previous swing highs in the coming days.
The stock has been consolidating for the past few days which is indicating demand.
One can look for a 8% to 11% gain on deployed capital in this swing trade.
The view is to be discarded in the event of the stock breaking previous swing low.
#NSEindia #Trading #StockMarketindia #Tradingview #SwingTrade
Disclaimer:
This is for educational purposes only.

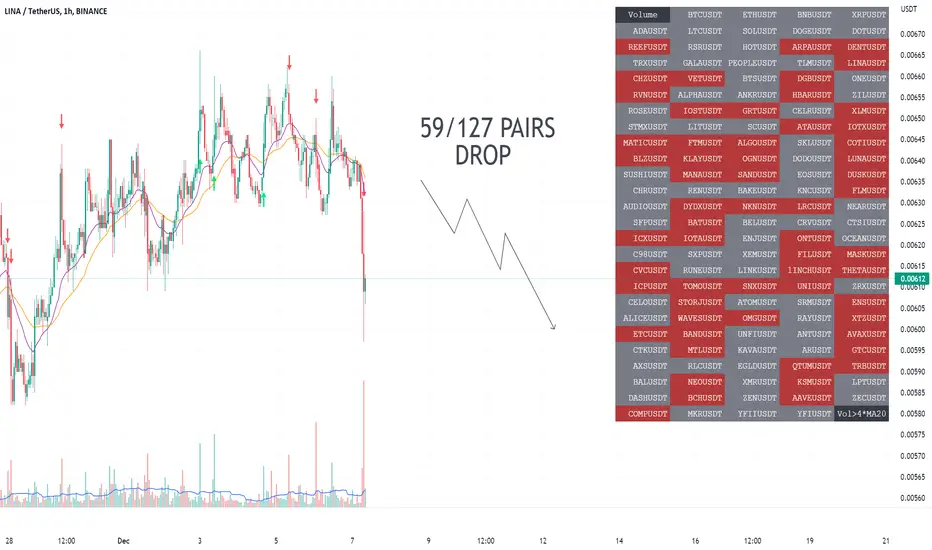
59/127 pairs drops at once- Volume spike indicator detects to 127 pairs of Binance Future:
>>> 59/127 pairs drop at once with current volume > 4 times volume moving average (20).
AUDIOUSDT - Long by Volume & 2MAs 5/12/2022- Long trend when Moving Average (20) > (50) & the green candle has volume > 4 times of Volume moving average (20)
>>> Buy limit is at 50% of the green candle.

HEROMOTOCO - Bullish Consolidation BreakoutNSE: HEROMOTOCO is closing with a strong bullish consolidation breakout candle supported with volumes
Today's volumes and candlestick formation indicates strong demand and stock should move to previous swing highs in the coming days.
The stock has been consolidating for the past few days which is indicating demand.
One can look for a 8% to 12% gain on deployed capital in this swing trade.
The view is to be discarded in the event of the stock breaking previous swing low.
#NSEindia #Trading #StockMarketindia #Tradingview #SwingTrade
Disclaimer:
This is for educational purposes only.
