The same view as beforeDominance currencies will face a sharp and rapid decline in the coming period, and it will be the last to build a bottom on which to base the rise that follows for a long period.
Clarification: Currency Dominance is an indicator that shows the percentage of currencies’ acquisition of liquidity in the crypto market and indicates the rise or fall of currencies as a general indicator.
Please clarify that I am helping you with my point of view, which may be right or wrong, and see my previous analyzes of many currencies and forex in order to judge the owner of this analysis with a more accurate look
Good luck
Volumespreadanalysis

Dont Bet Against Tesla while Bullish Strength ExistsHi guys. This is a Technical Analysis on Tesla (TSLA) on the 3 Day chart.
BRUH.......I was aspecting prices to be around the FIB retracement levels i pointed out in my previous ideas (200-220 range) a little longer. Though its still possible we can retrace back down from this current area. BUT Some bullish signs exist, therefore in my opinion we are Bullish until Proven Otherwise.
Jumping in, our current move is fueled by our Major bounce from a Critical Confluence of Supports.
We have the RED ZONE
We have the Black trendline
We have the 50 SMA
We are also ABOVE the 21 EMA, which when support is Confirmed it indicated UPTRENDS. As long as we respect the 21 EMA and stay above it.
Volume is picking up as well. WHich is also indicative of the current move. To break ABOVE resistance lines, we need to continue to see VOLUME increase.
MACD is also showing signs of waning Bearish Momentum, with Light Red histobar prints and flattening of the Blue line.
We need to avoid printing a Dark Red Bar. Instead see print of Green bars with a Bullish Cross.
RSI is also getting close to testing the Black moving average i have added. The way i use this is: Usually if RSI is ABOVE the Moving AVerage, it signifies UPtrends.
But do note: This current candle closes on the 8th of September.
And note that we are hitting some Major Resistance Area. There is always a risk of sell off. BUt as long as we continue the current trends in volume, stay above the moving averages, and maintain patterns in indicators Uptrend will continue.
__________________________________________________________________________________
Thank you for taking the time to read my analysis. Hope it helped keep you informed. Please do support my ideas by boosting, following me and commenting. Thanks again.
Stay tuned for more updates on TSLA in the near future.
If you have any questions, do reach out. Thank you again.
DISCLAIMER: This is not financial advice, i am not a financial advisor. The thoughts expressed in the posts are my opinion and for educational purposes. Do not use my ideas for the basis of your trading strategy, make sure to work out your own strategy and when trading always spend majority of your time on risk management strategy.

The Volume Trick: A Bullish Mirage 📈Trading cryptocurrencies often requires deciphering the subtle cues that the market offers. One such phenomenon is the apparent decrease in trading volume while prices continue to climb. While this may seem like weakness, it can, in fact, be a trap for shorts and a strong bullish signal. Let's dive into this intriguing market dynamic.
Understanding the Volume Puzzle:
Trading volume typically reflects market participation and strength.
A decrease in volume might suggest waning interest or weakening momentum.
The Deceptive Setup:
Sometimes, as prices rise, trading volume shrinks, creating the illusion of market fatigue.
This scenario may lead short-sellers to believe the market is losing steam.
The Reality:
Contrary to appearances, this setup often serves as a trap for shorts.
It may signify that long-term holders are not rushing to sell, indicating strong hands.
The Bullish Implication:
A market that can sustain or increase prices with lower volume is demonstrating resilience.
This can be a precursor to a significant bullish move.
Trading Strategy: Navigating the Volume Mirage
Traders should exercise caution when interpreting volume patterns.
A decrease in volume amid a price rise should not be automatically seen as bearish.
Risk management remains vital, as markets can be unpredictable.
Conclusion: The Volume Illusion
Recognizing the subtleties of trading volume can provide valuable insights into market dynamics. When volume decreases but prices continue to rise, it often confounds short-sellers and sets the stage for a bullish surge.
Remember that trading is both an art and a science, and making informed decisions is key in the crypto landscape. Stay vigilant, adapt to changing conditions, and, above all, trade wisely.
As we navigate the complexities of the crypto market, let's keep an eye out for these volume tricks that may just be a prelude to a bullish rally. 📊🚀🌐
❗See related ideas below❗
Don't forget to like, share, and leave your thoughts in the comments! 💚🚀💚

Oversold RSI a sign of gold upside to come ?XAU/USD FUNDAMENTAL BACKDROP
Gold prices are trading lower for the 8th consecutive trading day as the US dollar remains bid due to some hawkish Fed commentary as well as an upside surprise on yesterday’s US JOLTs job openings statistic. Once again US labor market strength has been reiterated through jobs reports and will surely add pressure from a hawkish perspective. Throughout the week including today (see economic calendar below), markets will be looking to jobs reports beginning with ADP employment change, jobless claims and most importantly Friday’s Non-Farm Payroll (NFP) print. If the JOLTs job openings trend continues, gold prices may breakdown further.
1803 AREA IS A STRONG SUPPORT
Buy @ 1803 SL @ 1875
TP @ 1932 TP @ 1950

Is there another drop left?hree historical downward waves were made, and when they were completed, the price did not rise, but rather wanted to go sideways for a large distance and time, and this may indicate that the probability of the discharge is high, and the three downward waves become only one wave, and the sideways trend is a second wave, and there remains a final strong bearish third wave.
NB. The analysis fails when the price closes the highest area 9.6 usdt

TSLAIt is expected to drop to the first shaded area, from which we will see whether it is satisfied or wants to fall to the second shaded area as a second support

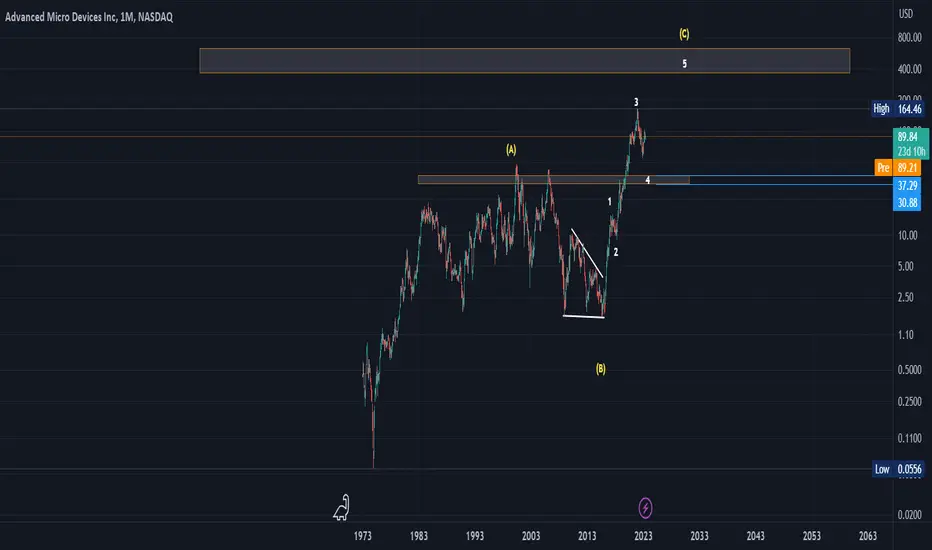
Pay attention to the next dropThe historical rise has been a compound rise, not an impulse. This indicates that all this rise is nothing but a correction, and it represents 61% Fibo of the length of the previous downward wave.. It is expected for it to drop to the shaded area in order to end the historical correction of the currency.

Trader's Guide: Volume Range Profile 📊Welcome, traders! In this guide, we'll explore a tool that can significantly enhance your trading skills - the Volume Range Profile. You'll learn how to use it to identify key support and resistance levels, trend reversals, and execute successful trades. 📊💹
Key Learning Points:
Understanding Volume Range Profile:
The Volume Range Profile is a tool that displays trading volumes at various price ranges.
It helps identify where the market has the highest volume and where key support and resistance levels are formed.
Volume Analysis:
The first step in using Volume Range Profile effectively is to analyze the volume data.
Look for price areas with significant spikes in volume as these often indicate areas of interest to traders.
Identifying Key Levels:
Using Volume Range Profile, you can identify the Point of Control (POC), which is the price level with the highest volume.
Additionally, you can spot the Value Area High (VAH) and Value Area Low (VAL), which represent price ranges where the majority of trading activity occurs.
Support and Resistance Levels:
The POC, VAH, and VAL can serve as dynamic support and resistance levels.
When the price approaches these levels, it's essential to watch for potential reversals or breakouts.
Trading Strategies:
Volume Range Profile can be used in various trading strategies, including range trading, breakout trading, and trend confirmation.
For example, a breakout above the VAH may indicate a bullish move, while a breakdown below the VAL could signal a bearish trend.
Risk Management:
Always implement proper risk management strategies in your trades.
Consider placing stop-loss orders below support levels and take-profit orders near resistance levels identified using the Volume Range Profile.
Continuous Learning:
Practice using the Volume Range Profile in different market conditions to enhance your skills.
Stay updated with market news and trends to adapt your trading strategies accordingly.
By incorporating Volume Range Profile analysis into your trading routine, you can gain valuable insights into market sentiment and make more informed trading decisions. Happy trading! 🚀📊

Bitcoin downFrom the first look, and according to the Elliott rules, Bitcoin rose from the bottom in three waves, not five waves. This is a corrective rise, not a motive, and it is supposed to visit the bottom again.
All data has been shown on the chart and based on Elliott rules
Note: The analysis fails if it closes above the C region, which is $32000
Please clarify that I am helping you with my point of view, which may be right or wrong, and see my previous analyzes of many currencies and forex in order to judge the owner of this analysis with a more accurate look
Good luck

Another drop is comingIt is possible that a final, five downward wave will take place, and thus the historical decline of the currency will end and a major corrective rise will begin for it
Note: The analysis fails if it closes over an area 8.3 usdt

HBarusdtIt is possible that wave C and there are five downward waves, and its historical decline ends in the shaded area

🔥 The Calm Before the Storm: Bitcoin's Volatility AnalyzedIn our latest analysis, we explore Bitcoin's unfolding volatility patterns. Notably, the bottom indicator highlights a distinct drop in Bitcoin's 7-day volatility, as depicted by the green metric.
Historical data consistently suggests that such low volatility precedes significant market movement. While periods of low volatility can span weeks, they invariably culminate in a pronounced shift.
Previously, I discussed Bitcoin's volatility and predicted a potential downturn risk. My perspective remains unchanged. Given that September traditionally presents challenges for crypto performance, and considering the precedent set by pre-halving years exhibiting roughly 50% bullishness (a trend we observed at the year's start), there's a strong inclination toward upcoming bearish trends.
Although positive ETF news might temporarily boost the market, a surge in selling is anticipated in the near future.
If you wish to use this indicator yourself, check out this link below:
Which direction do you think that the market will go? Share in the comments 🙏

XAGUSDThe corrective rise is about to end and it will return again to the decline, and it will be a support area. It will fall. It will test the first area, and we will see if it is satisfied with this, or does it need to break it and go down to the second support?

The last wave to riseWe are in the last wave of the rise that can be extended because it touches the previous peak, and then the correction begins, so let us wait and see what will happen.

TWTUSDTIt is possible that it will remain a final upward wave for it to complete the last sub-wave before the start of a large decline for the shaded areas

Retest previous resistanceThe price is bullish in an impulse wave, and it is currently retesting the previous peak, and then rising again to make a new peak for the shaded area
Leading Daegonol was formedFive overlapping waves were formed in the form of Leading Degnol, and this comes at the end of the ascent

ankrusdtIt is possible that a five-way decline will be implemented in order to complete the C-wave and end the historical drop in the currency, so let's see what will happen

forming a bearish pattern?It is highly likely that an Ending Diagonal pattern has been formed, and this is a pattern that enters the end of an ascending wave and the beginning of a large bearish wave, which will be a C wave.
Note: The model fails by breaking 350 usdt its top and closing

ELF - longer-term uptrend still intactELF has been one of the strong trending stocks since it broke above its 200 day moving average in Jun 2022. Despite the recent steep corrections experienced by the market in the past few weeks, ELF had only dipped briefly below it's 50 day moving average.
Every reversion back to it's 50 day moving average as potential opportunity to long. with a trailing stop loss about 10% below the 50 day MA is prudent for the longer term investor.
A swing trader would have a tighter trailing stop and on the lookout for re-entries on the long side as long as the trend remains intact.
Disclaimer: Just my 2 cents and not a trade advice. Kindly do your own due diligence and trade according to your own risk tolerance and don't forget that money management is important! Take care and Good Luck!

The $50 area awaits usThe decline has not ended yet, and it is assumed that we will go to the shaded area below, including a simple correction, and we will update the analysis at that time.
Note: The analysis fails to close above the 103usdt area.

One last wave of decline?It is possible that this decline is a compound decline and not a simple one, but if the numbering is correct, then it is expected that it will be minus a last downward wave, and the great decline will end, so let us see what will happen
Note: the analysis fails if the price closes above the area 27 usdt

AttentionMostly, the shape formed by the top is a composite correction, and currently we are in the upward correction phase, and it is about to end and start a final decline in the Z wave.
Note: the analysis fails if the price closed above an area 0.8 usdt
