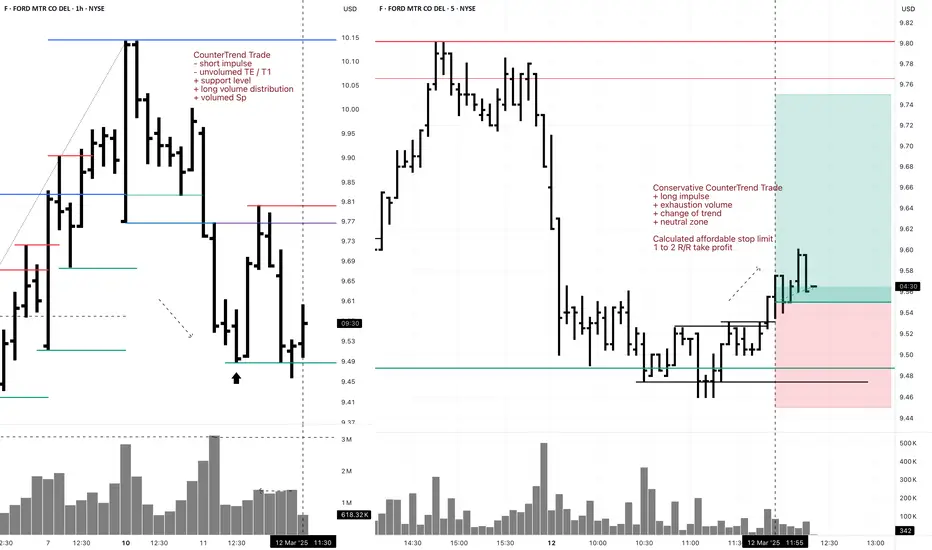
F 5M DayTrade Long Conservative CounterTrend TradeConservative CounterTrend Trade
+ long impulse
+ exhaustion volume
+ change of trend
+ neutral zone
Calculated affordable stop limit
1 to 2 R/R take profit
1H CounterTrend
"- short impulse
- unvolumed TE / T1
+ support level
+ long volume distribution
+ volumed Sp"
1D CounterTrend
"+ long impulse
- biggest volume on correction
- below SOS test level
- below support level
+ 1/2 correction"
1M Trend
"- short impulse
+ 1/2 correction
- unvolumed T1
+ support level
+ reverse volume approach
+ volumed manipulation"
1Y Trend
"+ long impulse
+ volumed T2 level
+ volumed 2Sp+
+ weak test"
Volumespreadanalysis
F 5M Daytrade Conservative CounterTrend TradeConservative CounterTrend Trade
+ long impulse
+ T1 level
+ support level
+ 1/2 correction
+ volumed 2Sp-
Calculated affordable stop limit
1 to 2 R/R take profit
1H Countertrend
"- short impulse
- unvolumed TE / T1
+ support level
+ long volume distribution
+ volumed Sp
+ test"
1D Trend
"+ long impulse
- biggest volume on correction
- below SOS test level
- below support level
+ 1/2 correction"
1M CounterTrend
"- short impulse
+ 1/2 correction
- unvolumed T1
+ support level
+ reverse volume approach
+ volumed manipulation"
1Y Trend
"+ long impulse
+ volumed T2 level
+ volumed 2Sp+
+ weak test"

PFE 1H Long Swing Conservative Trend TradeConservative Trend Trade
+ long impulse
+ SOS level
+ support level
+ 1/2 correction
+ biggest volumed Sp
Calculated affordable stop limit
1 to 2 R/R take profit before 1/2 of the Month
Expandable to 1/2 of the Year
Daily Trend:
"+ long impulse
+ neutral zone
+ close to 1/2 correction"
Monthly CounterTrend
"- short balance
+ unvolumed expanding ICE
+ volumed 2Sp-
+ weak test"
Yearly Trend
"+ long impulse
+ 1/2 correction
+ exhaustion volume?"
Will add more if corrects to 1/2 of 1H wave.

MRK 5M Long Investment Aggressive CounterTrend TradeAggressive CounterTrend Trade
- short impulse
+ exhaustion volume
+ volumed T1
+ volumed 2Sp-
+ weak test
+ first bullish bar closed entry
Calculated affordable stop limit
1/2 1M take profit
Hourly CounterTrend
"- short impulse
+ 1D SOS level"
Daily Trend
"+ long impulse
+ SOS level
- before 1/2 correction"
Monthly CounterTrend
"- short impulse
+ 1/2 correction
+ exhaustion volume?"
Yearly Trend
"+ long impulse
+ 1/2 correction
+ exhaustion volume?"

F 5M Long Conservative Trend DayTrade Conservative Trend Trade
+ long impulse
+ SOS level
+ 1/2 correction
+ support level
+ biggest volume 2Sp+
Calculated affordable stop limit
1D T2 take profit
1H Trend
"+ long impulse
- before 1/2 correction
+ SOS test level"
1D Trend
"- short impulse
+ exhaustion volume
+ volumed TE / T1 level
+ biggest volume 2Sp+
+ test"
1M CounterTrend
"- short impulse
+ 1/2 correction
- unvolumed T1
+ support level
+ reverse volume approach
+ volumed manipulation"
1Y Trend
"+ long impulse
+ volumed T2 level
+ volumed 2Sp+
+ weak test"

Bullish behaviour on NEM stockThe price of Newmont Corporation shares retraced to the areas where professional buying took place in the past (blue rectangles). The volume during that move down is decreasing, which, according to Volume Spread Analysis (VSA), is bullish behaviour.
Also, given that today's bar penetrates the recent demand zone and the professionals were buying there again, this stock looks very strong and has a high chance of reversal.
Closing above the $43.72 level followed by its testing on daily or lower (1H, 15 minutes) timeframes might start the rally towards $55.13 - $55.89 with resistance around $49.27 - $50.12.
If today's bar is tested and supply reappears during this process, we may expect an extension of the ongoing correction to the $37.53 - $38.37 area and another surge of buying there.

MGNT 1H Long Investment Conservative Trend TradeConservative Trend Trade
+ long impulse
+ SOS level
+ 1/2 correction
+ volumed 2Sp-
- day will close without test
Calculated affordable stop limit
1/2 1M take profit
Daily Trend
"+ long impulse
+ SOS test / T2 level
+ support level
- strong approach from volume zone
+ biggest volume manipulation"
Monthly Trend
+ long impulse
+ expanding biggest volume T2
+ support level
+ 1/2 correction
+ unvolumed 2Sp-
+ strong buying bars
+ weak selling bar / test
Yearly no context

Ford 1D Investment Aggressive CounterTrend TradAggressive CounterTrend Trade
- short impulse
+ exhaustion volume
+ 1/2 correction
Calculated affordable stop limit
Take profit:
1/3 to 1/2 Month Trend
1/3 to Month T2
1/3 to Year 1/2
Sell F Limit at $14.95 (Good 'til Canceled)
Sell F Limit at $11.57 (Good 'til Canceled)
Sell F Limit at $10.21 (Good 'til Canceled)
Monthly CounterTrend
"- short impulse
+ 1/2 correction
- unvolumed T1
+ support level
+ reverse volume approach
+ volumed manipulation"
Yearly Trend
"+ long impulse
+ volumed T2 level
+ volumed 2Sp+
+ weak test"

Strength on HPQ ChartHP Inc., stock approaches the bottom of the sideways channel (black horizontal lines) from which it may bounce again.
During the May 29, 2024 bar, professionals bought (blue rectangle), and since then, whenever the price reached this zone, they were buying more.
It should be noted that the buying around the bottom of the sideways is much bigger than the selling around its top which is bullish behaviour. Wyckoff's Spring on the recent activity adds to strength too. Another good sign for bulls is the decreasing volume on the down move, which indicates an absence of professional interest in lowering prices.
The testing process is ongoing as of today. If the price reaches the buying zone and no supply reappears, there is a big probability for a move up towards $37.30 - $ 39.29 with minor resistance around $34.62 - $34.72.
If supply reappears and the price breaks the bottom of the sideways channel ($32.41) we may see another leg down to $29.00 - $30.00 for more buying.

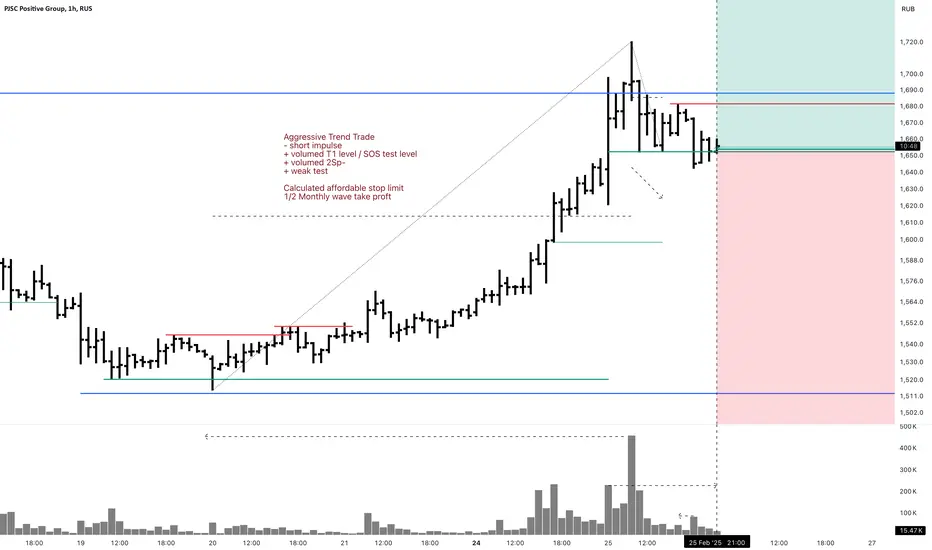
POSI 1H Investment Aggressive Trend TradeAggressive Trend Trade
- short impulse
+ volumed T1 level / SOS test level
+ volumed 2Sp-
+ weak test
Calculated affordable stop limit
1/2 Monthly wave take profit
Daily Trend
"+ long impulse?
- resistance level
- short volume distribution"
Monthly Trend
"+ long impulse
+ 1/2 correction
+ volumed expanding T1
+ support level
+ biggest volume manipulation"
Yearly Trend
+ long impulse
Weird set up. Market is strong and Monthly look a lot like exhaustion!
Strength on PCAR stock Paccar Inc. stock looks strong. We can see that since October 2024, the largest volume occurred after publishing earnings reports or on ex-dividend dates. Please note that:
- All bars on those days are down with the closing price in the middle of the bar which in Volume Spread Analysis (VSA) indicates strength.
- The volume on the October 22nd 2024 daily bar is the largest till now and the current price is above it.
- All professional activity after October 2024 is happening around the buying zone created during the October 22nd bar (blue rectangle $104.38 - $104.91).
- Recent buying (February 12th) breaks the previous low ($102.64) and recovers above that level which is a Wyckoff's Spring.
This all is very bullish. Still, the last testing showed the presence of supply.
If professionals can absorb the supply, we may expect a rally towards $116.01 - $117.83 with potential resistance in the $112.18 - $114.73 zone. Otherwise, another leg down to $100.01 for more buying is possible.

O 1D Investment Aggressive Trend TradeAggressive Trend Trade
- short impulse
+ biggest volume TE / T1
+ support level
+ biggest volume 2Sp-
+ weak test
+ first bullish bar close entry
Calculated affordable stop limit
1 to 2 R/R take profit
Monthly Trend
"+ long impulse
+ 1/2 correction
+ SoS level
+ support level
+ weak approach"
1Y Trend
"+ long balance
+ volumed manipulation
- neutral zone"

Strength on FMC stockAfter publishing the February 5th 2025 earnings report, the FMC Corporation stock gapped down, losing almost 34% of its value. Moreover, nowadays, the company is under serious pressure after being accused of publishing false Sales and Inventory information and downgrading shares from "Buy" to "Neutral" by some analytic companies (e.g. Redburn). Logically, in such circumstances, prices should continue down, but as a matter of fact, it is not the case. Why?
First, the February 5th bar is a down bar on a huge (largest in the last 15 years) volume, which, according to Volume Spread Analysis (VSA), indicates professional buying. Then, 2 days later, professionals bought again and the market responded by the higher prices.
Finally, the gapped-down bar reached the level of the previous support (blue rectangle on the daily and weekly charts), which adds strength.
Even though it looks very bullish on the daily chart, the price should be tested before the rally. Therefore, we may expect a shallow correction to $35.13 - $36.34 or, if supply is still there, to $30.80-33.73.
If testing is successful and the up move begins, the potential resistance on the way up will be around $48.06-$48.73 and $52.65 - $54.54 areas.

Weakness on HOOD stockRobinhood Markets, Inc. (NASDAQ: HOOD) shares appear to have sold off after publishing its February 12th earnings report. Following the report's good news, the market gapped up on opening and triggered a buying surge, allowing professionals to sell. The next day, the price recovered on a significantly lower volume, indicating absence of the professional interest on the upside (weakness). Then, on February 18th, another selling took place, which absorbed the remaining demand and pushed the price below the low of the gapped-up bar. This is bearish behaviour.
It has to be noted that there were a few more selling activities in December 2024/January 2025 (red rectangles), making the overall situation on the stock even weaker.
Despite the serious weakness, we may still see a retracement up into the $62.09 - $65.21 area for either more selling or retesting of demand, after which a move down to the $41.04-$42.66 zone could be expected. In this case, the support might reappear around the $52.96 level and at the $49.56 - $50.19 area.

Strength on MRNADespite negative news, Moderna, Inc. stock is in a good position to rally. Its price has been falling since August 2021, but relatively big buys have begun to emerge since August 2024.
It has to be noted that on every bar with buying, volume is increasing, which is usually a sign of accumulation on a down move.
If the price breaks the $40.83 level (the high of the bar with the largest volume), then tests it on low volume later, and supply does not re-emerge in the $49.94 - $56.70 zone, this would signal the end of accumulation. In such a case, we could expect the move towards $102.90 - $118.10, and if shares would not be sold off there, it might go even higher to $156.94 - $163.19.
At the same time, if accumulation has not been finished yet, we may still see another leg down for more buying.

FLOT 1D Long Investment Trend TradeTrend Trade
+ long impulse
+ T2 level
+ support level
+ 1/2 correction
+ biggest volume 2Sp+?
Calculated affordable stop limit
1 to 2 R/R take profit
Monthly countertrend
"- short impulse
+ volumed T1
+ 2Sp+
+ bigger volume on test"
Yearly context
"+ long impulse
- correction"

Weakness on DIS stockThe stock of Walt Disney Company looks interesting from the VSA point of view.
The monthly chart shows that the price is now around the top of the horizontal channel formed after a year of down move (blue lines). On one side, there is professional buying in the background, which might resolve this sideways to the upside, but there is much more supply around market peaks from the other side, and that might lead to a down move.
Deeper analyses of the price action over the last few months on the daily chart show massive supply. Moreover, the price went below the selling zone (red rectangle) and returned to its bottom on a low decreasing volume, showing an absence of professional interest to participate in an up move.
So, to summarise it together:
As of now, this stock is weak . With a big probability, the price may fall to the bottom of the monthly sideways channel first and if no buying suddenly appears while the price breaks the $79.24 level, it could reach the $20.0-$30.0 area then.
If professionals buy around the channel bottom, the move-up will depend on the size of that buying, but will most probably push the price back to the monthly channel's top.

O 1H Long CounterTrend TradeCounterTrend Trade
- short impulse
+ volumed T1
+ volumed Sp
+ weak test
+ below first bullish bar close entry
Calculated affordable stop limit
1 to 2 R/R take profit expandable to Investment
Daily Trend:
"+ long impulse
+ exhaustion volume
+ T2 level
+ support level"
Monthly Trend:
"+ long impulse
+ 1/2 correction
- SOS broken"
Yearly Trend:
" + long balance
+ volumed manipulation
- neutral zone"

Strength on AMD stockAfter almost a year of down move, on February 5th 2025 a huge professional buying took place on Advanced Micro Devices Inc. stock (Ticker NASDAQ: AMD). Even though we've seen professional buying on that move before, the volume there was much lower and, as a result, caused small retracements up only. The volume on the February 5th daily bar has much bigger potential. Moreover, a few things are adding to the strength:
- Recent buying appeared on the market opening after the earnings report with an immediate price rise.
- The price returned into the area of big volume (blue rectangle) on relatively low volume, showing no professional interest in the downside (testing).
Therefore, if no supply reappears below or around the $116.37 level, we may see a rally towards $150.37 - $153.03 and even higher to $166.10 - $167.08 zone.
In case supply hits the market in the mentioned area, another professional buying could take place around $95.61.

Bullish behaviour on ADBE stockIt looks like, after half a year of retracement, Adobe Inc. stock (Ticker NASDAQ: ADBE) is now setting up for longs again.
On the gap-down daily bar following the December 11th 2024 earnings report, professionals bought. Then, over December and January 2025, more buying can be seen. It has to be noted that recent professional activity took place around the previous level of support ($433.97) which adds to the strength. By January 10th supply has been absorbed, in February the price pushed above the support level and has been tested with relatively low volume creating conditions for the move up.
Today's bar is a positive reaction to the recent testing and might be the beginning of the rally towards $566.79 - $576.30 with minor resistances around $482.66 - $489.52 and $541.74 on the way.
At the same time, as we've seen a high volume around the support level (January 27th, 28th and 31st bars), there is still the possibility of its re-testing and the beginning of the rally from there.

NVS 1H Swing Long Conservative Trend TradeConservative Trend Trade
+ long impulse
+ 1/2 correction
+ T2 level
+ support level
- biggest volume 2Sp-
Calculated affordable stop limit
1 to 2 R/R within 1H range take profit
Daily Trend
"+ long impulse
+ 1/2 correction
+ JOC level
+ support level
- above 1/2 of entire 1D wave at the support level of 1M"
Monthly Trend
"+ long impulse
+ 1/2 correction
+ support level
+ JOC level
- unvolumed manipulation"
Yearly Trend
"+ long impulse
- resistance level
+ less than a month left and it looks to break
+ long volume distribution"
NVS @NYSE
Bought NVS Market, Day
Filled
8:27 AM
104.89325
Profit Taker
Sell NVS Limit 105.87, GTC
Submitted
8:27 AM

SMLT 1D Aggressive Investment CounterTrend TradeAggressive CounterTrend Trade
- short impulse
+ biggest volume T1
+ support level
+ biggest volume 2Sp+
+ weak test
+ first bullish bar closed entry
Calculated affordable stop limit
1 to 2 R/R take profit
CounterTrend 1M
"+ short impulse
+ biggest volume TE / T1 level
+ support level
+ biggest manipulation?"
Trend 12M
"+ SOS test level
- far below 1/2 correction
+ support level
+ biggest volume manipulation?"
They say company is going to bankruptcy, but why would it concern technical analysis?!

Bitcoin - New All time high incomingAs you can see, Bitcoin is about to close a weekly candle over the previous VSA resistance. $TRUMP token has also pushed bullish narrative onto public therefore I think that this correction is over.
Next stop is around 127k and after that we should reconsider whether there will be continuation or that's it.
