$CAWUSDT A Hunters DreamWhat Is CAW (A Hunters Dream) (CAW)?
A Hunters Dream (CAW) is a decentralized financial payments network that aims to transform the traditional blockchain payment system by using a basket of fiat/legal currency fixed-pegged stablecoins to stabilize the algorithm with the CAW reserve currency, fostering an open/transparent financial platform and facilitating programmable payment systems.
The CAW token was deployed as ERC-20 on Ethereum in April 2022.
A Hunters Dream (CAW) was announced in April 2022 on Twitter. As of June 2022, the project does not have an official website, white paper, or roadmap, but CAW does have a social Twitter account and an active Telegram channel.
Who Are the Founders of CAW (A Hunters Dream)?
There are no official statements about the composition of the team, the names of the founders, investors or backers remain unknown and as of June 2022, the project is being developed totally anonymously.
What Makes CAW (A Hunters Dream) Unique?
The goal of the developers is to build a complete cryptocurrency exchange rate system that will fundamentally change the existing method of calculating the cryptocurrency exchange rate and create a new online payment system.
Volumespreadanalysis

$FUNDUSDT Unification entry PT .265-ish Next Target PT 10Powering Oracle of Oracles (OoO) by Unification
xFUND’s supply starts at 0. It’s purpose is to enable off-chain governance for the entire Unification ecosystem and power a suite of products, including Oracle of Oracles. xFUND may be acquired on the open market or captured as emissions by Validators staking Mainnet FUND.

BTCUSDT - BIG MOVE Incoming 👀Hi Traders, Investors and Speculators
Ev here. Been trading crypto since 2017 and later got into stocks. I have 3 board exams on financial markets and studied economics from a top tier university for a year. Daytime job - Math Teacher. 👩🏫
We're about to witness the final call for Bitcoin - bullish or bearish in the next few weeks? Watch the WEEKLY Candlestick close to see which is more likely! If the price CLOSES underneath the support zone , bearish price action is the most likely. Judging by a few technical indicators such as RSI and LSMA , this seems like the more likely scenario. Unless something changes within the next 1D before the candle closes (this does sometimes happen). So the most reliable thing to watch at this point is the weekly candle close which closes tomorrow.
From a technical indicator perspective, we also see high volume at this range . This means the price could be gearing up for a BIG Move in either direction and the weekly close will give a hint towards which direction this may be.
Have a great weekend 🥂
_______________________
📢Follow us here on TradingView for daily updates and trade ideas on crypto , stocks and commodities 💎Hit like & Follow 👍
We thank you for your support !
CryptoCheck

Sales have slowed downDAILY CHART
Sales have slowed down, and when this happens history has shown us that it is the turn of the bulls, that confirms a bullish divergence on the weekly chart.
Not financial advice
just my wishes and humble analysis

UNIQUE - NS is holding well with SupportSign of Strength in the chart:
1. Shakeout pattern
2. NS with Spring signal
Disclaimer
This information only serves as reference information and does not constitute a buy or sell call. Conduct your own research and assessment before deciding to buy or sell any stock

ETH - Waiting for the next Pullback entrySign of Strength in the chart:
1. Hourly Bullish Signal
2. 15 minute bullish signal with Pullback
Disclaimer
This information only serves as reference information and does not constitute a buy or sell call. Conduct your own research and assessment before deciding to buy or sell any stock

Orgabio - Pullback almost complete Sign of Strength in the chart:
1. Gap up with support
2. Healthy Pullback
Disclaimer
This information only serves as reference information and does not constitute a buy or sell call. Conduct your own research and assessment before deciding to buy or sell any stock

HEXTAR - NS Signal near Support LevelSign of Strength in the chart:
1. Shakeout completed
2. Re-test support successfully with NS signal
Disclaimer
This information only serves as reference information and does not constitute a buy or sell call. Conduct your own research and assessment before deciding to buy or sell any stock

PRIVA - Another Goreng Stock ?Sign of Strength in the chart:
1. Volume increasing for past few candles
2. Bullish candles
Disclaimer
This information only serves as reference information and does not constitute a buy or sell call. Conduct your own research and assessment before deciding to buy or sell any stock

YZJ FIN - Reversal is coming ?Sign of Strength in the chart:
1. Reversal with high volume
2. Volume increase above support level
Disclaimer
This information only serves as reference information and does not constitute a buy or sell call. Conduct your own research and assessment before deciding to buy or sell any stock

YZJ - Breakout from SupportSign of Strength in the chart:
1. Bullish signal with volume
2. NS signal with Pullback
Disclaimer
This information only serves as reference information and does not constitute a buy or sell call. Conduct your own research and assessment before deciding to buy or sell any stock

AVYA - Beginning of UptrendSign of Strength in the chart:
1. Close gap down
2. Climatic Volume
3. Bullish signal
Disclaimer
This information only serves as reference information and does not constitute a buy or sell call. Conduct your own research and assessment before deciding to buy or sell any stock

HIBB (Weekly) - Bullish Signal is BackSign of Strength in the chart:
1. Reversal setup with Bullish Signal
Previous Bullish Signal gained +79%
Disclaimer
This information only serves as reference information and does not constitute a buy or sell call. Conduct your own research and assessment before deciding to buy or sell any stock

DBS (Weekly) - Bull Signal Back to the chartSign of Strength in the chart:
1. Reaccumulation with Bullish Signal
2. Strong uptrend
Previous Bullish Signal gained +46% and +18%
Disclaimer
This information only serves as reference information and does not constitute a buy or sell call. Conduct your own research and assessment before deciding to buy or sell any stock

TSM (Weekly) - No Sign of Recover YetSign of Weakness in the chart:
1. Bearish signal with increasing volume
Drop -35% from Bearish Signal
Disclaimer
This information only serves as reference information and does not constitute a buy or sell call. Conduct your own research and assessment before deciding to buy or sell any stock

AAPL (Weekly) - Bearish Signal Here AgainSign of Weakness in the Weekly Chart:
1. Bearish signal with increasing volume
Previous Bearish Signal drop -20%
Disclaimer
This information only serves as reference information and does not constitute a buy or sell call. Conduct your own research and assessment before deciding to buy or sell any stock

CWG - Unusual Volume with NS signalSign of Strength in the chart:
1. Climatic Volume with reversal
2. NS signal hold well above Support Level
Disclaimer
This information only serves as reference information and does not constitute a buy or sell call. Conduct your own research and assessment before deciding to buy or sell any stock

BANYAN - Reversal with PullbackSign of Strength in the chart:
1. Reversal with Bullish Signal
2. Pullback with NS signal
Disclaimer
This information only serves as reference information and does not constitute a buy or sell call. Conduct your own research and assessment before deciding to buy or sell any stock

OCBC - Expect another Round ?Sign of Strength in the chart:
1. Gap up with Reaccumulation
2. Bullish signal in the chart
Disclaimer
This information only serves as reference information and does not constitute a buy or sell call. Conduct your own research and assessment before deciding to buy or sell any stock

PUBLIC BANK - Bearish Signal appear againSign of Weakness:
1. Bearish Signal
2. Sell-Off bar with increasing volume
Disclaimer
This information only serves as reference information and does not constitute a buy or sell call. Conduct your own research and assessment before deciding to buy or sell any stock

AAPL - Bullish Signal with PullbackSign of Strength in the chart:
1. Pullback completed
2. Volume increasing with upbar
Disclaimer
This information only serves as reference information and does not constitute a buy or sell call. Conduct your own research and assessment before deciding to buy or sell any stock

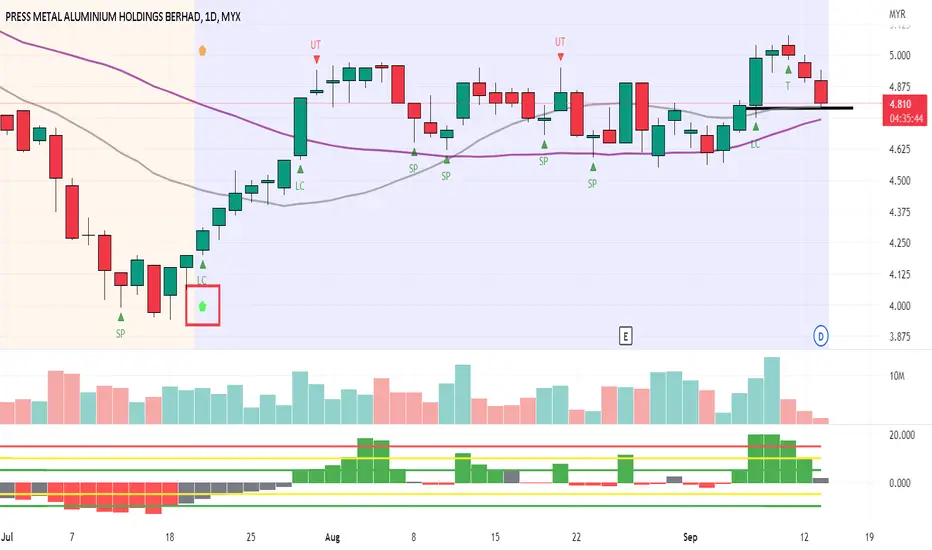
PMETAL - Pullback with Low VolumeSign of Strength in the background:
1. Reversal with accumulation
2. Line Change with volume
3. Low volume Pullback
Disclaimer
This information only serves as reference information and does not constitute a buy or sell call. Conduct your own research and assessment before deciding to buy or sell any stock
LATENT View is on verge of breakout Volumes increasing
Given downtrend breakout
A close about 430 can take it to 465 in no time
stay tuned
