WIPRO - Wipro Ltd. (45 minutes chart, NSE) - Long PositionWIPRO - Wipro Ltd. (45 minutes chart, NSE) - Long Position; short-term research idea.
Risk assessment: Medium {volume & support structure integrity risk}
Risk/Reward ratio ~ 2
Current Market Price (CMP) ~ 254.4
Entry limit ~ 254 on May 16, 2025
1. Target limit ~ 258.5 (+1.77%; +4.5 points)
2. Target limit ~ 263 (+3.54%; +9 points)
Stop order limit ~ 249.5 (-1.77%; -4.5 points)
Disclaimer: Investments in securities markets are subject to market risks. All information presented in this group is strictly for reference and personal study purposes only and is not a recommendation and/or a solicitation to act upon under any interpretation of the letter.
LEGEND:
{curly brackets} = observation notes
= important updates
(parentheses) = information details
~ tilde/approximation = variable value
-hyphen = fixed value
Volume

KIRI INDUSTRIES Breakout happend in this stock with rising 200dma and RS indicator is also showing strength.
Keep your risk and reward ratios according to your own preferance.
This is for educational purpose, do your own research before investing.

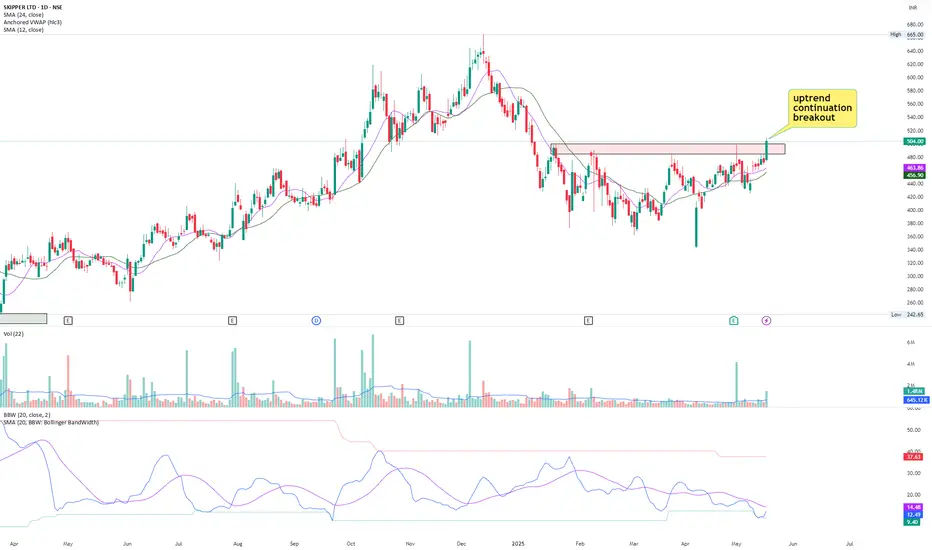
Breakout in SkipperStock has broken out of range of 4 months in long term uptrend with high relative volume.
Fundamentally, stock has delivered double digit earnings growth for straight 4 quarters.
Margins have also been increasing for last 3 quarters.
Overall, it's a good technofunda pick to watch out for.
USDDKK - U.S. Dollar/Danish Krone (3 hours chart, OANDA) - LongUSDDKK - U.S. Dollar / Danish Krone (3 hours chart, OANDA) - Long Position; Short-term research idea.
Risk assessment: Medium {volume & support structure integrity risk}
Risk/Reward ratio ~ 2
Current Market Price (CMP) ~6.62000
Entry limit ~ 6.58000 on May 19, 2025
1. Target limit ~ 6.63000 (+0.76%; +0.05000 points)
2. Target limit ~6.68000 (+1.52%; +0.10000 points)
Stop order limit ~ 6.53000 (-0.76%; -0.05000 points)
Disclaimer: Investments in securities markets are subject to market risks. All information presented in this group is strictly for reference and personal study purposes only and is not a recommendation and/or a solicitation to act upon under any interpretation of the letter.
LEGEND:
{curly brackets} = observations
= important updates
(parentheses) = information
~ tilde/approximation = variable value
-hyphen = fixed value

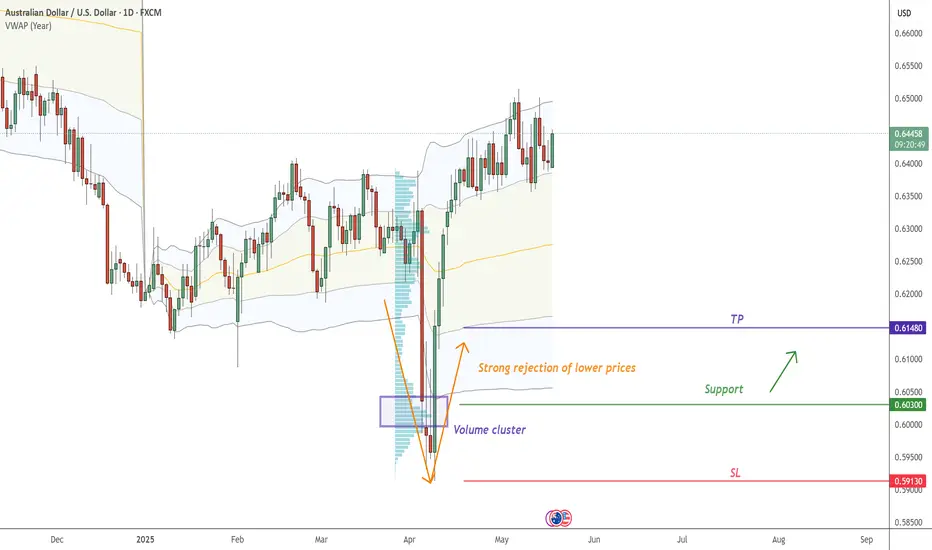
AUD/USD trade with TP + SLOn AUD/USD , it's nice to see a strong buying reaction at the price of 0.60300.
There's a significant accumulation of contracts in this area, indicating strong buyer interest. I believe that buyers who entered at this level will defend their long positions. If the price returns to this area, strong buyers will likely push the market up again.
Rejection of lower prices and high volume cluster are the main reasons for my decision to go long on this trade.
Happy trading
Dale
USD/CHF continue with the UptrendOn USD/CHF , it's nice to see a strong buying reaction at the price of 0.83160.
There's a significant accumulation of contracts in this area, indicating strong buyer interest. I believe that buyers who entered at this level will defend their long positions. If the price returns to this area, strong buyers will likely push the market up again.
(FVG) - Fair Value GAP and high volume cluster are the main reasons for my decision to go long on this trade.
Happy trading
Dale

Inside The Eye Of The Storm - $90 Target On TSMCIf you've seen my posts on Minds (particularly the board for NASDAQ:SOX ), it’s no secret that I’ve been bearish on semiconductors for some time. My bearish thesis is based on several factors: technical indicators, overvaluation of certain companies, and skepticism that AI-driven demand will result in broad-based prosperity. As the charts grow increasingly overbought, unfolding geopolitical developments could soon deliver a shock to the semiconductor sector, reinforcing the technical signals I’m observing.
At the time of writing, the market is turning bearish. Futures are down over 1%, and the TVC:US10Y is up nearly 2%. Institutional investors remain cautious about the U.S. economy due to its high debt levels and efforts to raise the debt ceiling to accommodate an additional $2 trillion in debt-financed tax cuts. Meanwhile, on the trade war front, the U.S. and China have agreed to deescalate tensions, a surprisingly smooth shift after weeks of posturing and brinkmanship. Although SP:SPX surged over 2% on the news, something feels off—worthy of speculation.
Recent articles in Foreign Affairs (www.foreignaffairs.com) and The Economist (www.economist.com) suggest that President Xi may now see his best opportunity to fulfill his longstanding goal of reunifying China.
I encourage reading those articles if you're interested, but here’s my take—and how it relates to a low-risk/high-reward short trade in semiconductors. By striking a tariff-reduction deal with the Trump administration, China has removed a key obstacle that could have otherwise hindered military action against Taiwan. While Trump has flip-flopped on Taiwan over the years, he has previously threatened sanctions and tariffs as deterrents. But with the economy already strained, reimposing tariffs of 145% or higher would be self-defeating.
This opens the door for China to escalate. Over the past month, we’ve seen “gray zone” tactics: military drills, suspicious Chinese fishing vessels dragging anchors near undersea cables, and reports that China may use its coast guard to “quarantine” vessels heading to or from Taiwan—potentially inflicting serious economic pain. Such moves would place the U.S. in a precarious position.
To compound the risk, Taiwan imports 90% of its energy—mostly LNG—and just shut down its last nuclear reactor on Friday (5/16), which supplied around 4.5% of the nation’s power. In 2023, NYSE:TSM alone used more than 8% of Taiwan’s electricity, according to Business Insider. Any disruption to power or communications would halt production.
This leads me to believe that China may attempt to annex Taiwan before 2027. (After all, why announce an invasion years in advance?) According to WIRED, NYSE:TSM produces at least 90% of the world’s most advanced chips, and Taiwanese companies control 68% of total global chip production. These fundamentals make Taiwan Semiconductor Manufacturing Company arguably the most vulnerable firm to any disruption in Taiwanese exports.
I’ve covered the market’s broader setup in other posts, so I’ll keep the technical analysis here brief. On the weekly chart (right), NYSE:TSM ’s price rose from October 2022 to January 2025 in five distinct waves. That uptrend has now been broken, and the price appears to be in the right shoulder of a large Head & Shoulders pattern. While the downside potential is open-ended, we can estimate a target using technicals. I expect the price to slice through the entirety of Wave (3) and find support in the blue-box, which aligns with the volume profile and 0.618–0.786 Fibonacci retracements. A break below the weekly 200MA would be a very bearish sign. For now, I’ve set my target for NYSE:TSM at $90.
Zooming in, the daily chart (right) shows numerous gaps and doji candles. The high-volume days were dominated by selling. On the 100R chart (left), including after-hours trading, the Fisher Transform oscillator shows bearish divergence. Although Friday closed flat (0.00%), the stock dropped nearly 2% after hours. I expect a move back to VWAP, especially if the broader market trends lower this week.
To gauge how TSMC stacks up against the broader industry, let’s look at some peers. On the semiconductor index NASDAQ:SOX , there are two key gaps worth watching—similar to what we see in other indexes. The price is currently at the 0.618 retracement of Wave (A) and briefly peaked above the 200MA. I expect it to move lower from here, likely filling those gaps and setting new lows.
For NASDAQ:NVDA , I’m seeing a Head & Shoulders pattern forming, with the price currently in Wave (B). Several downside price gaps exist, and more notably, there’s a volume gap between $95 and $102.
On the 500R chart (left), Nvidia is clearly overbought and facing resistance at the upper VWAP band. A move to the 1.618 extension would be extreme—but there’s an order block around that level, along with a gap down near $31, visible on the daily chart (right). Such a steep drop would require a major catalyst. While it’s unclear how reliant NASDAQ:NVDA is on Taiwan, it’s reasonable to assume the leading AI chipmaker depends on a supply chain anchored by the company producing 90% of the world’s advanced chips.
NASDAQ:AMD , another company heavily reliant on TSMC’s fabs, shows a very bearish setup on the weekly chart (right) when using a logarithmic scale. However, price action from the past year on the 500R chart (left) suggests it could move higher if basic Elliott Wave principles hold. AMD’s beta is 2.14 versus TSM’s 1.68, indicating lower correlation with the broader market. It may therefore be less compatible with wave theory, but it's still an essential ticker to monitor, especially as it diverges from NASDAQ:SOX and peers.
To conclude, considering the current overbought level of NYSE:TSM , coupled with the broader market pivoting back to a bearish trend, and its unique position at the center of a geopolitical and trade crisis, I think shorting TSMC provides a low risk/high reward setup with a target of $90. All of this to say, I am not a coldhearted opportunist, and I hope Taiwan can remain a free, democratic, country that is able to withstand China’s grey-zone tactics. Unfortunately, we should be prepared for Xi to use this opportunity to find out just how committed to Taiwan the Trump administration is, and as we saw during the COVID shutdown and subsequent supply shortages, microprocessors are some of the most essential products in the world that just so happen to be produced in the most vulnerable country in Asia. I suspect that there is trouble afoot.
Thank you for reading and let me know what you think.

Watching 3265 — The Key Level for Gold BuyersHey traders and investors!
📊 GOLD / W + D
📍 Context
On the weekly timeframe: a seller candle with increased volume but no result — the close is above 3201. This gives buyers a chance to take over the initiative.
On the daily timeframe: the buyer has brought the price back into the range (lower boundary at 3201), which also keeps the door open for bullish scenarios.
🎯 Trade Idea
Consider long positions after the price holds above 3265
Potential targets: 3435 and 3500
📌 Conclusion
Bulls have a chance — it's important to watch the price behavior around 3265 and look for long setups on lower timeframes. For example, a retest of 3265 after a breakout and absorption of the retest candle by the buyer, similar to what happened at the 3167 level on the hourly timeframe.

Ethereum: +80% in a Month — What’s Next?Hey traders and investors!
The price of ETH has surged by more than 80% over the past 30 days, but the momentum is starting to slow.
To understand the current position, we’re using the magic of timeframe switching and focusing on the 15-day chart.
Key Observations
1️⃣ A sideways range (consolidation) has formed on the 15D chart, with anchor points 1–6 (see chart).
2️⃣ The last major initiative came from sellers (move from point 5 to 6), and it includes some key features:
The initiative pushed below the lower boundary of the range — $2111.
The highest volume occurred on the last bar of this move (IKC bar).
The IKC bar absorbed liquidity not only below point 4 of the range but also below point 0 — the origin of the price move that preceded the formation of the range.
3️⃣ Buyers began developing their initiative by absorbing the sellers’ IKC bar, pushing price back into the range, and forming a buyer zone (blue rectangle on the chart, with the upper boundary at $1957).
4️⃣ Buyers have already reached the first target — $2717 (point 1 level).
What Does It Mean?
The rapid rally may slow down — the market likely needs some consolidation or a pullback.
A correction toward $2111 or even $1957 is possible. Both zones are attractive for medium-term long setups.
The medium-term bullish scenario remains valid as long as price stays above $2111.
Trade Outlook
📈 Long zones: $2111, $1957, or after a breakout and hold above $2717
🎯 Targets: $3744, then $4100
📉 Shorts are currently not justified — sellers show no real strength
Be ready for a potential “pause” in the rally and watch buyer activity — they currently hold the initiative (!).
This analysis is based on the Initiative Analysis concept (IA).
Wishing you profitable trades!

Descending triangle in SilverMicLooks like SILVERMIC1! is forming descending triangle on chart.
A decisive break below 94000 mark can cause further downfall in the commodity.
In the start of April 2025, Silver fell drastically and recovered later. The rise was on the back of low relative volume which is not good for buyers.
Now it is rangebound and forming descending triangle on chart and taking support multiple times near the 94000 price zone but never closed below that level. Hence a decisive close
below the 94000 mark can cause further downfall and will be a good short opportunity. Fingers crossed!

Silver Sunday, May 18, 2025#Silver is giving it all it's got, but I don't think it can hold up much longer.
What do you think?
SQQQ | Im Very Bearish the Markets Going into Q1 - 2025How I see It: (The commentary is purely my own thoughts based on my research comparing it to what I've seen in the media and other social media sites)
SQQQ smooths out the noise and shows me if we are in a bearish scenario in the technology sector.
This ETF has been in a bullish divergence for the last 6 months, and it showing signs its time to pop higher.
That equates to the QQQ's going into a correction mode over the next 3 - 6 months.
Be careful as profit taking will come hard, and margin calls will run crazy.
ProShares UltraPro Short QQQ seeks daily investment results, before fees and expenses, that correspond to three times the inverse (-3x) of the daily performance of the NASDAQ-100 Index. The fund invests in financial instruments that ProShare Advisors believes, in combination, should produce daily returns consistent with the fund's investment objective. The index includes 100 of the largest domestic and international non-financial companies listed on The Nasdaq Stock Market based on market capitalization. The fund is non-diversified.

ES: Testing Yearly Open at 5950Current Market Structure
Market completed successful retest of 2024 value area low (~20% correction from ATH)
We are currently engaged in value discovery journey back toward developing POC near ATH
Yearly open at ~5950 serves as current battleground level.
Friday's Action Analysis
Multiple rotations between yearly open (5950) and value area low (5925-5930)
Staying within and expanding above yesterdays upper distribution
Bulls eventually won the day, pushing +20 points to 5975
Key concern: Post-close liquidation break erased gains, returning to 5950
Suggests weak hands accumulated during the drift higher
Technical Structure Issues
White House announcement-driven moves created weak structure below current levels
Multiple unfilled gaps and single prints underneath
Weekly & Monthly VPOCs (virgin points of control) present structural vulnerabilities
Path of least resistance technically up, but lacking conviction
While the path of least resistance is upward, we really don't have a lot of people looking to start new positions here. Unless other timeframe traders come in and start finding value, we're just going to chop around. The market wants to get back to that POC near the highs, but it's getting artificial help every time we hit a pivotal point which is creating weak structure underneath us.

ES: Testing Yearly Open at 5950
Current Market Structure
Market completed successful retest of 2024 value area low (~20% correction from ATH)
We are currently engaged in value discovery journey back toward developing POC near ATH
Yearly open at ~5950 serves as current battleground level.
Friday's Action Analysis
Multiple rotations between yearly open (5950) and value area low (5925-5930)
Staying within and expanding above yesterdays upper distribution
Bulls eventually won the day, pushing +20 points to 5975
Key concern: Post-close liquidation break erased gains, returning to 5950
Suggests weak hands accumulated during the drift higher
Technical Structure Issues
White House announcement-driven moves created weak structure below current levels
Multiple unfilled gaps and single prints underneath
Weekly & Monthly VPOCs (virgin points of control) present structural vulnerabilities
Path of least resistance technically up, but lacking conviction
While the path of least resistance is upward, we really don't have a lot of people looking to start new positions here. Unless other timeframe traders come in and start finding value, we're just going to chop around. The market wants to get back to that POC near the highs, but it's getting artificial help every time we hit a pivotal point which is creating weak structure underneath us.

175B.Hello.
This is an indicator I don't use too often.
It catches whale buying and selling.
Whalemap.
But in this case, I found something interesting.
Big altcoin buy level at about ~175B with a retest.
And a bounce.
The boldness of the green line and the magnitude of the dot
radius show that this is a very large volume.
I think that's a pretty strong argument that the alts have passed
the bottom of the market.
They may not necessarily rise rapidly right away.
But they've already pushed off and consolidated.
The market bottom has been there.
However, there are a lot of other faithers like bitcoin dominance,
USDT dominance. And the Fed's base rate.
Follow the volume.

Thyssenkrupp earnings coming. Tales of two rises?1. Fundamentals:
Thyssenkrupp have suffered a lot. In 7 years it lost 90% of the market cap!
Early 2018 the stock price was €26, and it fell under €3 in 2024.
Slowdown in European industry, especially car manufacturing, and the idea of 'green steel' did hurt the price.
A quick recovery happened to €11, as European spending picked up steam. Especially, defense spending and the recovery in the car industry give hope to the car industry. Continental delivered good earnings last week.
However, the defense part might not be help earnings as soon 2025 Q1, and the car industry alone don't justify the €11 price.
2. Technicals
The first rally in one month was fast, but had volume under it.
The price of €2.768 in 2024 september was clearly a nonsense, shorters exited the stock and accumulation started.
In one month, February to March it went bananas, +140%, then Liberation day came and it fell, like everything else.
It rose again, but this time, the volume is declining.
My hunch is, a spike to 10.9-11.6 on earnings (15. May), and then straight down under €6.
Can be a good long on long-term, but it's overbought now.
Can be a good short idea on earnings, if it opens green.

MCX - Multi Commodity Exchange (45 minutes chart, NSE) - LongMCX - Multi Commodity Exchange (45 minutes chart, NSE) - Long Position; short-term research idea.
Risk assessment: Medium {volume structure integrity risk}
Risk/Reward ratio ~ 1.35
Current Market Price (CMP) ~ 6490
Entry limit ~ 6400 on May 16, 2025
Target limit ~ 6680 (+4.38%; +280 points)
Stop order limit ~ 6192 (-3.25%; -208 points)
Disclaimer: Investments in securities markets are subject to market risks. All information presented in this group is strictly for reference and personal study purposes only and is not a recommendation and/or a solicitation to act upon under any interpretation of the letter.
LEGEND:
{curly brackets} = observation notes
= important updates
(parentheses) = information details
~ tilde/approximation = variable value
-hyphen = fixed value

[𝟬𝟱/𝟭𝟮] 𝗪𝗲𝗲𝗸𝗹𝘆 𝗦𝗣𝗫 𝗚𝗘𝗫 𝗣𝗹𝗮𝘆𝗯𝗼𝗼𝗸🔍 IF/THEN QUICK GAMMA PLAYBOOK
IF > 5825 THEN path to 5900 → stall/profit-taking likely
IF > 5900 THEN path to first 5950, then 6000 → gamma squeeze extension zone
IF < 5825 THEN path to 5700 → test of transition zone support
Chop Zone: — re-entry = short-term balance/testing zone
IF < 5700 THEN path to 5500 → gamma flush / dealer unwind risk
🧭 𝗘𝗫𝗧𝗘𝗡𝗗𝗘𝗗 𝗭𝗢𝗡𝗘 𝗠𝗔𝗣/b]
✅ Gamma Flip Level
5700 → This is the confirmed Gamma Flip level = High Volatility Zone = HVL. We are comfortably above it, confirming positive gamma environment.
🧱 Major Call Walls / Resistance to upside from here
5900 → Significant call resistance zone (highlighted across GEX, profile, and /matrix command). 5825–5900 = Current rally zone → expected stall at 5900 (Profit-taking zone)5950 → Next mid-large positive gamma wall to the upside, mid-station between mounts. Dealers short gamma, adding fuel to breakout.6000 → Positive Gamma squeeze continuation target. Gamma squeeze intensifies → likely extends to 6000.🟦 Transition / Chop Zone
5700–5825 → Previous chop range. Retrace could test this before renewed upside.Currently outside and breaking up from this zone, indicating trend initiation.
Balance zone from prior structure.
Expect fade setups if price dips back in.
Needs catalyst or strong sell flow to re-enter meaningfully.
🛡️ Major Put Supports to the downside
5700 → = HVL, also aligned with pTrans and Put support.Dealer unwind risk, downside opens.5500 → Key level if the 5700 zone fails — “total denial zone” of current FOMO.
-----------------------------
This week’s SPX setup remains decisively bullish from a gamma perspective. The GEX profile shows strong positive gamma, with institutional and dealer hedging flows firmly positioned to support continued upside—especially into Friday’s OPEX. The environment is ideal for a controlled melt-up: volatility is softening, implied volatility is trending lower, and there’s no sign of panic in the options market.
Put pricing skew is also declining, which suggests reduced fear and a shift toward more aggressive call buying—another sign of bullish sentiment. Dealer positioning implies that any upward momentum is likely to be chased and hedged into, reinforcing the trend.
However, traders should stay alert: if SPX slips back below 5825, we may see a pause or retracement back into the 5700–5825 transition zone. Only a decisive break below 5700 would flip the gamma regime back to negative and open the door to real downside volatility.

HAL -Hindustan Aeronautics Ltd. (45 minutes chart, NSE) - LongHAL -Hindustan Aeronautics Ltd. (45 minutes chart, NSE) - Long Position; short-term research idea.
Risk assessment: High {volatility risk}
Risk/Reward ratio ~ 2.05
Current Market Price (CMP) ~ 4740
Entry limit ~ 4665 on May 14, 2025
1. Target limit ~ 4780 (+2.47%; +115 points)
2. Target limit ~ 4880 (+4.61%; +215 points)
Stop order limit ~ 4560 (-2.25%; -105 points)
Disclaimer: Investments in securities markets are subject to market risks. All information presented in this group is strictly for reference and personal study purposes only and is not a recommendation and/or a solicitation to act upon under any interpretation of the letter.
LEGEND:
{curly brackets} = observation notes
= important updates
(parentheses) = information details
~ tilde/approximation = variable value
-hyphen = fixed value

5/15 Gold Trading Signals🌇Good afternoon, everyone!
Yesterday, gold broke the support after some sideways movement and touched the buy zone near 3170, but profit was limited.
Today, after opening, gold rebounded to above 3190 but faced resistance and started dropping again. Notably, the 1-hour chart shows bullish divergence, and although not yet corrected, such divergence usually leads to a rebound of at least $60 — a potential opportunity worth watching.
🗞 News Highlights:
U.S. Initial Jobless Claims
Research conference on monetary policy and economy
These events may significantly impact gold, so stay alert.
📌 Today’s Trading Strategy:
🟢 Buy Zone: 3113 – 3076
🔴 Sell Zone: 3208 – 3223
🔄 Flexible Trading Ranges:
▫️3123-3152-3168-3187-3198
✅ Maintain cautious, flexible positioning. Watch for divergence correction opportunities for a potential sharp rebound.

Technical Breakdown on US100 (1H) TIME FRAMETechnical Breakdown on US100 (1H) using Volume Profile, Gann, and CVD + ADX
1. Key Observations (Volume, Gann & CVD + ADX Focused)
a) Volume Profile Insights:
Value Area High (VAH): 21,280
Value Area Low (VAL): 21,190
Point of Control (POC): 21,259.75
High-Volume Nodes: Dense volume between 21,200–21,260 indicating consolidation and potential distribution.
Low-Volume Gaps: Below 21,100 down to 20,800 — fast movement zones with limited participation.
b) Liquidity Zones:
Stop Clusters:
Above 21,300 (recent swing high zone and consolidation top)
Below 21,190 (VA Low, likely stop cluster from long positions)
Absorption Zones:
Strong absorption near 21,000 and again around 20,800 (marked by reversal attempts with high delta volume)
c) Volume-Based Swing Highs/Lows:
Swing Highs: 21,291 (confirmed by peak CVD and high rejection)
Swing Lows: 20,060 (prior major volume base and support)
d) CVD + ADX Indicator Analysis:
Trend Direction: Bearish Bias emerging (CVD divergence at highs, falling structure)
ADX Strength:
ADX > 20 + DI- > DI+ → Confirmed downtrend in progress
CVD Confirmation:
Falling CVD + Bearish Price Action = Clear supply dominance
2. Support & Resistance Levels
a) Volume-Based Levels:
Support:
VAL: 21,190
Lower POC: 20,060.91
Resistance:
VAH: 21,280
POC: 21,259.75
b) Gann-Based Levels:
Confirmed Gann Swing High: 21,291
Confirmed Gann Swing Low: 20,060
Retracement Levels:
1/2 = 20,675
1/3 = 20,537
2/3 = 20,812 → aligns with minor absorption
3. Chart Patterns & Market Structure
a) Trend: Bearish (confirmed by ADX > 20 + falling CVD and price)
b) Notable Patterns:
Distribution Zone forming at highs (flat top)
Descending Channel (Bear Flag) forming after topping — potential continuation lower
Rejection from POC + VAH convergence = strong signal for supply takeover
4. Trade Setup & Risk Management
a) Bullish Entry (watch for reversal confirmation):
Entry Zone: 20,800 (channel bottom/absorption + Gann 2/3)
Targets:
T1: 21,000
T2: 21,190 (VAL retest)
Stop-Loss (SL): 20,600
RR: Minimum 1:2
b) Bearish Entry (confirmed trend setup):
Entry Zone: 21,250–21,280 (POC + VAH)
Target:
T1: 20,800
Stop-Loss (SL): 21,320
RR: Minimum 1:2
c) Position Sizing:
Risk 1–2% of capital per trade to maintain long-term equity curve health

Technical Breakdown on Gold Spot / USD (XAU/USD) | 1H TimeframeTechnical Breakdown on Gold Spot (XAU/USD) – 1H Timeframe Using Volume Profile, Gann, and CVD + ADX
1. Key Observations (Volume, Gann & CVD + ADX Focused)
a) Volume Profile Insights:
Value Area High (VAH): 3,240.00
Value Area Low (VAL): 3,180.00
Point of Control (POC): 3,235.17
High-Volume Nodes: Around 3,220–3,240, suggesting heavy trading and possible resistance.
Low-Volume Gaps: Near 3,100–3,120, hinting at inefficient price action and potential magnet zones.
b) Liquidity Zones:
Potential Stop Clusters:
Above 3,240 (recent highs)
Below 3,100 (recent swing lows)
Order Absorption Zones:
3,180–3,200 showed high CVD divergence, signaling passive buy support.
c) Volume-Based Swing Highs/Lows:
Swing Highs with Volume Spike: 3,240.00
Swing Lows with Volume Spike: 3,100.00 (confirming reversal support)
d) CVD + ADX Indicator Analysis:
Trend Direction: Currently range-bound, with attempts at both upside and downside breakouts.
ADX Strength:
ADX < 20: Weak trend – indecisive market phase.
CVD Confirmation:
Previous CVD downtrend aligned with price drop → Strong supply
Latest CVD slight uptick, price holding = potential demand returning, but not yet confirmed.
2. Support & Resistance Levels
a) Volume-Based Levels:
Support:
VAL: 3,180
Recent swing low: 3,100 (with absorption)
Resistance:
VAH: 3,240
POC: 3,235
Channel top (3,200–3,220 zone)
b) Gann-Based Levels:
Swing High (Gann): 3,240
Swing Low (Gann): 3,100
Retracements:
1/2 Level: 3,170
2/3 Level: 3,180–3,190 → aligns with VAL
3. Chart Patterns & Market Structure
a) Trend: Range-bound (confirmed by weak ADX and opposing CVD moves)
b) Notable Patterns:
Falling Wedge in play, bullish breakout potential above 3,160
Parallel Channels diverging: one bullish correctional channel, one bearish continuation
Breakout Attempt: Minor bullish breakout from micro-channel underway (watch volume follow-through)
4. Trade Setup & Risk Management
a) Bullish Entry (pending CVD confirmation):
Entry Zone: 3,140–3,150 (on breakout retest)
Targets:
T1: 3,200
T2: 3,235 (POC)
Stop-Loss (SL): 3,100
RR: ~1:2 minimum
b) Bearish Entry (if rejection at POC/VAH):
Entry Zone: 3,230–3,240
Target:
T1: 3,180
Stop-Loss (SL): 3,260
RR: ~1:2 minimum
c) Position Sizing:
Risk only 1–2% of total capital per trade

DKNG | $50 UpdatePrice is set to head towards $50. Would like to see a pullback near bullish volume just after we push a little higher.
