Technical Breakdown on Gold Spot / USD (XAU/USD) | 1H TimeframeTechnical Breakdown on Gold Spot (XAU/USD) – 1H Timeframe using Volume Profile, Gann, and CVD + ADX
1. Key Observations (Volume, Gann & CVD + ADX Focused)
a) Volume Profile Insights:
Value Area High (VAH): 3,388.2
Value Area Low (VAL): 3,296.7
Point of Control (POC): 3,385.3
High-volume nodes: Dense consolidation between 3,365 – 3,390, indicating institutional activity and balance.
Low-volume gaps: Between 3,340 – 3,360 (inefficient move up, price may revisit).
b) Liquidity Zones:
Stop clusters likely at:
Above 3,388 (previous swing high)
Below 3,300 (recent swing low)
Order absorption areas: Around 3,320 where price stalled with large volume, indicating passive buyers absorbing aggressive sellers.
c) Volume-Based Swing Highs/Lows:
Swing High: 3,388.5 (strong rejection & volume spike)
Swing Low: 3,297.1 (volume bounce support area)
d) CVD + ADX Indicator Analysis:
Trend Direction: Range-bound currently (sideways movement in CVD with weak momentum)
ADX Strength: ADX < 20 → Indicates weak trend or consolidation
CVD Confirmation:
CVD is showing slight bullish divergence vs. price → early demand buildup
Not yet confirmed with strong trend continuation
2. Support & Resistance Levels
a) Volume-Based Levels:
Support:
VAL: 3,296.7
Absorption zone: 3,320.0
Resistance:
VAH: 3,388.2
Swing high: 3,388.5
b) Gann-Based Levels:
Recent swing low: 3,297.1
Retracement levels (from recent high 3,388.5 to low 3,297.1):
1/3 Retracement: 3,327.6
1/2 Retracement: 3,342.8
2/3 Retracement: 3,358.0
3. Chart Patterns & Market Structure
a) Trend: Range-bound (confirmed by ADX < 20 and flat CVD)
b) Notable Patterns:
Potential bullish falling wedge pattern forming
Projection suggests price might bounce from 3,320 toward upper channel (3,370+)
Watch for retest of POC (3,385) for breakout confirmation
4. Trade Setup & Risk Management
a) Bullish Entry (Pending confirmation from breakout and CVD support):
Entry Zone: 3,320 – 3,325 (channel + volume support)
Targets:
T1: 3,342.8 (50% Gann)
T2: 3,385.3 (POC and VAH)
Stop-Loss (SL): Below 3,297 (swing low/VAL)
RR: Minimum 1:2
b) Bearish Entry (If rejection at VAH and CVD turns bearish):
Entry Zone: 3,385 – 3,388
Target:
T1: 3,320.0
Stop-Loss (SL): Above 3,400
RR: Minimum 1:2
c) Position Sizing:
Risk only 1-2% of capital per trade
Volume

LODHA - Bearish due to forming double Top pattern
TECHNICAL INDICATORS -
DOUBLE TOP PATTERN formation -
NSE:LODHA has formed a double top pattern indicating strong downward pressure for the stock
Double top is characterized by two consecutive peaks on a price chart, with a dip or low between them & subsequent breakout
VOLUME SPIKE -
the stock has recently shown two large volume spikes indicating strong upcoming momentum for the stock
Generally volumes increase before a significant price movement
SHOOTING STAR candlestick -
the stock has formed a shooting star candlestick recently indicating trend reversal for it ie from upward movement to downward movement
Shooting star is characterized by a small body at bottom and a long upper shadow of a candlestick
GAP-DOWN BREAKOUT -
the stock has broken out of the pattern with a gap-down indicating very strong downward pressure
PROFIT TARGET -
1200
STOP LOSS -
1325

Gold in a Range — Caution for BuyersHey traders and investors!
On the daily timeframe, gold remains in a sideways range (marked by black lines).
The seller's initiative is still active and hasn't reached its target yet.
A seller zone has formed — highlighted by a red rectangle on the chart.
It’s better to look for buy setups around 3260 and 3201-3167.
This analysis is based on the Initiative Analysis concept (IA).
Wishing you profitable trades!

Earnings today with a break out and gap above?I am seeing a clear break of structure with a large liquidity gap above at my red lines.
With benefits to pharma tariffs being lifted it will provide bullish narratives for exporting our pharma production.
I honestly don't know much about the stock, but the technicals add up here.
Bearish thesis is a gap down to grab liquidity for long term.

VWAPs Don't Lie—XRP Faces Judgment Day At Monthly Support
In the volatile world of cryptocurrency trading, technical indicators often serve as critical guideposts for investors seeking to navigate uncertain markets. Among these indicators, the Volume Weighted Average Price (VWAP) has emerged as a powerful tool for assessing market sentiment and potential price movements. For XRP, Ripple's native cryptocurrency, the VWAP is currently telling a compelling story as the digital asset faces a critical juncture at its monthly support level while simultaneously breaking through key resistance barriers.
Understanding VWAP and Its Significance for XRP
The Volume Weighted Average Price represents the ratio of the value traded to total volume traded over a specific time period. Unlike simple moving averages, VWAP gives more weight to price moves that occur on higher volume, providing a more accurate representation of a security's true average price. For traders, VWAP serves as a benchmark that can indicate potential support and resistance levels.
For XRP, the current VWAP analysis reveals a crucial moment in its price trajectory. After months of consolidation following the partial legal victory against the SEC, XRP's price action against its VWAP indicators suggests we're approaching what many analysts are calling a "judgment day" scenario at its monthly support level.
Historically, XRP has respected its monthly VWAP lines with remarkable consistency. When the price falls below this indicator, it often signals sustained downward pressure; conversely, when it trades above the VWAP, bullish momentum typically follows. What makes the current situation particularly compelling is that XRP is simultaneously testing its monthly support while breaking through a key resistance level that has capped its upward movement for weeks.
XRP's Technical Landscape: Breaking Key Resistance
The recent breakthrough above a significant resistance level has generated fresh excitement among XRP investors. This resistance zone, which had repeatedly rejected upward price movements since early this year, finally gave way amid increasing trading volumes and renewed market optimism.
Several factors contributed to this technical breakout:
1. Increased Trading Volume: A substantial surge in trading activity provided the necessary momentum to push through resistance.
2. Improving Market Sentiment: The broader cryptocurrency market has shown signs of recovery, lifting sentiment across most digital assets.
3. Institutional Interest: Reports of increasing institutional accumulation of XRP have bolstered confidence in its long-term prospects.
4. Technical Convergence: Multiple technical indicators, including the Relative Strength Index (RSI) and Moving Average Convergence Divergence (MACD), aligned to signal bullish momentum.
The breakthrough above this key resistance level has opened the path for XRP to potentially test higher price targets. Technical analysts have identified several important levels to watch in the coming weeks, with projections suggesting that XRP could reach significantly higher valuations if the current momentum is sustained.
Monthly Support: The Line in the Sand
While the resistance breakthrough is undoubtedly positive, XRP simultaneously faces a critical test at its monthly support level. This support zone has acted as a reliable floor for XRP prices during previous downturns, and maintaining this level is crucial for preserving bullish momentum.
The monthly VWAP serves as a key component of this support structure. As volumes have increased, the VWAP has begun to flatten and show early signs of turning upward—a potentially bullish signal. However, failure to hold this support could trigger a cascade of selling pressure, potentially erasing recent gains.
Market observers note that this monthly support level coincides with several other technical indicators, creating what traders call a "confluence zone." These areas, where multiple support factors align, often prove to be significant inflection points for price action. For XRP, the current confluence zone represents not just a technical support level but a psychological barrier that could determine market sentiment in the months ahead.
The Ripple Effect: Fundamental Catalysts Behind Price Action
While technical analysis provides valuable insights into potential price movements, fundamental factors continue to influence XRP's market performance. Ripple, the company closely associated with XRP, has maintained progress on several fronts despite ongoing legal challenges.
The company's cross-border payment network, RippleNet, continues to expand its global footprint, with new partnerships announced across financial sectors. These real-world applications provide a foundation for XRP utility beyond speculative trading, potentially supporting long-term value.
Additionally, developments in the regulatory landscape have created both challenges and opportunities. The SEC case against Ripple, which initially caused significant market uncertainty, has evolved in ways that many legal experts interpret as increasingly favorable for Ripple. Court rulings that distinguished XRP sales to institutional investors from sales on secondary markets have provided some regulatory clarity, though final resolutions remain pending.
The combination of expanding real-world utility and potential regulatory clarity has created an environment where technical breakouts may have stronger fundamental support than in previous cycles.
Global Market Context: External Influences on XRP
XRP's price action does not occur in isolation, and global market factors continue to exert significant influence. Several external factors currently impact XRP's technical outlook:
1. Dollar Strength: Fluctuations in the U.S. dollar index have historically shown inverse correlations with cryptocurrency prices, including XRP.
2. Institutional Capital Flows: Shifting patterns in institutional investment have created new dynamics in the cryptocurrency market.
3. Regulatory Developments: Beyond the Ripple case, the broader regulatory environment for cryptocurrencies continues to evolve globally.
4. Correlation with Bitcoin: Despite efforts to establish independent price action, XRP maintains significant correlation with Bitcoin's market movements.
These external factors create a complex backdrop against which the technical battle at XRP's monthly support is playing out. Traders are carefully monitoring these influences for signs of how they might affect XRP's ability to maintain support and extend its recent breakout.
Trading Strategies at the Inflection Point
For traders navigating the current technical landscape, the confluence of monthly support testing and resistance breakout creates both opportunities and risks. Several trading approaches have emerged:
1. Breakout Confirmation Strategy: Some traders are waiting for additional confirmation of the resistance breakout before establishing new positions, looking for sustained trading above the recently broken level with strong volume.
2. Support Bounce Plays: Others are focusing on the monthly support level, planning entries if the price successfully bounces from this zone with convincing volume patterns.
3. Scaling Strategies: More conservative traders are implementing scaling strategies, gradually building positions as technical confirmations emerge.
4. Options and Derivatives Plays: In the derivatives markets, strategies focused on volatility expectations have gained popularity as traders anticipate significant price movement following the resolution of the current technical standoff.
What unifies these varied approaches is recognition of the current juncture's significance. The convergence of monthly VWAP support testing and resistance breakthrough represents a relatively rare technical setup that typically precedes substantial price movement in one direction or another.
Historical Precedents: What Past VWAP Interactions Tell Us
Looking at historical instances where XRP faced similar technical conditions provides valuable context for the current situation. Several notable examples stand out:
In late 2020, XRP successfully defended its monthly VWAP support before beginning a rally that would eventually see prices increase by over 800% in the subsequent months. The successful defense of this support level, combined with increasing volume, preceded one of XRP's most significant bull runs.
Conversely, in May 2021, XRP's failure to maintain its position above the monthly VWAP coincided with a market-wide correction that saw the asset lose over 70% of its value. This historical instance demonstrates the potential downside risk when VWAP support fails.
More recently, in early 2023, XRP tested its monthly VWAP during a period of market uncertainty. The successful defense of this level led to a period of relative price stability before a measured upward movement. This example presents a more moderate outcome possibility for the current situation.
These historical precedents illustrate the range of potential outcomes following interactions with monthly VWAP levels, from dramatic rallies to severe corrections to more measured movements. What they consistently demonstrate is that these interactions tend to precede significant price action rather than continued consolidation.
Fresh Upside Momentum: Targets and Projections
With XRP breaking through key resistance and testing monthly support, attention naturally turns to potential upside targets if bullish momentum continues. Technical analysts have identified several significant levels:
1. Initial Resistance Zone: The first major resistance above current levels sits approximately 20-25% higher, representing previous local highs that briefly capped earlier rally attempts.
2. Psychological Barriers: Beyond technical levels, psychological price points represent important barriers that could temporarily slow momentum as profit-taking occurs.
3. Long-term Technical Targets: Some analysts have identified far more ambitious targets based on larger technical patterns, though these would likely require sustained momentum over a longer timeframe.
It's important to note that these projections assume XRP successfully defends its monthly support level. Failure to maintain this support would invalidate many of these upside targets and potentially trigger downside projections instead.
Volume patterns will be critical in determining whether upside momentum can be sustained. Thus far, volume has shown encouraging signs, with increasing participation during upward price movements—a classic sign of authentic buying pressure rather than technical-driven price action with limited participation.
Risk Factors and Potential Headwinds
Despite the promising technical setup, several risk factors could disrupt XRP's path forward:
1. Legal Uncertainties: Though Ripple has secured some favorable rulings, the ongoing legal case continues to present unpredictable risks.
2. Market Liquidity Concerns: Broader market liquidity conditions could impact XRP's ability to sustain momentum, particularly if institutional investors reduce risk exposure.
3. Technical Invalidation: A decisive break below monthly support would invalidate the bullish case and potentially trigger substantial selling.
4. Competitor Developments: Advances from competing blockchain payment solutions could impact market perception of XRP's utility and long-term value proposition.
Prudent investors acknowledge these risks while assessing the technical opportunity presented by the current setup. Risk management approaches, including clearly defined exit strategies if support fails, remain essential despite the optimistic technical outlook.
Conclusion: Judgment Day for XRP
The confluence of monthly VWAP support testing and key resistance breakthrough has created what many analysts describe as a judgment day scenario for XRP. The resolution of this technical standoff will likely determine the asset's price trajectory for weeks or even months to come.
The VWAP indicator, with its volume-weighted approach to price analysis, has historically provided reliable signals for XRP's major price movements. The current readings suggest we're at a critical inflection point where significant price discovery in one direction or the other appears imminent.
For investors and traders, this technical juncture represents both opportunity and risk. The resistance breakthrough provides a potentially bullish signal, but this outlook remains contingent on successfully defending the monthly support level where the VWAP currently resides.
As volume patterns evolve and price action develops around these key levels, market participants would be wise to remember the maxim that has proven reliable throughout XRP's trading
history: when it comes to identifying genuine market momentum and sustainable price trends, VWAPs don't lie. The coming weeks will reveal whether XRP can transform its technical promise into sustained upward momentum or if support failure will lead to renewed downside pressure.
The judgment day at monthly support has arrived for XRP. The market's verdict awaits.

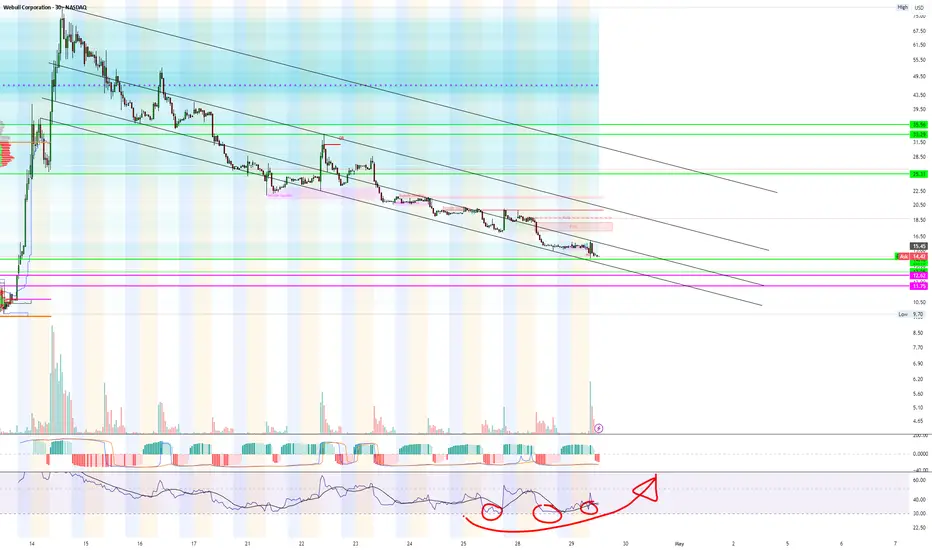
Wow, Id be dumping my life savings into this.First target is $25 and the $30 once we start to see price move closer to its volume profile gap down at my pink lines.
The key price level I see for support is 12.62$ but honestly, this looks like it could rip any day now.
Im longing until we break below $12

Natural Gas (Henry Hub) – Intraday Outlook | May 5, 2025I'm closely watching the 3.5341 level — it's the high of the bar with the highest volume traded recently, making it a significant area of interest. If price returns to this level, it may act as a potential pivot point for a long setup.
📈 Bullish Scenario:
If price reacts positively from 3.5341, confirming buyer presence, I will consider long entries from this level with the following targets:
🎯 Long Targets:
Target 1: 3.7396
Target 2: 3.8153
📉 Bearish Scenario:
If price breaks below 3.5341 and shows weakness on the retest, I’ll look for a short setup from that level.
🎯 Short Target:
3.4052
#TechnicalAnalysis #DayTrading #VSA #NG #HenryHub #NaturalGas #FuturesTrading #VolumeSpreadAnalysis

Is Gold Ready to Break the High… Again?On the Daily timeframe , the seller’s level at 3366.900 , formed by the April 22nd bar, was broken by strong buying pressure and is currently being retested from above.
On the Hourly chart , I’m observing a bullish wide-spread bar with the highest volume, which also broke through the 3366.900 level.
📈This bar has its own test at 3349.745, which supports the bullish bias for now.
As long as this level holds, I expect the long scenario to remain valid.
Overhead, there is resistance from sellers at 3404.761 .
If price breaks above it, the next upside targets are:
🎯 3438.708
🎯 3500.120
#TechnicalAnalysis #DayTrading #VSA #XAUUSD #GOLD # #FuturesTrading #VolumeSpreadAnalysis

Beautiful APEThis asset moving between horizontal so perfectly. Finding support on the monthly and daily below, moving up into weekly and full range point of control.... (Lil POC is the previous mini range point of control) . Lovely the volume not what it used to be on APE but still fun to trade

Natural gas short tradeShorted Naturalgasm @ 309.5 looking at recent double top. The major trend in natural gas is downtrend. This trade is in confluence with major trend. The volume is also supporting the trade.

XAUUSD - Possible Price DropLooking at the 30 minute price chart of XAUUSD I see a possibility of price going back to equilibrium at 3385 for investors to exit their gold positions possibly pushing gold prices lower for the short term future.

GOOGL SUPPORT AND RESISTANCEGOOGL is trading near the $154.50 level after rejecting the $170 resistance zone, where a sell block (2B) is marked.
There’s a visible gap acting as near-term support around $150.
Below, major buy zones (4B) are aligned at $150–$140, with deeper support at $130, which coincides with the weekly support level.
As long as price holds above the $150 gap, buyers may attempt to regain control.
A break below $150 could push the stock toward the $140 and $130 supports.
#Alphabet #GOOGL #Trading #StockMarket #VolumeProfile #TechnicalAnalysis #Investing #WallStreet
#globaltrade #investment #investing #stockmarket #wealth #realestate #markets #economy #finance #money #forex #trading #price #business #currency #blockchain #crypto #cryptocurrency #airdrop #btc #ethereum #ico #altcoin #cryptonews #Bitcoin #ipo

SPY RESISTANCE AREASPY is currently approaching the resistance zone between 560–580.
The gap zone at ~560 is acting as a key support.
If the price holds above this gap, the next target is set at 610.
Failure to hold may push the price down toward the strong support zone between 530–540.
#SPY #Trading #StockMarket #VolumeProfile #TechnicalAnalysis #Earnings #Investing #WallStreet
#globaltrade #investment #investing #stockmarket #wealth #realestate #markets #economy #finance #money #forex #trading #price #business #currency #blockchain #crypto #cryptocurrency #airdrop #btc #ethereum #ico #altcoin #cryptonews #Bitcoin #ipo

Technical Breakdown on US 100 1H TimeframeTechnical Breakdown on US100 1H Chart using Volume Profile, Gann, and CVD + ADX
1. Key Observations (Volume, Gann & CVD + ADX Focused)
a) Volume Profile Insights:
Value Area High (VAH): 20,080
Value Area Low (VAL): 19,720
Point of Control (POC):
Recent Session: 19,828.32
Previous Session: 19,760.96
High-volume nodes: Between 19,750 – 19,830 (acceptance zone with strong historical interest).
Low-volume gaps: 19,840 – 19,950 and above 20,100 (potential fast-move areas).
b) Liquidity Zones:
Stop Clusters Likely at:
Above 20,100 (psychological level and channel top).
Below 19,720 (value rejection zone).
Order Absorption Zones:
19,828 – 19,850 shows thick absorption based on CVD response and price stall.
c) Volume-Based Swing Highs/Lows:
Swing High: 20,080 (volume spike with slight wick rejection).
Swing Low: 19,700 (demand step-in area).
d) CVD + ADX Indicator Analysis:
Trend Direction: Uptrend (strong green candle series with rising CVD).
ADX Strength:
ADX > 20 with DI+ > DI- → Confirmed uptrend.
CVD Confirmation:
Rising CVD + bullish price action → Strong demand from market buyers, aligning with breakout above POC.
2. Support & Resistance Levels
a) Volume-Based Levels:
Support:
VAL: 19,720
POC (Current): 19,828.32
POC (Previous): 19,760.96
Resistance:
VAH: 20,080
Round number & psychological level: 20,100
b) Gann-Based Levels:
Gann Swing Low: 19,700
Gann Swing High: 20,080
Key Retracement Levels (Range: 19,700 – 20,080):
1/2: 19,890
1/3: 19,827
2/3: 19,953
3. Chart Patterns & Market Structure
a) Trend: Bullish (confirmed by rising ADX + CVD).
b) Notable Patterns:
Breakout from consolidation range above POC (strong volume confirmation).
Ascending channel structure supporting higher lows.
No divergence in CVD → healthy trend continuation signal.
4. Trade Setup & Risk Management
a) Bullish Entry (If CVD + ADX confirm uptrend):
Entry Zone: 19,828 – 19,850 (retest of POC/consolidation base)
Targets:
T1: 20,080 (VAH/Swing High)
T2: 20,200 (Channel Top)
Stop-Loss (SL): 19,700 (below swing low)
RR: ~1:2.3 minimum
b) Bearish Entry (If CVD + ADX flip bearish later):
Entry Zone: 20,080 – 20,100 (failure to break channel top)
Target:
T1: 19,828 (POC retest)
Stop-Loss (SL): 20,150 (above channel breakout zone)
RR: ~1:2
c) Position Sizing: Risk only 1-2% of capital per trade. Avoid oversized trades in extended trends.

Technical Breakdown on Gold Spot / USD (XAU/USD) | 1H TimeframeTechnical Breakdown on XAUUSD 1H Chart using Volume Profile, Gann, and CVD + ADX
1. Key Observations (Volume, Gann & CVD + ADX Focused)
a) Volume Profile Insights:
Value Area High (VAH): 3,399.00
Value Area Low (VAL): 3,345.00
Point of Control (POC): 3,384.51
High-volume nodes: Clustered between 3,370 – 3,390 (sideways consolidation).
Low-volume gaps: Below 3,340 and above 3,410 – thin auction zones with potential for fast moves.
b) Liquidity Zones:
Stop Clusters Likely at:
Previous high: ~3,415 (minor swing high).
Previous low: ~3,335 (visible demand zone with prior bounce).
Order Absorption Zones:
Around POC (3,384.51): High cumulative delta volume implies passive sellers absorbing buy pressure.
c) Volume-Based Swing Highs/Lows:
Swing High (Volume Spike): ~3,415
Swing Low (Volume Spike): ~3,340
d) CVD + ADX Indicator Analysis:
Trend Direction: Range-bound with mild bullish bias (price riding just above POC but within channel).
ADX Strength:
ADX < 20 → Weak trend
DI+ ≈ DI− → No clear dominance, indicating balance.
CVD Confirmation:
Rising CVD earlier aligned with up move to 3,415.
Currently flattening, suggesting equilibrium between buying and selling.
2. Support & Resistance Levels
a) Volume-Based Levels:
Support:
VAL: 3,345.00
POC: 3,384.51
Swing Low: 3,340
Resistance:
VAH: 3,399.00
Swing High: 3,415
b) Gann-Based Levels:
Gann Swing High: 3,415
Gann Swing Low: 3,340
Key Retracement Levels from Range (3,340 - 3,415):
1/2: 3,377.5
1/3: 3,365
2/3: 3,390
3. Chart Patterns & Market Structure
a) Trend:
Current: Range-bound (ADX weak, no clear CVD breakout).
Bias: Mildly bullish consolidation within a rising channel.
b) Notable Patterns:
Ascending channel formation (light purple zone).
Breakout attempts above VAH rejected.
Price oscillating near POC → likely accumulation or rebalancing phase.
4. Trade Setup & Risk Management
a) Bullish Entry (If CVD + ADX confirm uptrend):
Entry Zone: Near POC – 3,384.5
Targets:
T1: 3,399 (VAH)
T2: 3,415 (Swing High)
Stop-Loss (SL): Below VAL – 3,340
RR: ~1:2.2 minimum
b) Bearish Entry (If CVD + ADX confirm downtrend):
Entry Zone: Near VAH – 3,399
Target:
T1: 3,345 (VAL)
Stop-Loss (SL): Above Swing High – 3,420
RR: ~1:2 minimum
c) Position Sizing: Risk only 1-2% of capital per trade. Avoid overleveraging in choppy zones.


CMI - Cummins Inc. (2 hours chart, NYSE) - Long PositionCMI - Cummins Inc. (2 hours chart, NYSE) - Long Position; Short-term research idea.
Risk assessment: High {support & market structure integrity risk}
Risk/Reward ratio ~2.53
Current Market Price (CMP) ~ 293.45 {pre-market}
Entry limit ~ 288.50 to 285.50 (Avg. - 287) on April 25, 2025
1. Target limit ~ 294.50 (+2.61%; +7.5 points)
2. Target limit ~ 306 (+6.62%; +19 points)
Stop order limit ~ 279.50 (-2.61%; -7.5 points)
Disclaimer: Investments in securities markets are subject to market risks. All information presented in this group is strictly for reference and personal study purposes only and is not a recommendation and/or a solicitation to act upon under any interpretation of the letter.
LEGEND:
{curly brackets} = observations
= important updates
(parentheses) = information
~ tilde/approximation = variable value
-hyphen = fixed value

Technical Breakdown on US100 | 1H TimeframeHere’s a professional technical breakdown of the US100 Cash CFD (1H timeframe) using Volume Profile, Gann, and CVD + ADX indicators:
1. Key Observations (Volume, Gann & CVD + ADX Focused)
a) Volume Profile Insights:
Value Area High (VAH): 19,979.00
Value Area Low (VAL): 19,845.22
Point of Control (POC):
Recent POC: 19,979.52
Prior POC: 19,845.22
High-volume nodes: Clearly seen around 19,845 and 19,880–19,980, indicating buyer-seller equilibrium.
Low-volume gaps: Between 19,900–19,950 and below 19,800–19,700 — price can move fast through these zones.
b) Liquidity Zones:
Stops Likely Clustered:
Above 20,000 (psychological + prior swing high)
Below 19,800 (swing low and zone of previous rejection)
Absorption Zones:
Notable delta-based absorption occurred around 19,845 and 19,880 zones, indicating institutional activity.
c) Volume-Based Swing Highs/Lows:
Swing High (with spike): 19,980–20,000 (strong volume + reversal candle).
Swing Low (with spike): 19,845 zone, also aligns with historical POC, confirming strong defense.
d) CVD + ADX Indicator Analysis:
Trend Direction: Range-bound to Bearish bias
ADX Strength:
ADX is hovering near 20, not confirming a strong trend.
DI- > DI+ suggests slight downward pressure.
CVD Confirmation:
Flat to slightly falling CVD with price stalling = Supply is outweighing demand, slight bearish bias.
2. Support & Resistance Levels
a) Volume-Based Levels:
Support:
19,845.22 (POC + VAL)
19,800 (swing low and absorption)
Resistance:
19,979.52 (POC)
20,000 (psychological + rejection zone)
b) Gann-Based Levels:
Confirmed Swing High: 20,000
Confirmed Swing Low: 19,845
Key Retracements (From 19,845 to 20,000):
1/2: 19,922
1/3: 19,896
2/3: 19,969
3. Chart Patterns & Market Structure
a) Trend: Range-bound to Slightly Bearish
Price is stuck between 19,845–19,979 with no clear breakout or breakdown.
b) Notable Patterns:
Horizontal consolidation forming after a failed breakout near 20,000.
Bearish bias is developing with failure to hold above POC.
Watch for breakout from the descending triangle setup forming.
4. Trade Setup & Risk Management
a) Bullish Entry (Only if breakout above resistance):
Entry Zone: 19,985–20,000 (break + retest)
Targets:
T1: 20,100
T2: 20,300
Stop-Loss (SL): 19,940 (below breakout level)
RR: Minimum 1:2
b) Bearish Entry (If CVD + ADX confirm downtrend):
Entry Zone: 19,845–19,860 (retest of support failure)
Target:
T1: 19,700
Stop-Loss (SL): 19,980
RR: Minimum 1:2
c) Position Sizing: Risk 1–2% of capital per trade.

Technical Breakdown on Gold Spot / USD (XAU/USD) | 1H TimeframeHere's a detailed technical breakdown of the Gold Spot / USD (XAU/USD), 1H timeframe chart using Volume Profile, Cumulative Volume Delta (CVD), and ADX:
1. Key Observations (Volume, Gann & CVD + ADX Focused)
a) Volume Profile Insights:
Value Area High (VAH): 3395.88
Value Area Low (VAL): 3311.18
Point of Control (POC): 3381.67 (recent) / 3311.18 (previous)
High-volume nodes: Concentrated around 3380–3390 and earlier at 3300–3320, suggesting strong buyer interest.
Low-volume gaps: Between 3350–3370, indicating weak resistance and potential for swift price movement.
b) Liquidity Zones:
Stop Clusters: Around 3400 (recent swing high), and 3310 (swing low/POC) — potential liquidity sweep zones.
Order Absorption: Strong delta buildup near 3380–3390 indicates heavy buying pressure and potential large-position accumulation.
c) Volume-Based Swing Highs/Lows:
Swing High (Volume Spike): 3395.88 – recent high with strong breakout volume.
Swing Low (Volume Spike): 3311.18 – confirmed reversal point with heavy absorption.
d) CVD + ADX Indicator Analysis:
Trend Direction: Uptrend (confirmed by multiple bullish CVD bars and higher highs).
ADX Strength: ADX > 20 with DI+ > DI- ⇒ Confirmed uptrend.
CVD Confirmation: Rising CVD with bullish price action = Strong demand confirmation. Market is led by aggressive buyers.
2. Support & Resistance Levels
a) Volume-Based Levels:
Support:
VAL: 3311.18
POC: 3381.67
Swing Low with Absorption: 3310
Resistance:
VAH: 3395.88
Swing High: 3400–3410 zone
b) Gann-Based Levels:
Gann Swing Low: 3311
Gann Swing High: 3395
Key Retracements (From 3311 to 3395):
1/2 level: 3353
1/3 level: 3339
2/3 level: 3367
3. Chart Patterns & Market Structure
a) Trend: Bullish
Supported by rising price structure, channel breakout, and rising CVD.
b) Notable Patterns:
Bullish channel forming (highlighted in purple).
Breakout above previous consolidation range (POC breakout).
Retest of POC at 3381.67 acting as support now.
4. Trade Setup & Risk Management
a) Bullish Entry (Confirmed by CVD + ADX):
Entry Zone: 3381–3385 (retest of POC/support).
Targets:
T1: 3410
T2: 3440
Stop-Loss (SL): Below swing low at 3350
RR: Minimum 1:2
b) Bearish Entry (Wait for breakdown of trend):
Entry Zone: 3310 (if price breaks below support).
Target:
T1: 3275
Stop-Loss (SL): Above 3350 (last high-volume rejection)
RR: Minimum 1:2
c) Position Sizing: Risk only 1–2% of capital per trade.

ETERNAL - Eternal Ltd. (2 hours chart, NSE) - Long PositionETERNAL - Eternal Ltd. (2 hours chart, NSE) - Long Position; short-term research idea.
Risk assessment: Medium {volume structure integrity risk}
Risk/Reward ratio ~ 2.36
Current Market Price (CMP) ~ 240
Entry limit ~239 to 237 (Avg. - 238) on May 05, 2025
1. Target limit ~ 247 (+3.78%; +9 points)
2. Target limit ~ 251 (+5.46%; +13 points)
Stop order limit ~ 232.5 (-2.31%; -5.5 points)
Disclaimer: Investments in securities markets are subject to market risks. All information presented in this group is strictly for reference and personal study purposes only and is not a recommendation and/or a solicitation to act upon under any interpretation of the letter.
LEGEND:
{curly brackets} = observation notes
= important updates
(parentheses) = information details
~ tilde/approximation = variable value
-hyphen = fixed value

Why Volume Bar Colors Can Mislead You█ The Truth Behind Volume Bars — What Do Green and Red Actually Mean?
Most traders learn early on that green volume bars mean bullish activity, and red bars mean bearish pressure. But is it really that simple? What does volume truly reflect, and are we making assumptions that can mislead us?
█ What Volume Actually Is
Volume represents the number of shares/contracts traded during a specific time interval. Every transaction includes both a buyer and a seller. So, volume itself doesn’t distinguish whether a trade was bullish or bearish. Instead, platforms color volume bars based on price movement:
Green: If price closed higher than it opened.
Red: If price closed lower than it opened.
Some platforms, like TradingView, allow you to color volume based on whether the price closed higher or lower than the previous candle’s close.
So YOU, as a trader, have the chance to decide whether to assign volume bars either bullish or bearish! It’s a setting parameter anyone can change. Traders around the globe might look at the same volume bar, but some interpret it as bearish, while others interpret it as bullish. What is the most correct way?
█ The Assumption Behind the Color
This coloring assumes that:
A rising price means buyers were more aggressive (lifting the ask).
A falling price means sellers were more aggressive (hitting the bid).
This is a proxy — an approximation. It simplifies market pressure into a binary outcome: if price goes up, it's bullish volume; if it goes down, it's bearish. But the market isn't always so binary.
However, the assumption is only an approximation of buying vs. selling. In reality, every single trade involves both a buyer and a seller, so volume itself isn’t inherently “buy” or “sell” – what matters is who initiated the trades. As one trading expert explains, talking about “buying volume” vs “selling volume” can be misleading: for every buyer there is a seller, so volume cannot be literally split into purchases and sales. Instead, what traders really mean by “bullish volume” is that buyers were more aggressive (lifting offers) and drove the price up, whereas “bearish volume” means sellers were more aggressive (hitting bids) and drove the price down. The colored volume bar is essentially a proxy for which side won the battle during that bar.
█ Why This Can Mislead You
Price might close higher, not because there were more buyers than sellers (there never are — every trade has both), but because buyers were more urgent. And sometimes price moves due to other forces, like:
Short covering.
Stop-loss runs.
Liquidity vacuums.
This means a green bar might not reflect strong demand, just urgency from the other side closing their positions.
⚪ Example:
Take the well-known GameStop short squeeze as an example. If you looked only at the volume bars during that rally, you’d see a wall of strong green candles and high volume, which might suggest aggressive bullish buying.
However, that interpretation would be misleading.
Under the surface, the surge wasn't driven by fresh bullish conviction — it was massive short covering. Traders who were short were forced to buy back shares to cover their positions, which drove prices even higher. The volume was categorized as bullish, but the true intent behind the move had nothing to do with new buying pressure.
This demonstrates why relying solely on volume color or candle direction can lead to false conclusions about market sentiment.
Does this simple up/down volume labeling truly reflect buying vs. selling pressure? To a degree, yes – it captures the net price outcome, which often corresponds to who was more aggressive. For example, if many buyers are willing to pay higher prices (demand), a bar will likely close up and be colored green, reflecting that buying interest. Conversely, if eager sellers are dumping shares and undercutting each other, price will drop, yielding a red bar that flags selling pressure. Traders often use rising volume on up-moves as confirmation of a bullish trend’s strength, and high volume on down-moves as a warning of distribution, which indeed aligns with traditional analysis
That said, the method has important limitations and nuances, documented both anecdotally and in research:
⚪ Volume is not one-dimensional: Since every trade has both a buyer and seller, one cannot literally count “buy volume” vs “sell volume” without more information. The green/red coloring is a blunt classification based on price direction, not an actual count of buys or sells. It assumes the price change direction is an adequate proxy for the imbalance of buying vs. selling. This is often true in a broad sense, but it’s not a precise measure of order flow.
⚪ Intrabar Dynamics Are Lost: A single bar’s color only tells the end result of that interval, not the story of what happened during the bar. For instance, a 4-hour candle might be red (down) overall, but it could have contained three hours of rally (buying) followed by a steep selloff in the final hour that erased the gains. The volume bar will be colored red due to the net price drop, even though significant buying occurred earlier in the bar. In other words, a large red bar can mask that there were pockets of bullish activity within – the selling just happened to win out by the close of that period. Without looking at smaller time frames or detailed data, one can’t tell from a single color how the buying/selling tug-of-war progressed within the bar.
⚪ Gap Effects and Criteria Choices: The choice of using open vs. close or previous close can alter the interpretation of volume. As discussed, a day with a big gap can be labeled differently under the two methods. Neither is “right” or “wrong” – they just highlight different perspectives (intraday momentum vs. day-over-day change). Traders should be aware that colored volume bars are an approximation. A green volume bar under one method might turn red under the other method for the same bar. This doesn’t mean volume changed – it means the classification scheme changed. For example, a stock that closes below its open but still higher than yesterday will show a red volume bar by the intraday method but would be considered an “up-volume day” in OBV terms (previous close method).
⚪ No Indication of Magnitude or Commitment: A single color also doesn’t convey how much buying or selling pressure there was, only which side won. Two green volume bars might both be green, but one could represent a modest uptick with tepid buying, whereas another could represent an aggressive buying spree – the color alone doesn’t distinguish this (other than one bar likely being taller if volume was higher). Traders often need to consider volume relative to average (e.g. using volume moving averages or looking for volume spikes) to judge the significance of a move, not just the color.
█ Summary
The coloring of volume bars is a visual shortcut, not an exact science. It’s a guess based on price direction — useful, but imperfect. Understanding this helps traders avoid reading too much into what a green or red volume bar actually means.
-----------------
Disclaimer
The content provided in my scripts, indicators, ideas, algorithms, and systems is for educational and informational purposes only. It does not constitute financial advice, investment recommendations, or a solicitation to buy or sell any financial instruments. I will not accept liability for any loss or damage, including without limitation any loss of profit, which may arise directly or indirectly from the use of or reliance on such information.
All investments involve risk, and the past performance of a security, industry, sector, market, financial product, trading strategy, backtest, or individual's trading does not guarantee future results or returns. Investors are fully responsible for any investment decisions they make. Such decisions should be based solely on an evaluation of their financial circumstances, investment objectives, risk tolerance, and liquidity needs.

Gold After breaking the downtrend line, the volume zone and the moving averages, we will start buying now.
