Volume

CMI - Cummins Inc. (2 hours chart, NYSE) - Long PositionCMI - Cummins Inc. (2 hours chart, NYSE) - Long Position; Short-term research idea.
Risk assessment: High {support & market structure integrity risk}
Risk/Reward ratio ~2.53
Current Market Price (CMP) ~ 293.45 {pre-market}
Entry limit ~ 288.50 to 285.50 (Avg. - 287) on April 25, 2025
1. Target limit ~ 294.50 (+2.61%; +7.5 points)
2. Target limit ~ 306 (+6.62%; +19 points)
Stop order limit ~ 279.50 (-2.61%; -7.5 points)
Disclaimer: Investments in securities markets are subject to market risks. All information presented in this group is strictly for reference and personal study purposes only and is not a recommendation and/or a solicitation to act upon under any interpretation of the letter.
LEGEND:
{curly brackets} = observations
= important updates
(parentheses) = information
~ tilde/approximation = variable value
-hyphen = fixed value

Technical Breakdown on US100 | 1H TimeframeHere’s a professional technical breakdown of the US100 Cash CFD (1H timeframe) using Volume Profile, Gann, and CVD + ADX indicators:
1. Key Observations (Volume, Gann & CVD + ADX Focused)
a) Volume Profile Insights:
Value Area High (VAH): 19,979.00
Value Area Low (VAL): 19,845.22
Point of Control (POC):
Recent POC: 19,979.52
Prior POC: 19,845.22
High-volume nodes: Clearly seen around 19,845 and 19,880–19,980, indicating buyer-seller equilibrium.
Low-volume gaps: Between 19,900–19,950 and below 19,800–19,700 — price can move fast through these zones.
b) Liquidity Zones:
Stops Likely Clustered:
Above 20,000 (psychological + prior swing high)
Below 19,800 (swing low and zone of previous rejection)
Absorption Zones:
Notable delta-based absorption occurred around 19,845 and 19,880 zones, indicating institutional activity.
c) Volume-Based Swing Highs/Lows:
Swing High (with spike): 19,980–20,000 (strong volume + reversal candle).
Swing Low (with spike): 19,845 zone, also aligns with historical POC, confirming strong defense.
d) CVD + ADX Indicator Analysis:
Trend Direction: Range-bound to Bearish bias
ADX Strength:
ADX is hovering near 20, not confirming a strong trend.
DI- > DI+ suggests slight downward pressure.
CVD Confirmation:
Flat to slightly falling CVD with price stalling = Supply is outweighing demand, slight bearish bias.
2. Support & Resistance Levels
a) Volume-Based Levels:
Support:
19,845.22 (POC + VAL)
19,800 (swing low and absorption)
Resistance:
19,979.52 (POC)
20,000 (psychological + rejection zone)
b) Gann-Based Levels:
Confirmed Swing High: 20,000
Confirmed Swing Low: 19,845
Key Retracements (From 19,845 to 20,000):
1/2: 19,922
1/3: 19,896
2/3: 19,969
3. Chart Patterns & Market Structure
a) Trend: Range-bound to Slightly Bearish
Price is stuck between 19,845–19,979 with no clear breakout or breakdown.
b) Notable Patterns:
Horizontal consolidation forming after a failed breakout near 20,000.
Bearish bias is developing with failure to hold above POC.
Watch for breakout from the descending triangle setup forming.
4. Trade Setup & Risk Management
a) Bullish Entry (Only if breakout above resistance):
Entry Zone: 19,985–20,000 (break + retest)
Targets:
T1: 20,100
T2: 20,300
Stop-Loss (SL): 19,940 (below breakout level)
RR: Minimum 1:2
b) Bearish Entry (If CVD + ADX confirm downtrend):
Entry Zone: 19,845–19,860 (retest of support failure)
Target:
T1: 19,700
Stop-Loss (SL): 19,980
RR: Minimum 1:2
c) Position Sizing: Risk 1–2% of capital per trade.

Technical Breakdown on Gold Spot / USD (XAU/USD) | 1H TimeframeHere's a detailed technical breakdown of the Gold Spot / USD (XAU/USD), 1H timeframe chart using Volume Profile, Cumulative Volume Delta (CVD), and ADX:
1. Key Observations (Volume, Gann & CVD + ADX Focused)
a) Volume Profile Insights:
Value Area High (VAH): 3395.88
Value Area Low (VAL): 3311.18
Point of Control (POC): 3381.67 (recent) / 3311.18 (previous)
High-volume nodes: Concentrated around 3380–3390 and earlier at 3300–3320, suggesting strong buyer interest.
Low-volume gaps: Between 3350–3370, indicating weak resistance and potential for swift price movement.
b) Liquidity Zones:
Stop Clusters: Around 3400 (recent swing high), and 3310 (swing low/POC) — potential liquidity sweep zones.
Order Absorption: Strong delta buildup near 3380–3390 indicates heavy buying pressure and potential large-position accumulation.
c) Volume-Based Swing Highs/Lows:
Swing High (Volume Spike): 3395.88 – recent high with strong breakout volume.
Swing Low (Volume Spike): 3311.18 – confirmed reversal point with heavy absorption.
d) CVD + ADX Indicator Analysis:
Trend Direction: Uptrend (confirmed by multiple bullish CVD bars and higher highs).
ADX Strength: ADX > 20 with DI+ > DI- ⇒ Confirmed uptrend.
CVD Confirmation: Rising CVD with bullish price action = Strong demand confirmation. Market is led by aggressive buyers.
2. Support & Resistance Levels
a) Volume-Based Levels:
Support:
VAL: 3311.18
POC: 3381.67
Swing Low with Absorption: 3310
Resistance:
VAH: 3395.88
Swing High: 3400–3410 zone
b) Gann-Based Levels:
Gann Swing Low: 3311
Gann Swing High: 3395
Key Retracements (From 3311 to 3395):
1/2 level: 3353
1/3 level: 3339
2/3 level: 3367
3. Chart Patterns & Market Structure
a) Trend: Bullish
Supported by rising price structure, channel breakout, and rising CVD.
b) Notable Patterns:
Bullish channel forming (highlighted in purple).
Breakout above previous consolidation range (POC breakout).
Retest of POC at 3381.67 acting as support now.
4. Trade Setup & Risk Management
a) Bullish Entry (Confirmed by CVD + ADX):
Entry Zone: 3381–3385 (retest of POC/support).
Targets:
T1: 3410
T2: 3440
Stop-Loss (SL): Below swing low at 3350
RR: Minimum 1:2
b) Bearish Entry (Wait for breakdown of trend):
Entry Zone: 3310 (if price breaks below support).
Target:
T1: 3275
Stop-Loss (SL): Above 3350 (last high-volume rejection)
RR: Minimum 1:2
c) Position Sizing: Risk only 1–2% of capital per trade.

ETERNAL - Eternal Ltd. (2 hours chart, NSE) - Long PositionETERNAL - Eternal Ltd. (2 hours chart, NSE) - Long Position; short-term research idea.
Risk assessment: Medium {volume structure integrity risk}
Risk/Reward ratio ~ 2.36
Current Market Price (CMP) ~ 240
Entry limit ~239 to 237 (Avg. - 238) on May 05, 2025
1. Target limit ~ 247 (+3.78%; +9 points)
2. Target limit ~ 251 (+5.46%; +13 points)
Stop order limit ~ 232.5 (-2.31%; -5.5 points)
Disclaimer: Investments in securities markets are subject to market risks. All information presented in this group is strictly for reference and personal study purposes only and is not a recommendation and/or a solicitation to act upon under any interpretation of the letter.
LEGEND:
{curly brackets} = observation notes
= important updates
(parentheses) = information details
~ tilde/approximation = variable value
-hyphen = fixed value

Why Volume Bar Colors Can Mislead You█ The Truth Behind Volume Bars — What Do Green and Red Actually Mean?
Most traders learn early on that green volume bars mean bullish activity, and red bars mean bearish pressure. But is it really that simple? What does volume truly reflect, and are we making assumptions that can mislead us?
█ What Volume Actually Is
Volume represents the number of shares/contracts traded during a specific time interval. Every transaction includes both a buyer and a seller. So, volume itself doesn’t distinguish whether a trade was bullish or bearish. Instead, platforms color volume bars based on price movement:
Green: If price closed higher than it opened.
Red: If price closed lower than it opened.
Some platforms, like TradingView, allow you to color volume based on whether the price closed higher or lower than the previous candle’s close.
So YOU, as a trader, have the chance to decide whether to assign volume bars either bullish or bearish! It’s a setting parameter anyone can change. Traders around the globe might look at the same volume bar, but some interpret it as bearish, while others interpret it as bullish. What is the most correct way?
█ The Assumption Behind the Color
This coloring assumes that:
A rising price means buyers were more aggressive (lifting the ask).
A falling price means sellers were more aggressive (hitting the bid).
This is a proxy — an approximation. It simplifies market pressure into a binary outcome: if price goes up, it's bullish volume; if it goes down, it's bearish. But the market isn't always so binary.
However, the assumption is only an approximation of buying vs. selling. In reality, every single trade involves both a buyer and a seller, so volume itself isn’t inherently “buy” or “sell” – what matters is who initiated the trades. As one trading expert explains, talking about “buying volume” vs “selling volume” can be misleading: for every buyer there is a seller, so volume cannot be literally split into purchases and sales. Instead, what traders really mean by “bullish volume” is that buyers were more aggressive (lifting offers) and drove the price up, whereas “bearish volume” means sellers were more aggressive (hitting bids) and drove the price down. The colored volume bar is essentially a proxy for which side won the battle during that bar.
█ Why This Can Mislead You
Price might close higher, not because there were more buyers than sellers (there never are — every trade has both), but because buyers were more urgent. And sometimes price moves due to other forces, like:
Short covering.
Stop-loss runs.
Liquidity vacuums.
This means a green bar might not reflect strong demand, just urgency from the other side closing their positions.
⚪ Example:
Take the well-known GameStop short squeeze as an example. If you looked only at the volume bars during that rally, you’d see a wall of strong green candles and high volume, which might suggest aggressive bullish buying.
However, that interpretation would be misleading.
Under the surface, the surge wasn't driven by fresh bullish conviction — it was massive short covering. Traders who were short were forced to buy back shares to cover their positions, which drove prices even higher. The volume was categorized as bullish, but the true intent behind the move had nothing to do with new buying pressure.
This demonstrates why relying solely on volume color or candle direction can lead to false conclusions about market sentiment.
Does this simple up/down volume labeling truly reflect buying vs. selling pressure? To a degree, yes – it captures the net price outcome, which often corresponds to who was more aggressive. For example, if many buyers are willing to pay higher prices (demand), a bar will likely close up and be colored green, reflecting that buying interest. Conversely, if eager sellers are dumping shares and undercutting each other, price will drop, yielding a red bar that flags selling pressure. Traders often use rising volume on up-moves as confirmation of a bullish trend’s strength, and high volume on down-moves as a warning of distribution, which indeed aligns with traditional analysis
That said, the method has important limitations and nuances, documented both anecdotally and in research:
⚪ Volume is not one-dimensional: Since every trade has both a buyer and seller, one cannot literally count “buy volume” vs “sell volume” without more information. The green/red coloring is a blunt classification based on price direction, not an actual count of buys or sells. It assumes the price change direction is an adequate proxy for the imbalance of buying vs. selling. This is often true in a broad sense, but it’s not a precise measure of order flow.
⚪ Intrabar Dynamics Are Lost: A single bar’s color only tells the end result of that interval, not the story of what happened during the bar. For instance, a 4-hour candle might be red (down) overall, but it could have contained three hours of rally (buying) followed by a steep selloff in the final hour that erased the gains. The volume bar will be colored red due to the net price drop, even though significant buying occurred earlier in the bar. In other words, a large red bar can mask that there were pockets of bullish activity within – the selling just happened to win out by the close of that period. Without looking at smaller time frames or detailed data, one can’t tell from a single color how the buying/selling tug-of-war progressed within the bar.
⚪ Gap Effects and Criteria Choices: The choice of using open vs. close or previous close can alter the interpretation of volume. As discussed, a day with a big gap can be labeled differently under the two methods. Neither is “right” or “wrong” – they just highlight different perspectives (intraday momentum vs. day-over-day change). Traders should be aware that colored volume bars are an approximation. A green volume bar under one method might turn red under the other method for the same bar. This doesn’t mean volume changed – it means the classification scheme changed. For example, a stock that closes below its open but still higher than yesterday will show a red volume bar by the intraday method but would be considered an “up-volume day” in OBV terms (previous close method).
⚪ No Indication of Magnitude or Commitment: A single color also doesn’t convey how much buying or selling pressure there was, only which side won. Two green volume bars might both be green, but one could represent a modest uptick with tepid buying, whereas another could represent an aggressive buying spree – the color alone doesn’t distinguish this (other than one bar likely being taller if volume was higher). Traders often need to consider volume relative to average (e.g. using volume moving averages or looking for volume spikes) to judge the significance of a move, not just the color.
█ Summary
The coloring of volume bars is a visual shortcut, not an exact science. It’s a guess based on price direction — useful, but imperfect. Understanding this helps traders avoid reading too much into what a green or red volume bar actually means.
-----------------
Disclaimer
The content provided in my scripts, indicators, ideas, algorithms, and systems is for educational and informational purposes only. It does not constitute financial advice, investment recommendations, or a solicitation to buy or sell any financial instruments. I will not accept liability for any loss or damage, including without limitation any loss of profit, which may arise directly or indirectly from the use of or reliance on such information.
All investments involve risk, and the past performance of a security, industry, sector, market, financial product, trading strategy, backtest, or individual's trading does not guarantee future results or returns. Investors are fully responsible for any investment decisions they make. Such decisions should be based solely on an evaluation of their financial circumstances, investment objectives, risk tolerance, and liquidity needs.

Gold After breaking the downtrend line, the volume zone and the moving averages, we will start buying now.

Technical Breakdown on US100 | 1H TimeframeTechnical Breakdown on US100 (1H) using Volume Profile, Gann, and CVD + ADX
1. Key Observations (Volume, Gann & CVD + ADX Focused)
a) Volume Profile Insights:
Value Area High (VAH): 20,050
Value Area Low (VAL): 19,800
Point of Control (POC): 19,927.77
Volume Nodes:
High-volume node: Consolidation around 19,930–20,000 (strong interest/acceptance zone).
Low-volume gap: Below 19,800 (potential area for fast price movement).
b) Liquidity Zones:
Clustered Stops:
Above recent highs at ~20,100 (liquidity trap).
Below recent lows near 19,650 and 19,500.
Order Absorption Zones:
Near 19,930–19,980: multiple rejections + high delta volume = passive sell pressure.
c) Volume-Based Swing Highs/Lows:
Volume spike highs: 20,050 (indicating rejection and potential reversal).
Volume spike lows: 19,600–19,650 (reaction points with increased volume and defense).
d) CVD + ADX Indicator Analysis:
Trend Direction: Turning bearish.
ADX Strength:
ADX slightly above 20 with DI- crossing above DI+ = Confirmed downtrend.
CVD Confirmation:
Falling CVD alongside price weakness = Strong supply taking control.
Multiple failed bullish attempts above POC.
2. Support & Resistance Levels
a) Volume-Based Levels:
Support:
19,800 (VAL)
19,650 (swing low with high absorption)
Resistance:
20,050 (VAH and rejection zone)
19,927.77 (POC, now resistance)
b) Gann-Based Levels:
Swing High: 20,100 (Gann reversal point)
Swing Low: 19,650
Key Gann Retracements:
1/3 retracement = ~19,820
2/3 retracement = ~19,980
3. Chart Patterns & Market Structure
a) Trend: Bearish
b) Notable Patterns:
Bearish flag forming inside descending channel.
Break below POC and VAL suggests breakdown continuation.
Retest failure near POC confirms resistance validation.
4. Trade Setup & Risk Management
a) Bearish Entry (CVD + ADX confirm downtrend):
Entry Zone: 19,920–19,940 (retest of POC)
Target:
T1: 19,650
T2: 19,400
Stop-Loss (SL): 20,060 (above VAH and swing high)
Risk-Reward (RR): Minimum 1:2
b) Position Sizing:
Risk only 1–2% of trading capital per setup.

Technical Breakdown on Gold Spot / USD (XAU/USD) | 1H TimeframeHere is a full professional breakdown of the attached XAU/USD 1H chart (Gold Spot) using Volume Profile, Gann levels, CVD + ADX structure.
1. Key Observations (Volume, Gann & CVD + ADX Focused)
a) Volume Profile Insights
Value Area High (VAH): $3,364.00
Value Area Low (VAL): $3,314.00
Point of Control (POC):
Current session: $3,314.78
Previous key zone: $3,257.03
Volume Node Analysis:
High-Volume Nodes: Around $3,314 and $3,257 – shows strong institutional interest and base-building.
Low-Volume Gaps: Between $3,285–$3,305 – fast move zones, expect volatility on re-entry.
b) Liquidity Zones
Buy-side Liquidity (stops above): Near $3,364 and projected $3,400+
Sell-side Liquidity (stops below): $3,314 (POC), $3,257 (previous POC), $3,245
Absorption Zones: Heavy volume observed near $3,314 and $3,257
c) Volume-Based Swing Highs/Lows
Swing Low Support: $3,257 (confirmed with POC and structure)
Swing High Resistance: $3,364 (local high tested)
d) CVD + ADX Indicator Analysis
Trend Direction: Uptrend – confirmed by rising price action + volume support
ADX Strength: > 20 and DI+ > DI- → Confirmed Uptrend
CVD Confirmation: Strong uptrend alignment – CVD is rising with price → indicates strong demand
2. Support & Resistance Levels
a) Volume-Based Levels
Support:
$3,314 (POC – session)
$3,257 (Major POC)
$3,245 (historical volume cluster)
Resistance:
$3,364 (recent high / VAH)
$3,400 (psychological round number + potential stop cluster)
b) Gann-Based Levels
Recent Swing Low (Gann): $3,257
Recent Swing High (Gann): $3,364
Retracements from $3,364 High:
1/3: $3,328
1/2: $3,310
2/3: $3,292
3. Chart Patterns & Market Structure
a) Trend:
Bullish Trend – Higher highs and higher lows with volume confirmation
b) Notable Patterns:
Breakout from consolidation at $3,314
Potential Bullish Flag/Wedge forming inside the channel
Retest possible near $3,314–$3,292 for continuation
4. Trade Setup & Risk Management
a) Bullish Entry
Entry Zone: $3,314–$3,292 (retest of breakout and channel base)
Targets:
T1: $3,400
T2: $3,440–$3,480 (upper channel bound)
Stop-Loss (SL): Below $3,257
Risk-Reward: Minimum 1:2
b) Bearish Entry
Only valid on break and close below $3,257
Entry Zone: $3,257
Target: $3,220
Stop-Loss (SL): Above $3,292
Risk-Reward: Minimum 1:2
c) Position Sizing
Risk only 1-2% of capital per trade

Choosing the Right TimeframeHey traders and investors!
Selecting the right timeframe can reveal a clear picture of price movement. But don’t forget — the higher timeframe always has priority.
🔹 On the 12H, Bitcoin is in a sideways range.
The move from 78,500 to 95,000 could’ve been anticipated — a buyer Decision candle (IKC) formed at the lower boundary of the range gave a strong signal.
The boundaries of the range are marked with black lines on the chart.
What about now?
🔸 No signs of strong selling.
🔸 The last Decision candle (IKC) at the top of the range belongs to the buyer.
🔸 The buyer has already taken out its high.
📉 For shorts — we need seller strength, ideally with price moving below 91,660.
📈 Longs can be considered on lower timeframes, aiming for their local targets.
Not every timeframe gives clear context.
What timeframes do you use to analyze and find trade setups?
This analysis is based on the Initiative Analysis concept (IA).
Wishing you profitable trades!

EUR / GBP We will wait for a close above the moving averages and the volume zone and a breakout of the downtrend line to buy.

Potential buying opportunity on UNH!OptionsMastery:
🔉Sound on!🔉
📣Make sure to watch fullscreen!📣
Thank you as always for watching my videos. I hope that you learned something very educational! Please feel free to like, share, and comment on this post. Remember only risk what you are willing to lose. Trading is very risky but it can change your life!

AUD USD Long Position. Audusd is at the highest point in the last 3 months and also is at an imbalance (low volume node). The weekly (last week) and daily market profiles from last week (friday) suggested a reversal in price due to demand drying up, but the aggressive surplus of buy imbalances marked by the 2hr footprint chart show sellers are being absorbed and demand is still willing to go higher.
Trade snapshots for proof:
ibb.co
ibb.co
ibb.co
ibb.co
ibb.co
ibb.co

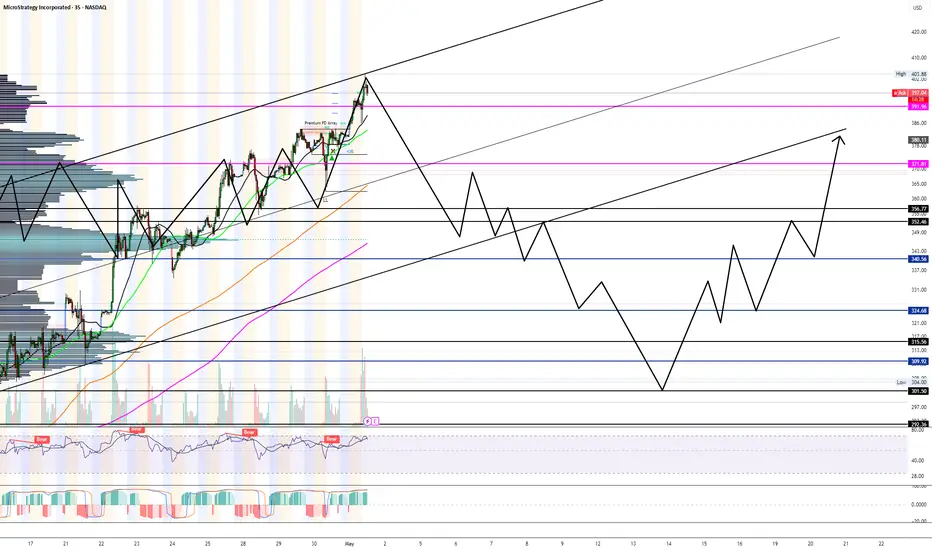
I think were due for bad earnings reaction for once.As seen in the chart, we are at the top of the range with highly over extended price movement and hitting the largest target number at $400 which has been sought after for months.
I think a snap down to $360-$350 is inevitable.
If we do pop up to $420+ then its a blow off top unless market reacts positively to government involvement to crypto.

Silver sellAfter the price breaks the uptrend line and moving averages and closes below the volume zone, we will enter a sell now.

Netweb-a breakout stock to watchNetweb has recorded stellar quarterly results- double digit earnings and revenue growth YoY. But stock has not performed since market was unfavorable and it has stored pent up energy of strong earnings backing. Now stock has reached a resistance zone on daily chart that too with a humungous volume. Today its quarterly earnings were announced and yet again stock has delivered very good results. It's a good breakout stock to watch.

AUD/USD continue with the UptrendOn AUD/USD , it's nice to see a strong buying reaction at the price of 0.64470 .
There's a significant accumulation of contracts in this area, indicating strong buyer interest. I believe that buyers who entered at this level will defend their long positions. If the price returns to this area, strong buyers will likely push the market up again.
Strong S/R zone from the past + Uptrend and high volume cluster are the main reasons for my decision to go long on this trade.
Happy trading
Dale

EUR/USD - Day Trading Analysis With Volume ProfileOn EUR/USD , it's nice to see a strong sell-off from the price of 1.13600. It's also encouraging to observe a strong volume area where a lot of contracts are accumulated.
I believe that sellers from this area will defend their short positions. When the price returns to this area, strong sellers will push the market down again.
Fair Value GAP (FVG) and Volume cluster are the main reasons for my decision to go short on this trade.
Happy trading,
Dale

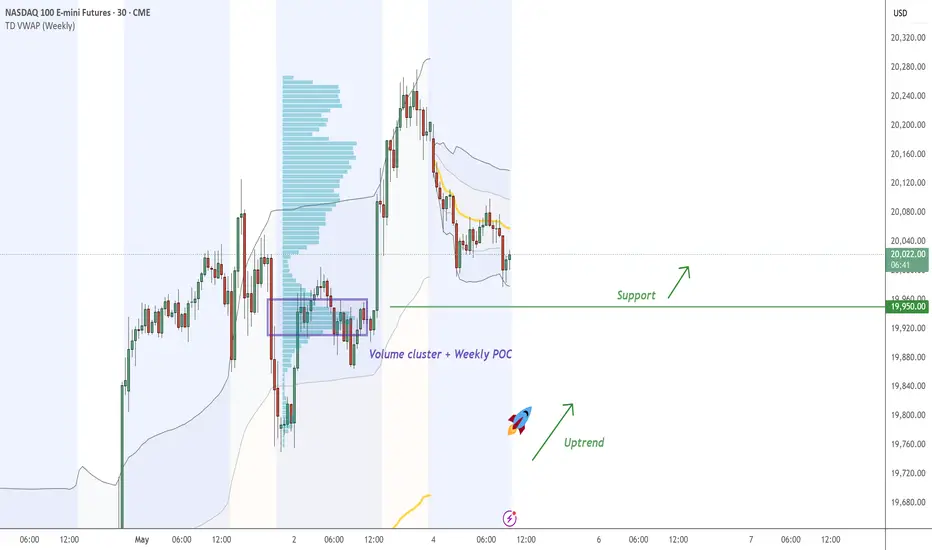
NQ continue with the UptrendOn NQ , it's nice to see a strong buying reaction at the price of 19950 .
There's a significant accumulation of contracts in this area, indicating strong buyer interest. I believe that buyers who entered at this level will defend their long positions. If the price returns to this area, strong buyers will likely push the market up again.
Uptrend and high volume cluster + Weekly POC are the main reasons for my decision to go long on this trade.
Happy trading
Dale
Technical Breakdown on Gold Spot / USD (XAU/USD) | 1H TimeframeTechnical Breakdown on Gold Spot (XAU/USD) – 1H Chart using Volume Profile, Gann, and CVD + ADX
1. Key Observations (Volume, Gann & CVD + ADX Focused)
a) Volume Profile Insights:
Value Area High (VAH): 3,312
Value Area Low (VAL): 3,230
Point of Control (POC):
High-Volume Nodes: Dense cluster near 3,229–3,250 and again around 3,312
Low-Volume Gaps: Noticeable void between 3,260 – 3,290, suggesting possible fast movement zone
b) Liquidity Zones:
Liquidity Pools:
Order Absorption:
c) Volume-Based Swing Highs/Lows:
Swing High (Volume Spike): 3,312 – area of rejection with reduced follow-through
Swing Low (Reversal Support): 3,230 – heavy volume absorption followed by rally
d) CVD + ADX Indicator Analysis:
Trend Direction: Currently shifting bullish after a prolonged downtrend
ADX Strength: ADX > 20 with DI+ > DI- (early bullish momentum building)
CVD Confirmation:
2. Support & Resistance Levels
a) Volume-Based Levels:
Support:
Resistance:
b) Gann-Based Levels:
Swing Low: 3,230
Retracement Levels:
3. Chart Patterns & Market Structure
a) Trend: Turning bullish (CVD rising, ADX > 20, price forming HLs)
b) Notable Patterns:
Reversal Base formed near 3,230 with upward breakout
Forming ascending channel – prices respecting the lower boundary support
Retest of breakout zone (POC + lower trendline) acting as potential launchpad
4. Trade Setup & Risk Management
a) Bullish Entry (CVD + ADX confirm uptrend):
Entry Zone: 3,240–3,250 (near lower trendline + POC retest)
Targets:
Stop-Loss (SL): 3,225 (below POC + swing low)
RR: Approx. 1:2.5
b) Bearish Entry (Only if trend reversal confirmed):
Entry Zone: Below 3,225 (loss of POC/VAL with CVD breakdown)
Target: T1: 3,200 (psychological + historical support zone)
Stop-Loss (SL): 3,255 (back above POC)
RR: Approx. 1:2
c) Position Sizing:
Use 1–2% capital per trade to manage downside risk

Technical Breakdown on US 100 | 1H TimeframeTechnical Breakdown on US100 1H Chart using Volume Profile, Gann, and CVD + ADX
1. Key Observations (Volume, Gann & CVD + ADX Focused)
a) Volume Profile Insights:
Value Area High (VAH): 20,035 (approx. from most recent high-volume node)
Value Area Low (VAL): 19,710
Point of Control (POC):
High-Volume Nodes: Clustered between 19,850 – 20,050 (heavy volume activity)
Low-Volume Gaps: Between 19,700 – 19,800 (could act as fast move zones)
b) Liquidity Zones:
Liquidity Pools:
Order Absorption: Observed near 19,850 (buy side absorption with wicks and CVD reaction)
c) Volume-Based Swing Highs/Lows:
Swing High: 20,035 with volume tapering and price exhaustion
Swing Low: 19,710 showing high delta rebound and large wick
d) CVD + ADX Indicator Analysis:
Trend Direction: Uptrend (price making HH/HL, supported by rising channel)
ADX Strength: ADX > 20, DI+ > DI- → Confirmed bullish trend
CVD Confirmation:
2. Support & Resistance Levels
a) Volume-Based Levels:
Support:
Resistance:
b) Gann-Based Levels:
Recent Swing Low: 19,710 (1/3 retracement zone)
Key Retracement Levels:
3. Chart Patterns & Market Structure
a) Trend: Bullish (confirmed by ADX > 20 and CVD rising)
b) Notable Patterns:
Bullish Ascending Channel clearly forming with higher lows
Price pulled back to mid-channel + POC confluence, showing signs of retest and continuation
No major bearish reversal patterns yet; healthy pullback structure
4. Trade Setup & Risk Management
a) Bullish Entry (CVD + ADX confirm uptrend):
Entry Zone: 19,850–19,875 (POC retest + trendline support)
Targets:
Stop-Loss (SL): 19,700 (below VAL and swing low)
RR: ~1:2.5
b) Bearish Entry (Only on breakdown):
Entry Zone: Below 19,700 (VAL loss + CVD breakdown)
Target: T1: 19,422.18 (previous POC support)
Stop-Loss (SL): 19,860 (back above trendline/POC)
RR: ~1:2
c) Position Sizing:
Risk only 1-2% of capital per trade for controlled exposure

USDCAD Monthly – Seller Initiative in PlayHey traders and investors!
Take a look at the monthly chart of USDCAD.
The price has been in a sideways range for quite some time, and the seller initiative is currently active.
📌 At the upper boundary of the range, a seller zone (red box) has formed, along with a seller-side Decision bar (IKC), which has now hit the buyer zone (blue box).
⚠️ With this structure, it makes more sense to look for short setups.
This analysis is based on the Initiative Analysis concept (IA).
Wishing you profitable trades!
