Going long on SolanaBINANCE:SOLUSDT
Solana has experienced climatic volume to the downside, bullish RSI divergence, and now it seems ready for a big bounce. Also, there is a Hammer candlestick at the bottom of the decline.
Good luck to you
Volume

NIFTY Index View - May 02, 2025The index has been moving sideways since last few days this week but has moved upwards with fine volume as we had analyzed on Tuesday (April 29th).
The index still looks strong enough to continue the trend further upwards.

SPY at 3 important event! POC, 200 ema and 30 days reversalHi All SPY is at an interesting intersection:
1) a month from where it crashed and reversed entirely
2) At point of control (POC) from the top in Feb
3) at 200 ema
In Aug 22 SPY reversed from POC, at other times it found support or broke out with a gap
My opinion is, it will continue going up till 13th May (date when CPI is published). Nobody knows for sure how much tariff will impact CPI. It cannot as bad as we had during covid.

NVDA LTFLocal price action - the gap from 4/29 was filled in, but it left another gap on 4/30. During aftermarket hours, the price jumped up and approached the weekly level above but got rejected and finished the day red. We got a naked untapped pivot point below along with the range POC point of control.. not a bad week of price action.
From a range perspective price deviated to both sides and finisheded the day seemingly falling back into range. Let's see how the week ends.

Nvda low time frameLocal price action - the gap from 4/29 was filled in, but another was left on 4/30. During aftermarket hours the price jumped up to approach the weekly level above and dropped back down. We got a naked untapped pivot point below along with the range POC point of control, not a bad week of price action.

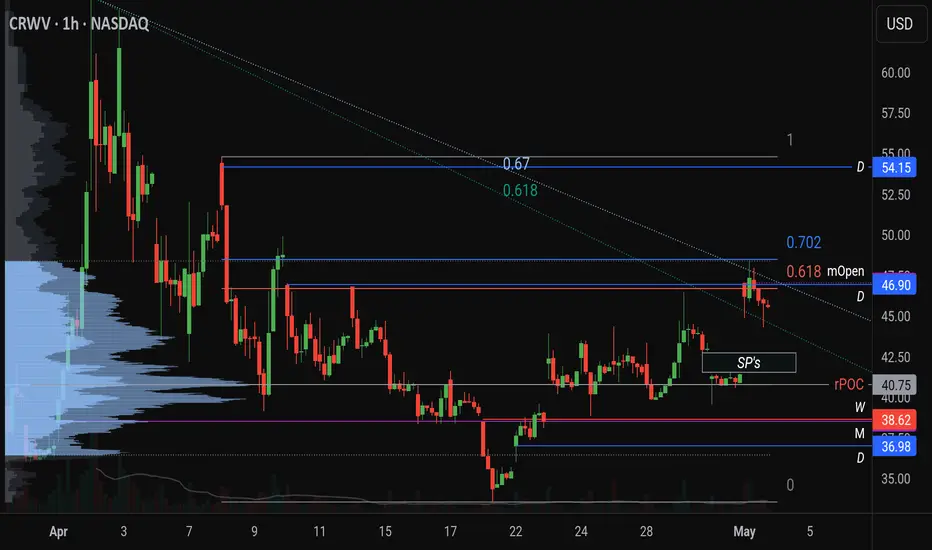
First lookFirst look at CRWV, some basic monthly weekly daily levels, range POC point of control, and a speed resistance fan, which price shot up into at the moment. If I was looking to get involved I'd wait for a slight retrace into the SP below left behind because of the gap that was left from the day before
NZD / CHF I will wait for the breakout of the volume zone and the moving averages and close below them to sell.

CAD / CHF SELL NOWWe can sell now after breaking the uptrend line and closing below the volume zone.

Gold — Buyer Power or Pause?The monthly candle closed as a strong buyer candle with significant volume.
This shows strong interest from both buyers and sellers at current levels.
Yesterday, on the daily timeframe, a seller-side IKC appeared (IKC or decision candle — the highest-volume candle within initiatives inside a sideways range).
That puts the current long targets into question — we now need to see a clear show of buyer strength.
📉 The price is currently near the 50% level of the weekly initiative — 3228.382, which could attract buyers.
Below that, daily support zones are marked on the chart at 3193 and 3167, where the buyer may regain initiative.
🔎 To consider long entries, we need to see:
• Buyer strength, and
• Price returning above 3260.
This analysis is based on the Initiative Analysis concept (IA).
Wishing you profitable trades!

MLM - Martin Marietta Material, Inc. (Daily chart, NYSE) - LongMLM - Martin Marietta Material, Inc. (Daily chart, NYSE) - Long Position; Short-term research idea.
Risk assessment: Medium {volume & support structure integrity risk}
Risk/Reward ratio ~ 2.79
Current Market Price (CMP) ~ 490
Entry limit ~ 485 on April 22, 2025
1. Target limit ~ 504 (+3.92%; +19 points)
2. Target limit ~ 524 (+8.04%; +39 points)
Stop order limit ~ 471 (-2.89%; -14 points)
Disclaimer: Investments in securities markets are subject to market risks. All information presented in this group is strictly for reference and personal study purposes only and is not a recommendation and/or a solicitation to act upon under any interpretation of the letter.
LEGEND:
{curly brackets} = observations
= important updates
(parentheses) = information
~ tilde/approximation = variable value
-hyphen = fixed value


Carnival Corporation (2 hours chart, NYSE) - Long PositionCCL - Carnival Corporation (2 hours chart, NYSE) - Long Position; Short-term research idea.
Risk assessment: High {volume & support structure integrity risk}
Risk/Reward ratio ~ 2.33
Current Market Price (CMP) ~ 18.53
Entry limit ~ 18.30 to 18.10 (Avg. -18.20) on April 24, 2025
1. Target limit ~ 19.20 (+5.49%; +1 point)
2. Target limit ~ 19.60 (+7.69%; +1.4 points)
Stop order limit ~ 17.6 (-3.3%; -0.6 points)
Disclaimer: Investments in securities markets are subject to market risks. All information presented in this group is strictly for reference and personal study purposes only and is not a recommendation and/or a solicitation to act upon under any interpretation of the letter.
LEGEND:
{curly brackets} = observations
= important updates
(parentheses) = information
~ tilde/approximation = variable value
-hyphen = fixed value

AUDUSD - Daily chart, OANDA) - Long; Mid-term research idea.AUDUSD - Australian Dollar / U.S. Dollar (Daily chart, OANDA) - Long Position; Mid-term research idea.
Risk assessment: High {volume & support structure integrity risk}
Risk/Reward ratio ~ 2.5
Entry limit ~ 0.63800 on April 30, 2025
1. Target limit ~ 0.67800 (+6.27%; +0.04000 points)
2. Target limit ~ 0.65715 (+3%; +0.01915 points)
Stop order limit ~ 0.62200 (-2.51%; -0.01600 points)
Disclaimer: Investments in securities markets are subject to market risks. All information presented in this group is strictly for reference and personal study purposes only and is not a recommendation and/or a solicitation to act upon under any interpretation of the letter.
LEGEND:
{curly brackets} = observations
= important updates
(parentheses) = information
~ tilde/approximation = variable value
-hyphen = fixed value

QCOM Q1 EARNINGSQCOM is currently between two strong resistance levels above, and has solid support around the 120 level. If earnings are strong and he beats expectations, it's very likely the price will retest the upper range. If earnings miss, it would likely drop down to the double bottom.

META Q1 EARNINGSMeta reports earnings today. The stock is positioned between two possible EPS outcomes. If the company reports strong results and achieves an EPS of $5, it could break through the intermediate resistance level. If the results are not favorable, the stock may retest the double bottom.

MSFT Q1 EARNINGSMicrosoft Earnings Presentation. We have a strong resistance area that we need to break. If we break through that area, we would move toward the second resistance zone, with strong support at 355.
If MSFT report strong earnings, the stock could move toward the $420 area, where it reached during the last earnings release.

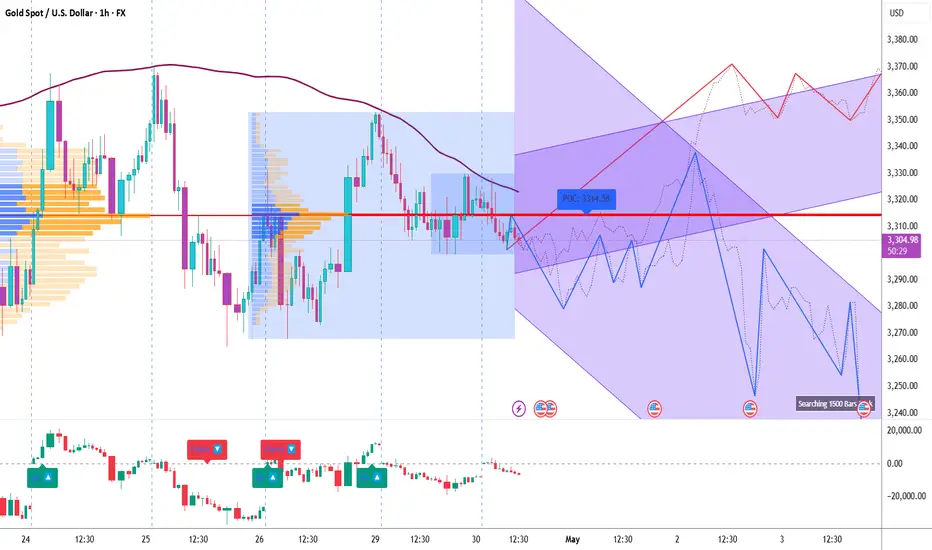
Technical Breakdown on Gold Spot / USD (XAU/USD) | 1H Timeframe
Here’s the detailed breakdown of the Gold Spot / USD (XAU/USD) 1H Chart based on Volume Profile, Gann analysis, and custom indicators (CVD + ADX):
1. Key Observations (Volume, Gann & CVD + ADX Focused)
a) Volume Profile Insights:
• Value Area High (VAH): 3325.00
• Value Area Low (VAL): 3302.00
• Point of Control (POC): 3314.58
• High-volume nodes: Notable clustering around 3310–3325 zone, suggesting accumulation.
• Low-volume gaps: 3340–3360 zone shows thin profile—potential breakout area if breached.
b) Liquidity Zones:
• Liquidity Clusters:
o Upside: Prior highs near 3360 and 3380 may have stop orders.
o Downside: 3280–3290 (recent swing lows) likely holding short-term stops.
• Absorption Zones: Strong absorption observed just below POC (3305–3310), indicating defense by buyers.
c) Volume-Based Swing Highs/Lows:
• Swing High (Volume Spike): 3360 on April 26 – high rejection with strong sell volume.
• Swing Low (Volume Spike): 3285 on April 25 – major buying tail, reversal support zone.
d) CVD + ADX Indicator Analysis:
• Trend Direction: Currently range-bound; no clean directional move post 28th April.
• ADX Strength:
o ADX < 20: Weak trend environment
o DI+ ≈ DI-: Confirms lack of clear directional bias
• CVD Confirmation:
o Neutral to slightly rising CVD, indicating moderate demand but not dominant
o No divergence between price and CVD—suggests indecision
________________________________________
2. Support & Resistance Levels
a) Volume-Based Levels:
• Support:
o VAL: 3302.00
o POC: 3314.58
o Swing low: 3285.00 (with high delta absorption)
• Resistance:
o VAH: 3325.00
o Swing highs: 3360.00 and 3380.00
b) Gann-Based Levels:
• Gann Swing High: 3360 (April 26)
• Gann Swing Low: 3285 (April 25)
• Key Retracements:
o 1/2: 3322.5
o 1/3: 3310
o 2/3: 3340
________________________________________
3. Chart Patterns & Market Structure
a) Trend: Range-bound (confirmed by flat ADX and neutral CVD)
b) Notable Patterns:
• Descending triangle forming between 3325 (horizontal resistance) and lower highs
• Potential breakout scenario if price clears 3325 with volume
• Retests of POC at 3314 providing short-term scalping setups
________________________________________
4. Trade Setup & Risk Management
a) Bullish Entry (If CVD + ADX confirm uptrend):
• Entry Zone: 3310–3315
• Targets:
o T1: 3340
o T2: 3360
• Stop-Loss (SL): 3295 (below VAL)
• RR: Minimum 1:2
b) Bearish Entry (If CVD + ADX confirm downtrend):
• Entry Zone: 3325–3330
• Target:
o T1: 3285
• Stop-Loss (SL): 3345 (above recent swing high)
• RR: Minimum 1:2
c) Position Sizing: Risk only 1-2% of capital per trade
APOLLOTYRE - Apollo Tyres Ltd (2 hours chart, NSE) - Long PositiAPOLLOTYRE - Apollo Tyres Ltd. (2 hours chart, NSE) - Long Position; short-term research idea.
Risk assessment: Medium {volume structure integrity risk}
Risk/Reward ratio ~ 2.68
Current Market Price (CMP) ~ 470
Entry limit ~ 464.50 on April 30, 2025
1. Target limit ~ 481 (+3.55%; +16.5 points)
2. Target limit ~ 498 (+7.21%; +33.5 points)
Stop order limit ~ 452 (-2.69%; -12.5 points)
Disclaimer: Investments in securities markets are subject to market risks. All information presented in this group is strictly for reference and personal study purposes only and is not a recommendation and/or a solicitation to act upon under any interpretation of the letter.
LEGEND:
{curly brackets} = observation notes
= important updates
(parentheses) = information details
~ tilde/approximation = variable value
-hyphen = fixed value

1. SMC-Based Chart Reading Timeframe: 4H Price Action Summary:
•Strong bullish impulse previously, followed by a clear correction phase.
•Price is bouncing between clean demand and supply OBs.
•Market is now reacting from a demand block, filling in an Imbalance/FVG (Fair Value Gap).
•Multiple liquidity pools marked via sessions and time-based highs (2:30am & 6:30am).
⸻
2. Marked Points in Chart
•Last Day High: 3,353.297 — a key liquidity magnet (untouched).
•50% Day Range: ~3,305 – the market recently broke above it, showing strength.
•Last Day Low: ~3,280 – respected multiple times (demand zone).
• 2:30 am & 6:30 am Highs: Session-based liquidity targets.
•Imbalance (FVG): Being filled — buyers reacting to unmitigated value.
•Return Line: Classic SMC technique for retracement target (OB re-entry).
⸻
3. Swing Low & High (Day/4H)
•Swing High (4H): ~3,360 – 3,400 (upper supply zone)
•Swing Low (4H): 3,268 – 3,280 (demand zone at the base)
•Current Internal High: 3,343
•Current Internal Low: 3,280
Price is currently attempting to form higher low structure = Possible bullish continuation if it holds above 3,308.
⸻
4. Trade Direction
Bias: Bullish Intraday / Reversal Pending Swing
•Price is breaking above 50% range and holding above the FVG/demand block.
•Next liquidity targets are session highs (3,343) and then last day high (3,353).
•If price holds above 3,305 and breaks 3,343, this confirms bullish continuation.
⸻
5. Best Risk-Reward Ratio Setup
Buy Setup (Best Trade Idea)
• Entry Zone: 3,308 – 3,315 (retest of demand + FVG)
• SL: Below 3,300 or safer at 3,295
• TP1: 3,343 (session high)
• TP2: 3,353 (liquidity at last day high)
• TP3: 3,360 – 3,380 (supply OB)
Entry SL TP1 TP2 TP3 RRR
3,310 3,295 3,343 3,353 3,380 1:2.2 / 1:2.8 / 1:4.6
Key Note:
• If you’re conservative: secure partial profits at TP1.
• Let partial ride to TP2/TP3 for maximum RRR.
⸻
6. CRT Model Evaluation
CRT Flow:
CRT Element Present? Notes
Change of Character (ChoCh) Yes, from bearish to bullish at 3,280 OB zone
Reversal Yes Price formed a higher low, left FVG, and reclaimed 50% day range
Trend Continuation Building Needs clean break of 3,343 to target 3,353–3,360
=> The CRT Model confirms a pending bullish continuation if the price holds current levels and the session is reclaimed high.
⸻
Final Trade Summary
Parameter Value
Trend Bias Bullish
Swing High (4H) 3,360–3,400
Swing Low (4H) 3,268–3,280
Entry Zone 3,310 (FVG retest)
SL Below 3,295
TP1 / TP2 / TP3 3,343 / 3,353 / 3,380
CRT Phase Reversal to Trend Continuation
RRR Potential 1:2.2 to 1:4.5

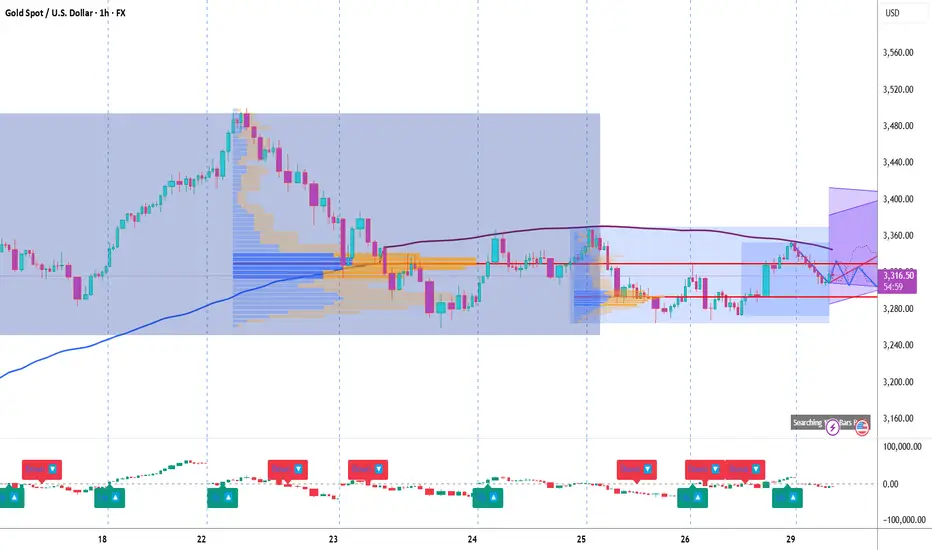
Technical Breakdown on Gold Spot / USD (XAU/USD) | 1H TimeframeHere’s the detailed breakdown of the Gold Spot / USD (XAU/USD) 1H Chart based on Volume Profile, Gann analysis, and custom indicators (CVD + ADX):
1. Key Observations (Volume, Gann & CVD + ADX Focused)
a) Volume Profile Insights:
• Value Area High (VAH): 3,343.00
• Value Area Low (VAL): 3,278.50
• Point of Control (POC):
o Current session: 3,293.34
o Previous session: 3,329.53
• High-volume nodes:
o Around 3,293-3,300 (recent acceptance area)
• Low-volume gaps:
o Between 3,315 - 3,330 (thin volume, price may move quickly through)
b) Liquidity Zones:
• Stops likely above recent swing high: 3,343 (VAH area).
• Stops likely below recent swing low: 3,278 (VAL area).
• Absorption (high delta volume) noted near 3,290-3,300 (potential strong demand zone).
c) Volume-Based Swing Highs/Lows:
• Swing high at 3,343 with notable rejection and high-volume rejection candle.
• Swing low at 3,278.5 where volume spiked and buying pressure emerged.
d) CVD + ADX Indicator Analysis:
• Trend Direction: Currently slight bullish bias (CVD showing positive divergence).
• ADX Strength:
o ADX < 20 (currently weak trend, range-bound behavior likely).
• CVD Confirmation:
o Recent rising CVD with bullish price action = demand emerging.
________________________________________
2. Support & Resistance Levels
a) Volume-Based Levels:
• Support:
o VAL: 3,278.50
o POC: 3,293.34
• Resistance:
o VAH: 3,343.00
o Previous swing high: 3,343
b) Gann-Based Levels:
• Confirmed Gann swing low: 3,278
• Confirmed Gann swing high: 3,343
• Key retracement levels:
o 1/2 Retracement: ~3,310.5
o 1/3 Retracement: ~3,300
o 2/3 Retracement: ~3,320
________________________________________
3. Chart Patterns & Market Structure
a) Trend:
• Range-bound to slight bullish bias (based on ADX low + CVD rising).
b) Notable Patterns:
• Potential ascending channel forming (highlighted in purple).
• Breakout attempt from range, but not confirmed with strong volume yet.
• Minor flag pattern in consolidation near 3,293-3,300.
________________________________________
4. Trade Setup & Risk Management
a) Bullish Entry (If CVD + ADX confirm uptrend):
• Entry Zone: 3,293.50 – 3,295.00
• Targets:
o T1: 3,320
o T2: 3,343
• Stop-Loss (SL): 3,278
• RR: Minimum 1:2
b) Bearish Entry (If CVD + ADX confirm downtrend):
• Entry Zone: 3,343 (retest of VAH)
• Target:
o T1: 3,300
• Stop-Loss (SL): 3,355 (above prior swing high)
• RR: Minimum 1:2
c) Position Sizing:
• Risk 1-2% of capital per trade only.
Bitcoin Update: Sell or Wait?Hey traders and investors!
An interesting setup on Bitcoin.
On the 1H timeframe, the market is in a sideways range. The current initiative belongs to the sellers. A clear target is marked on the chart. We also have a seller Decision candle, and a seller zone has formed within its range — a strong signal for short setups.
However, on the daily timeframe, the buyers are still in control, and yesterday’s session closed with increased volume.
On the other hand, Friday also showed a volume spike — but without any meaningful result, and the same happened yesterday.
Sell or not? That’s the question...
The 94,900 level might give us the answer.
This analysis is based on the Initiative Analysis concept (IA).
Wishing you profitable trades!

Gold BuyAfter breaking the downtrend line and the volume zone and closing above the moving averages, we will start buying.

