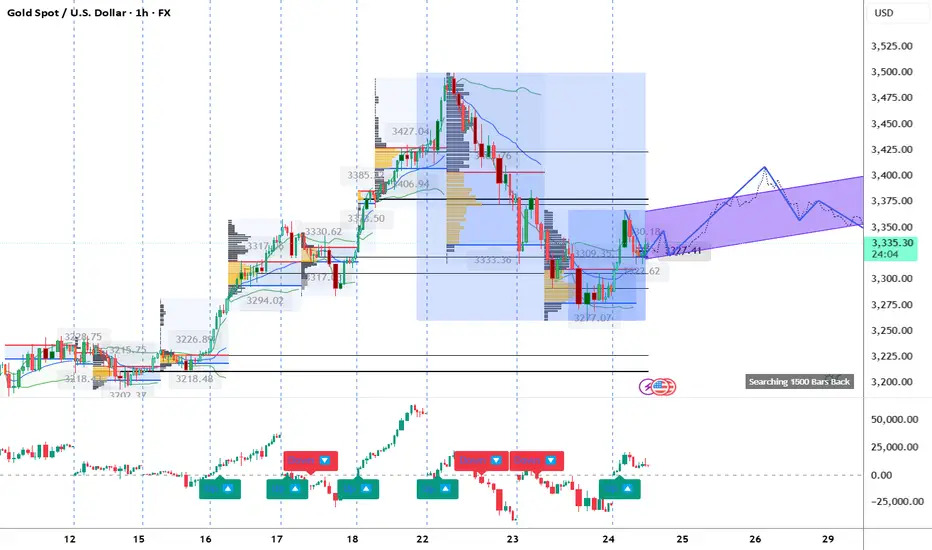
Technical Breakdown on Gold Spot / USD (XAU/USD) | 1H TimeframeTools Used: Volume Profile, Gann Levels, Cumulative Volume Delta (CVD) + ADX
1. Key Observations (Volume, Gann & CVD + ADX Focused)
a) Volume Profile Insights:
Value Area High (VAH): 3,390.67
Value Area Low (VAL): 3,277.14
Point of Control (POC): 3,309.96
High-volume nodes: Prominent between 3,300–3,340 zone, where price consolidated and re-accumulated.
Low-volume gaps: Seen between 3,365–3,385 and under 3,277, ideal for fast moves if broken.
b) Liquidity Zones:
Stops Likely Clustered:
Above 3,390 (last high).
Below 3,277 (recent low and VAL).
Absorption Zones (based on delta volume):
Notable order absorption around POC (3,309.96) – heavy trade activity and hold in down move.
c) Volume-Based Swing Highs/Lows:
High-volume swing low: 3,277.07 – price bounced with demand pick-up.
High-volume swing high: 3,427.04 – volume faded after breakout, leading to rejection.
d) CVD + ADX Indicator Analysis:
Trend Direction: Currently uptrend forming, CVD rising slightly with bullish structure.
ADX Strength:
ADX ~22 and DI+ > DI-: Confirms beginning of a potential uptrend.
CVD Confirmation:
Rising CVD + bullish candles: Demand increasing, especially around POC reclaim.
2. Support & Resistance Levels
a) Volume-Based Levels:
Support:
VAL: 3,277.14
POC: 3,309.96
Swing low: 3,277.07
Resistance:
VAH: 3,390.67
Recent rejection zone: 3,342–3,350
b) Gann-Based Levels:
Confirmed Gann High: 3,427.04
Confirmed Gann Low: 3,277.07
Key Retracement Levels:
1/3 retrace: ~3,335
1/2 retrace: ~3,352
2/3 retrace: ~3,370
3. Chart Patterns & Market Structure
a) Trend:
Bullish, supported by ADX > 20 and rising CVD confirming new leg up.
b) Notable Patterns:
Falling wedge breakout confirmed from 3,277 support.
Channel projection points to potential continuation toward 3,370–3,390.
POC retest success showing strong reaccumulation.
4. Trade Setup & Risk Management
a) Bullish Entry (If CVD + ADX confirm uptrend):
Entry Zone: 3,310–3,320
Targets:
T1: 3,350
T2: 3,390
Stop-Loss: Below 3,277
RR: Minimum 1:2
b) Bearish Entry (If trend invalidates):
Entry Zone: 3,390–3,400 (retest rejection)
Target:
T1: 3,310
Stop-Loss: Above 3,427
RR: Minimum 1:2
c) Position Sizing:
Risk only 1–2% of total capital per trade.
Volume
Technical Breakdown on US100 Cash CFD | 1H Timeframe1. Key Observations (Volume, Gann & CVD + ADX Focused)
a) Volume Profile Insights:
Value Area High (VAH): 18,758.52
Value Area Low (VAL): Approx. 18,259.03
Point of Control (POC):
Recent Session POC: 18,758.52
Previous Session POC: 18,259.03
High-volume nodes: Clustered around 18,600–18,750 – area of high interest and possible re-accumulation.
Low-volume gaps: Below 18,300 – could act as fast-move zones on breakdown.
b) Liquidity Zones:
Stop Clusters:
Above 18,800 (recent swing high).
Below 18,250 (previous swing low).
Absorption Zones (Delta Volume Focus):
Strong absorption around 18,580–18,600; price has consolidated here indicating order filling.
c) Volume-Based Swing Highs/Lows:
High-volume swing low: 18,259.03 (POC) – strong buying response seen post drop.
High-volume swing high: 18,758.52 – rejection seen here on low follow-through.
d) CVD + ADX Indicator Analysis:
Trend Direction: Currently Range-bound (CVD not showing clear accumulation/distribution trend).
ADX Strength:
ADX ≈ 18–20: Suggests weakening trend; possible sideways movement.
DI+ ≈ DI-: Confirms indecision.
CVD Confirmation:
CVD flattening at resistance suggests equal pressure from buyers and sellers.
No strong rising or falling trend in CVD; supports ranging bias.
2. Support & Resistance Levels
a) Volume-Based Levels:
Support:
VAL: 18,259.03
Previous swing low/absorption: 18,300
Resistance:
VAH: 18,758.52
Rejection level: 18,800
b) Gann-Based Levels:
Confirmed Gann Lows: 18,259
Key Retracement Levels:
1/3 retrace from recent high: ~18,430
1/2 retrace: ~18,500
2/3 retrace: ~18,580
3. Chart Patterns & Market Structure
a) Trend:
Range-bound (confirmed by ADX near 20 and mixed CVD).
b) Notable Patterns:
Bearish rejection at VAH zone.
Potential descending channel forming from highs.
Fake-out above 18,750 followed by rejection – possible liquidity grab.
4. Trade Setup & Risk Management
a) Bullish Entry (If CVD + ADX confirm uptrend):
Entry Zone: Near 18,300–18,350 (absorption + VAL zone)
Targets:
T1: 18,580
T2: 18,750
Stop-Loss: Below 18,250
RR: Minimum 1:2
b) Bearish Entry (If CVD + ADX confirm downtrend):
Entry Zone: Near 18,750–18,800 (rejection area)
Target:
T1: 18,300
Stop-Loss: Above 18,850
RR: Minimum 1:2
c) Position Sizing:
Risk 1–2% of total capital per trade for optimal drawdown management.


TOTAL2 / BTC - Majority of Alts Look BearishDon't shoot the messenger, but the MAJORITY of your Alts need to NUKE ~25% before Alt Season 🫨
This lines up with prior cycle support before Alt Season blastoff.
First step is to reclaim the EMA9, which they have failed to against BTC.
The lack of buying Volume supports this thesis for the trend to continue downwards.

It's a trapThe break above the 200 SMA is hopeful for bulls, but it was not on high volume. My simple position trading strategy has not indicated to re-enter, it looks for both a cross of the 200 SMA and a cross on the MACD. The former has happened but the MACD crossed on the 12th and has stayed above since. It uses conservative values to avoid entering into bear market rallies. Trend reversal to the upside could be real, but the probability of a sucker's rally is greater.

Going long on BitcoinBINANCE:BTCUSDT
Bitcoin has made a 5 wave move to the downside, it is forming a bullish RSI divergence on the 4-hour chart, it already shown climatic volume on the recent bounce, seems like downside should be limited from here in the short to mid-term. Long term, the trend is still down.
I expect a multi-week bounce from here, probably to the 50% retracement, around 92k, before continuing to move down to a deeper lower-low.
Good luck to you

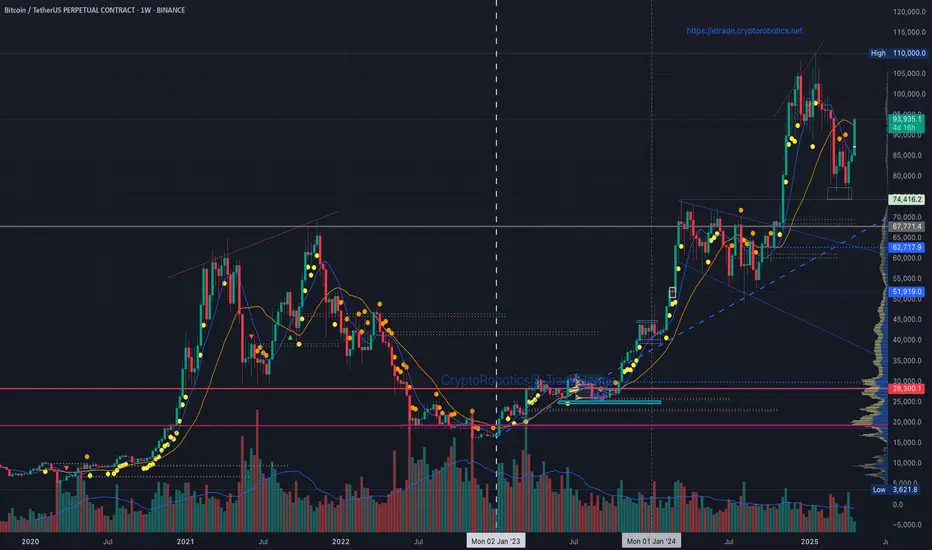
BTCUSDT, Binance Futures – Weekly Technical OutlookMarket Context
Bitcoin has demonstrated renewed strength, breaking out from the recent consolidation phase and moving firmly back above the $90,000 level. This move follows a successful defense of the $74,000–76,000 range, which now acts as a strong weekly demand zone.
The current weekly candle (as of midweek) is developing into a bullish engulfing pattern with solid volume support, indicating momentum may be building for further continuation.
Key Technical Zones:
📌 Support Levels:
• $74,400 – $76,000 → Previous swing low + liquidity zone.
• $65,000 → Confluence with trendline support & prior consolidation.
• $51,900 – $52,000 → Strong historical support on VPVR.
📌 Resistance Levels:
• $95,000 – $98,000 → Local resistance and prior range midline.
• $105,000 – $110,000 → Weekly highs and Fibonacci extension zone.
• Above $110,000 → Potential discovery zone with limited historical structure.
🧭 Trend & Structure:
The broader trend remains bullish on the weekly timeframe. After a healthy correction from the $110,000 high, BTC has printed a higher low, suggesting the continuation of the longer-term uptrend remains intact.
The chart also highlights the breakout from the symmetrical triangle formation that began in Q1 2024 — this breakout is being respected and validated.
4/22 Gold Trading StrategyGold continued its upward movement yesterday. Short positions around 3380 yielded limited gains, while those near 3410 are currently underwater. Many traders may be in a similar position, and I want to emphasize: there’s no need to panic—today offers a strong opportunity for the bears.
Technically, gold is now in the final stage of a five-wave upward structure . The bullish momentum is fading. The remaining upside is likely limited to within $50 , while the downside potential could exceed $80. In short, there’s an 80%+ chance of a pullback or consolidation today, offering a solid exit or profit opportunity for short positions.
The price is expected to retrace below 3360, and once profit-taking begins, the decline may accelerate.
Trading Strategy for Today:
Sell between 3450–3480
Buy between 3330–3310
Trade flexibly within 3440–3400 / 3410–3355

Ethereum Hits Support – Time to Load Up?🎢 The Great 112‑Day Drop
What happened? Over the past 112 days, ETH tumbled –66%, sliding from $4109 down to $1383 and oh yeah, it even poked its nose below the January 2018 all-time high. 7 years ago!
Support Zone: 0.786 + Volume Profile
0.786 Fib: $1,570.85 (drawn from the 2022 low $870.80 to that $4109 high).
5‑Year POC: $1565
Hold Tight: For 2 weeks, the 0.786 level has acted as support, bouncing price right back up.
Sell in May and go away? Rather buy in May and grab some gains on the way?
Trade Blueprint: Your Ethereum Game Plan
Entry Zone: $1570.85
Stop Loss: Below $1369.79
Profit Targets: $1800, $2000 ,$2500, $3000
Risk/Reward: Risk ≈13%, Reward ≈91%, a solid 7:1 R:R
DCA
Missed the perfect entry? No drama... dollar‑cost average between $1700 and $1500.
Keep an eye on the monthly open at $1822. Bulls need to break this resistance zone.
Bottom Line
Ethereum’s –66% dive has handed us a golden ticket at the 0.786 fib and 5‑year POC. This is one of those “buy the dip” moments.
________________________________
💬 Found this helpful? Drop a like and comment below. Want TA on another coin? Let me know and I’ll break it down for you.
Happy trading everyone! 💪

#ETH Update – April 22, 2025
Current Price: $1,700.02 (+7.8%)
📊 Technical Snapshot
• Trend: Downtrend (last 4 months)
• Support: $1,500 & $1,350
• Resistance: $1,750 & $2,150
• Range: $1,557 – $1,630 → Moderate volatility
• ETH has dropped ~65% from its all-time high of $4,107
🔗 On-Chain Metrics
• Exchange Inflows: Large positive netflow to derivatives in March → Selling pressure
• Wallet Profitability: Only 20.94% of wallets in profit → Weak sentiment
• Active Addresses: Down to 400K from 650K → Lower usage
• Staked ETH: Over 25.6M ETH → Long-term confidence remains strong
🧭 Fundamentals
• SEC Approved ETH ETFs (no staking allowed) → Institutional inflow potential
• Galaxy Digital moved $100M from ETH to SOL → Institutional rotation
📈 Forecasts
• Short-Term (by Apr 27): ~$1,635.87 (−0.51%)
• Mid-Term (by May 22): ~$1,725.30 (+4.93%)
✅ Summary:
ETH is still in a downtrend, but fundamentals like staking and ETF approval show long-term strength. Short-term movement may be choppy. Watch $1,500 support and $1,750 resistance.

HBAR Falling Wedge / Bull Pennant + RSI breakout (1D)BINANCE:HBARUSDT has spent months correcting after a strong rally and is now compressing within a falling wedge — which could also be interpreted as a bull pennant.
Two Potential Scenarios
• Falling Wedge – A classic reversal setup with bullish RSI divergence and declining volume. Measured target: ~$0.335.*
• Bull Pennant – A continuation pattern formed after the late-2024 impulse. Measured target: ~$0.525.*
Early Bullish Signs
• Declining volume as the pattern developed could signal waning seller strength.
• RSI breaking out of a multi-month downtrend, and retesting the resistance as support, can be a leading signal of a subsequent price breakout.
Key Levels
• $0.050 – Multi-year demand zone.
• $0.120 – Current support + HVN* + previous S/R + 0.786 Fib.
• $0.180 – Resistance + HVN + previous S/R + 0.618 Fib.
• $0.280 – HVN + prior swing high + likely resistance.
• $0.320–$0.460 – Monthly supply zone (in place since March 2021).
• $0.335 – Falling wedge measured target (depending on breakout timing)**.
• $0.360–$0.400 – Daily sell-side order block, expect resistance.
• $0.525 – Bull pennant target (depending on breakout timing)**.
* Wedge and pennant targets are measured from the breakout point, so the actual target will vary the longer we spend within the pattern.
** HVN: High Volume Node — zones of concentrated past trading activity, reinforcing S/R relevance.
⚠️ Until a clean breakout occurs, CRYPTOCAP:HBAR remains in a compression phase and a No-Trade Zone.

#BTC Market Update – April 22, 2025Current Price: $90,700 (+4%)
📊 Technical Overview
• 200-Day MA: $88,356 – BTC is trading above it → Bullish sign
• RSI: 78 – Overbought zone → Possible pullback
• Resistance: $90,000 – Key psychological level
• Support: $85,000 – Watch this level on retracement
🔗 On-Chain Insight
• Long-Term Holders: Some distribution happening → Profit-taking
• Network Activity: Steady → Healthy usage
• Sentiment: Bullish → Weak USD + institutional inflows
🧭 Macro & Fundamentals
• U.S.–China tensions + Fed uncertainty → BTC seen as safe haven
• Institutions are increasing their exposure → Positive market signal
✅ Summary:
BTC shows strong bullish momentum, but RSI is overheated. Stay alert for potential short-term correction. Key levels: $85K support / $90K breakout.

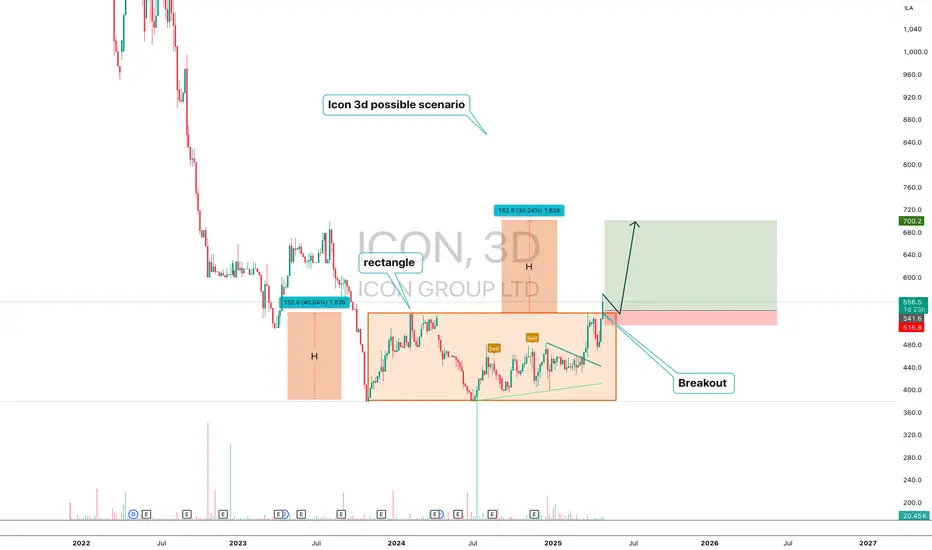
ICON — Breakout from Rectangle with H Projection Targeting $700ICON (3D) — Technical Structure Analysis
ICON has broken out from a prolonged horizontal rectangle pattern ($380–$540). The move activated a measured move structure with two H-sized waves. The first H was completed. The second H projects a move to the $700 area.
Key points:
-Confirmed breakout from range
-First H = 153 pts, completed
-Second H = 162 pts, targeting $700
-Price holding above breakout zone ($515–$541)
ICON has moved out of accumulation and entered trend expansion. As long as the support holds, the scenario remains valid. The technical model targets the $700 area.
CRUDEOIL MCX MOMENTUM CATCHThis Chart is only for educational purpose. Do your own analysis before taking any trading decisions.

USD/JPY - continues the downtrendOn USD/JPY , it's nice to see a strong sell-off from the price of 140.810. It's also encouraging to observe a strong volume area where a lot of contracts are accumulated.
I believe that sellers from this area will defend their short positions. When the price returns to this area, strong sellers will push the market down again.
Fair Value GAP (FVG) and Volume cluster are the main reasons for my decision to go short on this trade.
Happy trading,
Dale

#COPR Egyptian stock#COPR time frame 1 DAY
created a bullish Gartley pattern
Entry level at 0.358 to 0.33
Stop loss 0.31 ( loss may go to up 11% )
First target at 0.455 to 0.485 ( with profit around 32% )
Second target 0.544 to 0.656 ( with profit around 55% )
Third target 0.617 ( with profit 70% )
Hight expectation with stop loss more than 11%
the positive thing here is MACD created a positive diversion with low volume at last 3 weeks .
NOTE : this data according to time frame I DAY , it`s may take period up to 3 months to achieve targets , you must study well the Alternative opportunities before invest in this stock .
Its not an advice for investing only my vision according to the data on chart
Please consult your account manager before investing
Thanks and good luck

NQ KEY LEVELS - 21st APRIL 2025Key levels marked by using low volume nodes for potential key levels where we may see price react.

Analysis of EOS CoinHello to all members of the AMKT crypto channel. In our first analysis in the TradingView space, we are going to look at the EOS coin together.😍
On the monthly time frame, we are in a downtrend where we were supported by our last monthly support level and were able to create a higher low and are waiting for a higher high.
We are also in a downtrend on the weekly time frame.
In the daily timeframe, we are forming a range structure between 0.5895 and 0.8789, and we can take a position by exiting from either side and increasing volume.
And on the 4-hour time frame, we are in a descending channel that generally creates a boxed range between 0.5895 and 0.7072. For long positions, after breaking 0.7072, we can take a long position and wait for a break of 0.8789, but for short position, we should wait for an increase in volume, because the volume is decreasing and if the volume increases, we can enter a short position with a break of 0.5895.
Have a good day with lots of profits.😍

EURUSD - EURO's behavior towards the dollar is changing!Soon the EURO will shake the dollar's throne. Hold on to your Euros!

HINO--- A High Probability BUY SwingTradePrice is currently at a High Probability Buy Zone with Target at 544 & 600. Confluences include:
1. BB-50 (Base line Retest and Rejection) on weekly TF.
2. RBS Zone overlapping with 61.80% to 78.6% Fib. zone.
3.Strong MACD Signal.
4. Surge in Volume on Daily TF at a key support area.
5. SL below 322

Charging Stations, Reduced Rates and Politics.With the future of the car industry looking dark and bright at the same time, HTZ has been over sold and bullied hard since its last pump with tesla ect.
My long term target I know it will hit is $8 over the next year.
I rarely call on meme stocks but no one is seeing this one coming ;)

$30 imminent GME’s momentum is ROARING— Ever since the BTC news dropped GME has had significant volume front ran $27, flexed a savage pullback to lock in support, and handed us a golden entry last week. Went long and snatched shares at $24, $27, and $30—stacked for the next month’s fireworks. All eyes on BTC holding that weekly 50MA; if it cracks probably crashing to $60K+ to test support at that snooze-fest of a pattern. GME insider buys are screaming conviction. A dip close to $20 would be another gift. We are exactly at some weekly resistance and the floor could fall out of the market Wednesday with tariffs taking effect. Volatility has been off the charts across the board seems like the perfect storm. ANNND 4/20 is around the corner. “The most entertaining outcome is the most likely,”

Bullish momentum in ENGROH Confluences include:
1. RBS zone (Marked on Chart).
2. 78.6% fib level support
3. VSA suggests absorption of large orders at current price level
Price may test 190 to 200
