TSLA, Long, 1D✅ TSLA has just broken out of a clear symmetrical triangle pattern, signaling a potential bullish continuation.
Yesterday’s daily candle was a white Marubozu, indicating strong buying pressure and clear dominance by the bulls.
LONG 📈
✅ Like and subscribe to never miss a new technical analysis! ✅
Volume

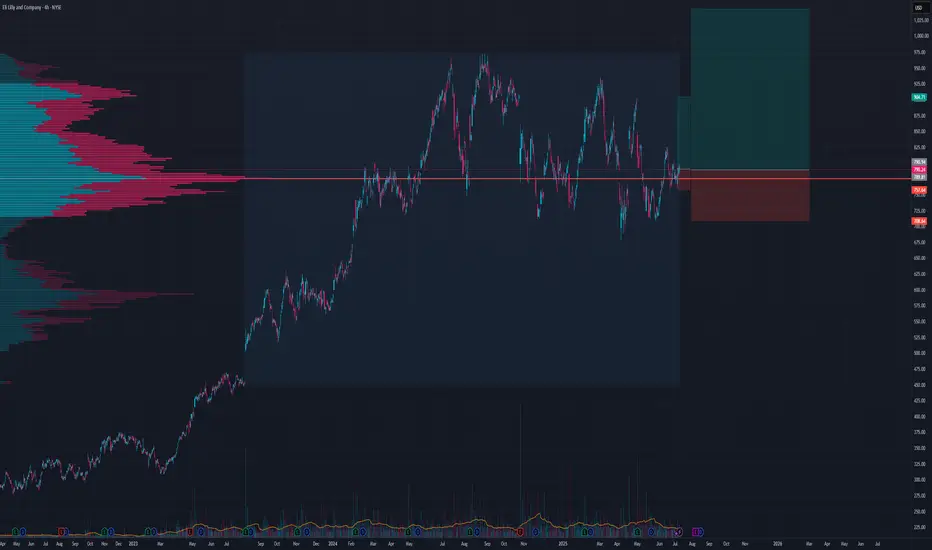
Long Healthcare and BiotechI think we will go for all time highs soon
TP 1 over 900
Got 2 stop losses on chart depending on time horizon and risk apatite
ATAI bulls finally show upATAI closed the day with a bullish looking candle for the first time since daily consolidation started July 2. Big bounce on the hourly chart today but stopped just shy of two key short term hourly resistances 2.76 and 2.82. Tomorrow bulls want to see these levels taken out and an hourly uptrend regained in order to call 2.53 our new daly higher low.
A big bounce is nice but we MUST see 1) hourly resistance breaks and 2) hourly uptrends. So far, neither of these things have happened.

AWX - Breakout from Multi-Year Cup & Handle + JV Deal with FCXArcWest Exploration (TSXV: AWX) just broke out of a 7-year cup & handle formation, hitting C$0.21 with record weekly volume (1.53M).
📉 Long-term downtrend decisively broken
📊 12W SMA (0.114) > 36W SMA (0.098)
☁️ Weekly Ichimoku turns bullish
🔻 Pullback to C$0.185 (-7.5%) may offer entry
🔎 Next resistance zone: C$0.30+
Fundamental trigger:
ArcWest Exploration is a project generator focused on porphyry copper-gold systems in British Columbia, operating under a JV-based model. The company currently has eight 100%-owned projects, several of which are already partnered with major producers.
The recent breakout follows the announcement of a joint venture agreement with Freeport-McMoRan on the Eagle project, where Freeport can earn up to 80% interest by spending C$35M over 10 years, including staged cash payments and a commitment to fund exploration.
This deal marks ArcWest's second major JV partnership, alongside Teck Resources (on the Oxide Peak project), further validating the quality of its portfolio. Both Freeport and Teck are known for targeting large, long-life copper assets, which adds strong institutional backing and long-term exploration potential.
The alignment of technical breakout + institutional interest signals a possible structural re-rating as the market begins to price in multi-asset optionality and tier-1 partnerships.
The chart and fundamentals now align, suggesting multi-year upside potential.
📌 Do your own research before investing!

Its A Prime Set Up Guys, May 13th May 13th there will be a press conference with the CEO I think.
All techinals show a sharp fall will occur soon and I bet its the 13th.
Reached the top of the trend line and we are very over extended. Ying and a yang, time for the yang.
See my price path for a rough guess.
You Haven’t Missed It**⏰ Timeframe: 1H**
**🛠 Tools Used: Dow Theory, Support & Resistance, Volume, RSI**
**📈 Market Overview**
Bitcoin BINANCE:BTCUSDT is currently trading at **110,982**. After hitting a new all-time high at **12K**, the price is undergoing a mild correction. Despite the retracement, price remains supported by both volume and the 25-period moving average.
Yesterday, BTC broke through the **110,267** resistance level with a strong bullish candle, but encountered aggressive selling from market makers and is now consolidating with weak candles below the **12K** mark.
Typically, in such market phases, it’s advisable to close previous positions and consider new entries. However, given the likelihood of **interest rate cuts** and the fact that price is holding near its ATH, keeping previous **long positions** open may be wise, as a **strong upward move** is still on the table.
**⚙️ Technical Analysis**
Yesterday’s breakout above **110,267** was met with seller pressure near **12K**, leading to a shallow correction.
**BTC Dominance (BTC.D)** has broken above **65.04** and **64.69**, moving toward **64.51** resistance. However, a weakening candle structure is visible on both **4H and 1H** timeframes. This indicates that while long opportunities on bullish **BTC pairs** may still exist, we might see a lower high forming above **64.51** and below **64.69**, followed by another move back toward **64.51**.
Meanwhile, **USDT Dominance (USDT.D)** broke below the **4.75** support with a strong candle and is now ranging above **4.63**, suggesting a possible pause or rest phase here.
The **Total Market Cap** shows a similar pattern to **BTCUSDT**, reflecting consolidation with slight bullish bias.
The **Others** chart (excluding BTC & ETH) shows a healthy uptrend and is now facing resistance at **248.68**. A breakout above this level could pave the way for stronger performance among altcoins with bullish BTC pairs.
**🧭 Potential Scenarios**
📗 **Bullish Scenario:**
If BTC forms a **higher low above 110,654**, an entry could be considered above **12,000**, with a stop-loss placed below the higher low (based on the 1H timeframe). Volume confirmation is necessary to support the move.
📕 **Bearish Scenario:**
As long as the price remains **above 109,409**, **short positions are not recommended**.
**💡 Conclusion, Warnings & General Suggestion**
Bitcoin is currently in a **healthy bullish phase**.
The **key resistance at 111K** has been broken, and price is pulling back toward that level.
The structure remains bullish, supported by **sufficient volume** and **no clear bearish divergence**.
If current support holds, there’s potential for continuation toward the **113,500–114,000** range.
⚠️ **Warnings:**
* If the pullback turns into a breakdown (falling below **110,200**, then **109,000**), it would signal **buyer weakness**, and strategy must be reconsidered.
* Watch for **RSI divergences** or **declining volume** during further rallies—they may indicate caution.
* Prolonged consolidation **below broken resistance** could also indicate market weakness.

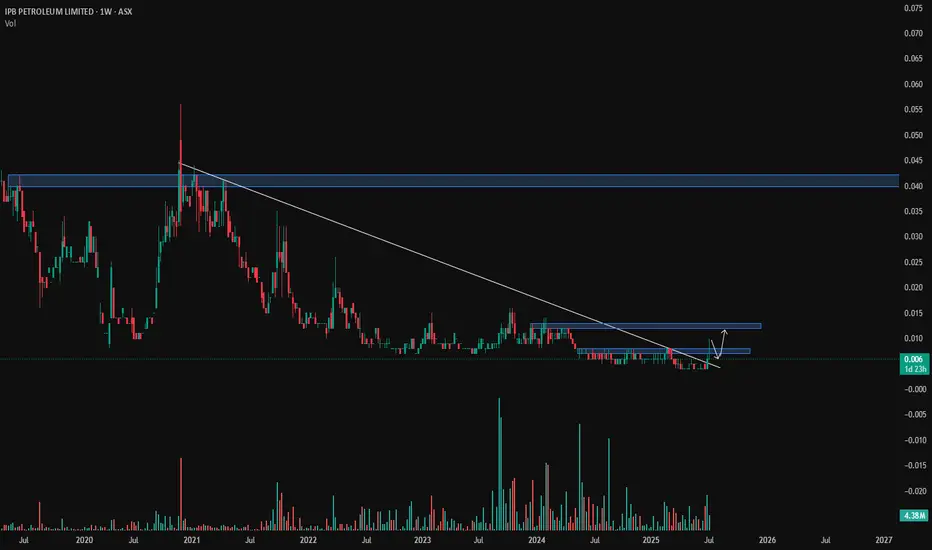
IPB - volume breakout LONGBroken out of 2 year trend on volume now looking to backtest area.
Awaiting news
I don't think this will be left in the past...Well well well, Walgreen's is definitely going to try and redo there entire business model in order to save it.
There are some weird and unbalanced volume levels left behind that I think we will see again this year.
Target is $12 and depending on this earnings, I don't know when it will hit. Shares only.

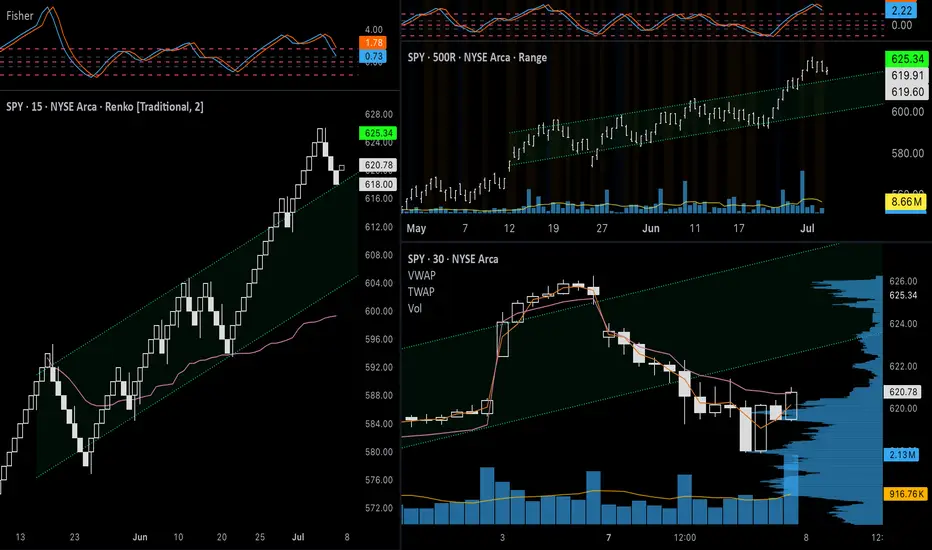
SPY July 8th 2025SPY July 8th 2025
Day 2 of journaling my trades. Ended Monday green but not without mistakes. I am heading into Tuesday with more of a neutral outlook. Previous resistance will be tested as support and could find buyers or fail to do so. As I did yesterday, I will give a breakdown of what I’m seeing on all of my charts for both strategies.
+++++++++++++++++++++++++++
Bullish Analysis
Renko: The price pulled back on Monday, as expected, and may continue lower to retest the top of the channel (around $615). Fisher Transform is still in positive territory and strong support at that level could lead to the price reaching higher highs.
500R ($5) chart: Similar structure to the Renko chart. I’m using a higher range here to compensate for volatility. Just like with the Renko chart, a bounce on the top of the channel would be a healthy pullback before higher highs. There is a high volume node on the volume profile, so interest from buyers here could be strong enough to prevent the price from falling back into the channel.
4h chart: The last three candles have the appearance of a healthy pullback. There was declining volume and
the most recent candle is somewhat of a bullish hammer. I also have an anchored VWAP going back to June 30 that the price seems to be respecting. The price bounced off of it in the first 4h candle on Monday and managed to close above it after a dip during the formation of the second candle.
+++++++++++++++++++++++++++
Bearish Analysis
Renko: Same chart with a lower box size ($1 instead of $2). As you can see, there is bearish divergence on Fisher Transform. The price also found likely temporary support before reaching the top of the channel, suggesting that it could make at least one more wave down if a larger corrective trend unfolds. The 1.382 ($614) and 1.618 ($612) Fibonacci extensions will be important reference points to watch. I would feel less confident about the strength of the bullish trend if the price goes beyond the 1.618 extension.
200R ($2) Range: The Range chart in this layout is the only one that I am including extended hours data on, so the channels have slightly different levels. On this chart I am using two trend lines on the upper level to illustrate the possible areas of support/previous resistance. If the price breaks back into the channel and below the 34VWMA, it could signal a trend failure and the price could return to $600 or lower. Volume bars on range charts also offer a different perspective than on time-based candlesticks. Here, since each bar represents a $2 move up or down, the volume inside of each bar can show the level of effort it took to move the price either direction, whereas the time-based charts are simply showing the level of interest during a particular time period. For this reason, consistently high volume during this last move up could be a sign that there is a larger presence of sellers. Lastly, there is Fisher Transform divergence here as well.
1h chart: CME_MINI:ES1! is green overnight, signaling continuation of the bounce we saw at the end of the day on Monday. With a tighter channel, the top was rejected in a classic bearish reversal candle pattern above the channel and made a clean break down below the channel. The price found support just above the anchored VWAP from the start of the channel, so there could still be institutional interest around $617 and below. If this correction were to unfold into three distinct waves, a 0.618 pullback (to the 0.382 level of the fib extension; $623) would retest the previous demand of the channel. A rejection here could have the price looking for support in a lower volume zone. A (c) wave could take the price down to $615-$611.
+++++++++++++++++++++++++++
Options Analysis
As I have explained, I think it is possible that we will see the price hit $623 during the Tuesday session, so it could be an important level for ATM options. TVC:VIX held its level on Monday after the gap up but failed to make progress - finding resistance at the 200MA on the 1h chart. The rounding bottom and bullish candles on the 30m AMEX:SPY chart looks better than other timeframes. From a Wyckoff Method perspective, however, it looks like puts are in a distribution pattern and calls are in accumulation. Volume is low for both of these contracts, but especially lower on the Put option, indicating lack of interest.
If the put contract makes a lower low on Tuesday (below $3.55 or above $620.75 for SPY), this particular contract could break into a downtrend. Calls seem to be the safer bet since the price has already made a higher high and has wider support. An ideal entry would be a false breakout at $0.95 ($621.00 for SPY) or a retest of the top of the channel after a true upside breakout at $1.50 ($622.50 for SPY) The upside breakout possibility would have stronger confirmation, so it would be worth the higher premium price. This movement would need to be accompanied by high volume, of course.
For puts, I would like to see higher volume at the bottom of the range, since it seems like the underlying price will open higher. I would probably switch to a contract with a lower strike since $623 would be ITM but for the sake of this idea, I would target entry of $623p around $3.65 ($620.75 for SPY).
+++++++++++++++++++++++++++
Targets
Calls: Enter $622.50, Target $628-$630, Stop Loss $621
Puts: Enter: $620.75, Target $615, Stop Loss $621.50
To summarize, I like the risk/reward and volume better for calls, and it fits my original thesis, however if volume increases on puts at these elevated levels, it will be important to get in at a price that minimizes risk exposure to take advantage of a deeper correction.
SPY July 7th 2025SPY July 7th 2025
Day 1 of journaling my day trades on SPY. I am going to start journaling my ideas every night if possible in order to fine tune my setup and to analyze my wins and losses. I will be using Renko (Traditional, 2 box size, 1m) as my main chart, Range Bars (50R, 100R, 200R, or 500R), and candle sticks (various timeframes) to identify supply/demand, price ranges, and trends - placing a high emphasis on volume as it applies to the Wyckoff Method. I will also occasionally refer to real time options charts and VIX, however I will primarily use those for my entries during the day.
Each day I will provide setups for a bullish and bearish bias, which should help minimize instances where the price moves against me - with slow reactions leading to holding losing trades and hesitating to enter a trade on the side of the new trend. I’ll try to come up with a consistent format as time goes on. For today, I will go down the list of my indicators and provide notes that fit the bias of each trading strategy.
+++++++++++++++++++++++++++
Bullish Analysis
Renko: Strong breakout from ascending channel on June 30. Fisher Transform is signaling continuation. A retest of the top of the channel would take the price back to ~$618.
100R ($1) Chart: Price is in an uptrend being supported by high volume. 34VWMA (purple) is above 200MA (green). The bounce on July 2nd (around $616) was supported by a high volume node, indicating genuine interest pushing the price higher.
30m Chart: Price closed on July 3rd at the top of an ascending channel inside of a larger ascending channel. Since the larger ascending channel is one of strength, it can be assumed that the smaller one is a sign of strength as well. A break too far below the lower end of this smaller channel would be a sign of weakness, which does not seem to fit the current market structure after last week’s breakouts, but it is still possible that the trend fails. Fisher transform is forming a “hook” pattern that can signal continuation.
+++++++++++++++++++++++++++
Bearish Analysis
On a smaller scale, the price appears due for a pullback, which can fit both the bullish and bearish trading ideas depending on where the market opens.
Renko: The price closed at the top of an ascending channel on July 2nd and will find more buyers upon a test of the lower band and the anchored VWAP.
50R (50¢) Chart: If the price pulls back to the bottom of the channel (around $620) this would coincide with a retracement of 0.618 - which is a key fib level. A break below the 1.00 extension ($616) could signal a break of the uptrend - a $9+ drop if an entry can be found near the top of the channel, not too bad.
5m Chart: The price left a gap down to $620 on July 3rd. Filling this gap could provide important liquidity to propel the price higher. Additionally, The high volume at the start and end of Thursday’s flat trading day (with low volume in between) could be a sign of accumulation or lack of sellers.
1DTE ATM Put, 2m: If a more prolonged (and profitable) downward move is expected from smart money, we should see volume increase for ATM puts during the session. Depending on where things open, we could see a potential spring/false bearish breakout (below $2.20), or a true bullish breakout (above $2.80). Using an options calculator, $623.75 on AMEX:SPY would set up the Spring and a drop below $622.50 could confirm the put breakout.
+++++++++++++++++++++++++++
Targets
Calls: Enter $618-$620, Target $625-$628, Stop Loss $617.75
Puts: Enter $623-$625, Target $620, Stop Loss $626.25
To conclude, overnight action on CME_MINI:ES1! and the gap up on TVC:VIX shows that the price is already retracing. The top of the wedge for VIX would be just above $20 - a key level to watch for a reversal. Unless the upper part of the channel on SPY is tested and rejected again after the open, I will sit out and wait to hit the bullish targets. We are still in a strong uptrend after last week’s breakouts, so going short is the riskier bet anyway, as buyers could step in at any time.
Looking at ATM calls and puts side by side (bottom two charts), it is clear that calls were not heading into today with a good setup. It would be worth taking a chance on puts if a Spring forms (below $2.20), which, again, would correlate with AMEX:SPY hitting $623.75 during the session - and not much higher.
My main idea for the start of this week is to look for a good pullback for calls, so I will be patient and will try not to force anything. If smart money has a bullish sentiment, there will still need to be a short accumulation phase for calls so I will watch to see what the chart is doing for ATM calls around $620.

$AMD Swing Trade – Put Debit Spread Setup🔻 NASDAQ:AMD Swing Trade – Put Debit Spread Setup (Jul 18 Exp)
📅 Trade Opened: July 3, 2025
🛠 Strategy: Buy to Open (BTO) Put Debit Spread
📉 Strikes: $31 / $30 (Jul 18 Expiration)
💵 Cost (Premium Paid): $0.21
🎯 Trade Thesis
This setup aims to capture short-term downside in NASDAQ:AMD via a low-cost, defined-risk spread. The trade fits within my broader portfolio of OTM spreads under $0.25.
Key Drivers:
🔻 Semi sector under pressure – NASDAQ:AMD showing relative weakness.
📉 Breakdown below key support near $31 and rejection at VWAP.
🧾 Weak momentum – MACD trending down, RSI near 44.
🔄 Trade enters into earnings season volatility.
📊 Technical Setup (Daily)
EMA(4) < EMA(8) < EMA(15): Bearish structure fully intact.
VWAP: Price rejected from 30-day VWAP zone.
MACD/RSI: Momentum still fading, no signs of bullish divergence.
⏳ Strategy Notes
Max loss: $0.21
Max gain: $0.79
Risk/reward structured for a drop into or below $30
Expiration: July 18
🧠 Journal Note
Most of my trades are swing-based using OTM debit spreads with tight risk control. No same-day entries — setups must have defined technical compression and short-term catalysts.

$LYFT Swing Trade – Low-Cost Call Debit Spread Setup🚗 NASDAQ:LYFT Swing Trade – Low-Cost Call Debit Spread Setup (Jul 18 Exp)
📅 Trade Opened: July 3, 2025, 2:53 PM
🛠 Strategy: Buy to Open (BTO) Call Debit Spread
📈 Strikes: $16.5 / $17.5 (Jul 18 Expiration)
💵 Cost (Premium Paid): $0.25
🎯 Trade Thesis
This swing trade targets a short-term bullish move in NASDAQ:LYFT based on improving fundamentals and favorable technical setup. The structure uses a low-cost OTM call spread to define risk and limit exposure while capturing directional potential.
Catalysts supporting the move:
🚙 Autonomous vehicle rollout beginning this summer (Atlanta) and expanding to Dallas (2026) via Mobileye partnership.
🗳 Activist investor Engine Capital pushing for governance changes and strategic alternatives.
💵 Gross bookings at record levels, with net income and free cash flow turning positive.
📈 Analyst upgrade from TD Cowen with a $21 target (+30% upside from entry).
📊 Technical Setup (Daily Chart)
📉 EMA(4) < EMA(8) < EMA(15): Bearish alignment beginning to flatten – potential compression signal.
⚖ VWAP (30‑day): Price consolidating near long-term VWAP – watching for reclaim.
🔄 MACD: Bullish crossover emerging.
📉 RSI: ~36 – approaching oversold territory, setting up possible reversal.
⏳ Strategy Notes
Position type: OTM vertical call debit spread.
Risk defined: Max loss = $0.25 per contract.
Max gain: $0.75 if LYFT closes at or above $17.5 by expiration.
Timeframe: 2-week swing through July 18, ahead of Q2 earnings (~Aug 6).
🧠 Journal Note
This position aligns with a broader strategy focused on OTM spreads priced under $0.25, using technical compressions and fundamental tailwinds. Trade was opened not on an entry signal day - this avoids front-running momentum shifts.

AUD/USD - Day Trading Analysis With Volume ProfileOn AUD/USD, it's nice to see a strong sell-off from the price of 0.65470. It's also encouraging to observe a strong volume area where a lot of contracts are accumulated.
I believe that sellers from this area will defend their short positions. When the price returns to this area, strong sellers will push the market down again.
Strong S/R zone from the past and Volume cluster are the main reasons for my decision to go short on this trade.
Happy trading,
Dale

USD/JPY - continue with the UptrendOn USD/JPY , it's nice to see a strong buying reaction at the price of 143.860.
There's a significant accumulation of contracts in this area, indicating strong buyer interest. I believe that buyers who entered at this level will defend their long positions. If the price returns to this area, strong buyers will likely push the market up again.
(FVG) - Fair Value GAP and high volume cluster are the main reasons for my decision to go long on this trade.
Happy trading
Dale

GBP/USD - Day Trading Analysis With Volume ProfileOn GBP/USD, it's nice to see a strong sell-off from the price of 1.37000. It's also encouraging to observe a strong volume area where a lot of contracts are accumulated.
I believe that sellers from this area will defend their short positions. When the price returns to this area, strong sellers will push the market down again.
Strong S/R zone from the past and Volume cluster are the main reasons for my decision to go short on this trade.
Happy trading,
Dale

BTC in DistributionHi everyone. I am going to be moving my trading commentary back to Ideas rather than Minds so I can stay focused during the day, as well as having the added benefit of retrospective analysis. I do not trade BTC but have been tracking the price recently and believe it is gearing up for a big move. The current structure supports a bearish bias based on the Wyckoff Distribution pattern, which the price has been following in a textbook fashion. If this pattern continues, I believe Bitcoin will enter a bearish trend.
For the indexes I will try to post ideas for a bullish and bearish bias but for this quick post on Bitcoin, I am going to stick to the bear side.
Using Renko (Traditional, $500 window size) as my main chart, you can see the price broke out of a strong uptrend after the peak on May 22 (Buying Climax) and entered a potential distribution pattern. The secondary test (ST) set the lower band of the resistance zone, which the price has been testing and rejecting up until this point.
The labels are subjective but what we can confirm is that the price has broken through the bottom range (Sign of Weakness or Spring) but has been unable to break through the top of the range. An upthrust/false breakout above the top of the range would be a key level to go short, as this would take out the last remaining buyers, however the price continuing to stay below the resistance could be a sign of persistent weakness.
A rejection here would suggest that we are in Phase C, which is where momentum will build up on the sell side, eventually pushing the price through the bottom of the range and into a bearish trend.
Since Renko is the smoothest chart, I am also using range bars (less smooth) and standard candle sticks (most noise) to analyze closer setups.
On the range chart (20000R or $200), the price looks to be in an inverse cup and handle pattern, which if it holds would support the idea that we are in Phase C of the distribution pattern and the price will fail to break above the range again. Volume indicates that there is low interest at the upper levels, which resulted in the price moving down in Friday. We could see another push down after another period of low interest at the upper level.
Lastly, the 1h candle chart shows that the price has been relatively flat since June 25th and is being supported by a large volume node on the Volume Profile. There was large buying volume at the lower level, so if the price can stay above this node (~$106,700) there is a good chance that it will get pushed above the range, however if sellers are able to push it through this level of high volume, further downside could follow. This is why I would suggest waiting to see if this level holds before entering a trade. A false upside breakout (above $112,000) would be a safe area to go short, as it would be a quality setup with good risk/reward.
If the price is in Phase C and cannot break above the range, it would be a less ideal short setup, as the market could make a push to the top of the range at any time to clear out buyers. If this were to happen, I would prefer to wait for more confirmation.
To conclude, my idea here is:
Short (Solid Line): False breakout above $112,000 (preferred) or below $107,000 (higher risk)
Long (Dotted Lines): True breakout above $112,000 (preferred) or reversal $103,000-$98,000 (higher risk)
Thank you for reading and let me know what you think. More ideas to come.

TON longterm ideaTon was in distribution and is now in accumulation again, growth drivers will be sufficient accumulation of ton coins in the green zone and maybe a little lower

OPUSDT: Buyers try to regain control inside the rangeHi traders and investors!
On the daily timeframe, OPUSDT is trading in a sideways range. The price has repeatedly dipped below the lower boundary at 0.545, but each time, buyers managed to bring it back.
Now, we’re seeing another attempt to return into the consolidation zone — a possible sign of renewed buyer initiative.
If the price secures above 0.545, the path opens toward the next targets at 0.844 and 0.954. However, a short-term dip below 0.52 may occur within this bullish scenario.
Therefore, buying becomes a priority once the price is firmly back above 0.545.
This analysis is based on the Initiative Analysis concept (IA).
Wishing you profitable trades!

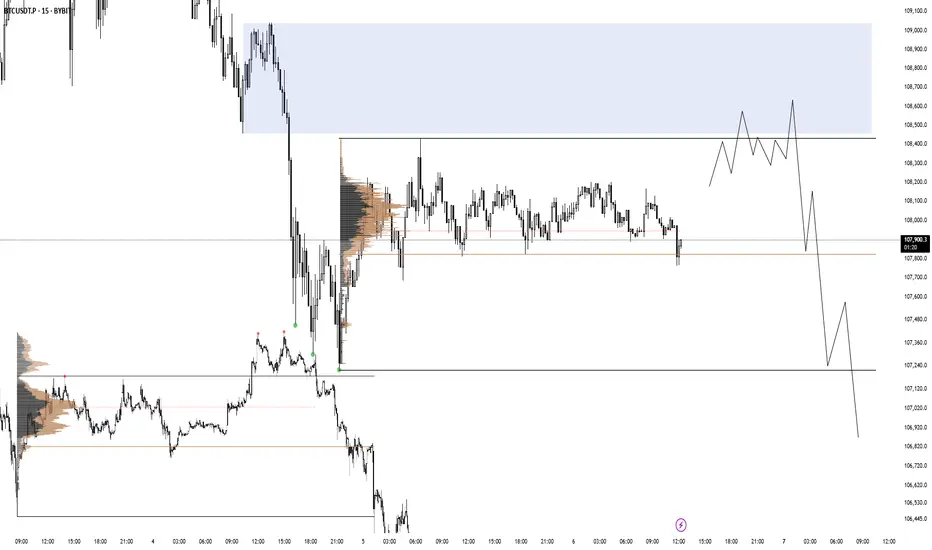
BTC 06.07.25There is a range imbalance with no price action in discount after BTC accumulated on friday afternoon. I am looking for a valid distribution like in the picture on the left.
CYBN still holding daily supports - barelyCYBN remains in a choppy pattern after a big volume bull break and then an even bigger volumr 18% sell-off. There's a big range on this that I anticipate will tighten up for a while unless bears show up first thing next week and break 7.30ish and 7.11 supports. In the entire psych sector, this daily chart is the closest one to breaking down and has the most amount of overhead supply.
Entry: 8.35 (approx)
Stop loss: 6.99

Anticipating MNMD bull break, but large overhead supply remainsMNMD is looking good on the daily chart for a bull break from it's currently daily equilibrium, but it still remains far from it's weekly and monthly resistance levels that ATAI has already cleared. I do anticipate MNMD to benefit from the GO signal from ATAI but the additional overhead supply may remain an obstacle until we get through it, either through grinding price action or a news catalyst specific to MNMD.
Entry: 6.77
Stop loss: 6.27

ATAI breaks out of three year channel on massive volumeATAI had a big breakout last week on positive market reaction to news, and is trading at the highest levels in 3 years. This is the first monthly trend change in the history of this stock (and maybe even the psych sector!) and I'm anticipating this to continue playing out as hype slowly returns to the sector. this is a small cap and a little volume on this can go a long way. Entry: 2.15, stop loss 1.95

Side way Breaks to new all time high Hello Traders,
i can see big volume compared to the monthly trading at the ending of side way markets which will lead for a continuation for the bullish trend targets is already mentioned and it depends what you are investing for short intermediate long if we break the discount area we well go for big correction advice to sell with the retest however if we breaks the discount area huge profits coming. if you like the idea kindly show your support for more ideas to come good day.
