$VRA $0.10 INCOMING?!Here is my analysis on Verasity, great coin to hold onto will do really well. Let me know what you think.
VRA

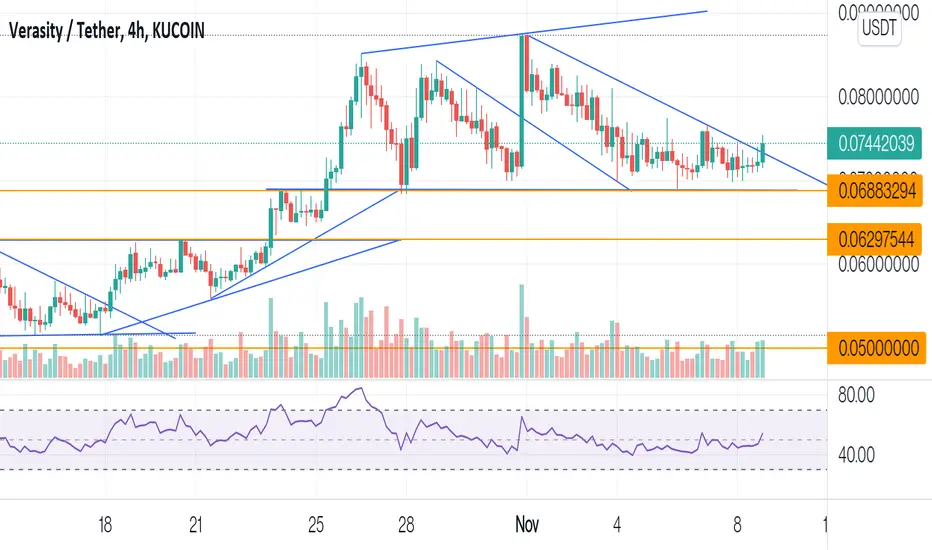
VRA to resume run to price discovery?Verasity (VRA) had a dizzying run in october but has taken time to chill for a week or two now. Is it nearly time to get back in the rocket ship?
While VRA is trying to make 0.071 stick, I feel if it suddenly loses this support, we'll see it drop to 0.068 and possibly as low as 0.064 to test support. No harm setting some buys there if you want to stock up on this long term monster project.
Next stop if we move back upwards is around 0.25c in my opinion.
I am bullish on VRA overall, and I think by end of year we'll be getting close to $1, although I think we will fall short in this particular run. Personally, I'm taking profits at 0.65-75c, but I will be holding the bulk of my bag for longer.

VRA Price Action PredictionVRA Price Action Prediction
I buy to Some VRA 0.68 $
Major Support zone is 0.37

VRAUSDT Path, Nov 6This is my idea about VRAUSDT path
Breakout from any side of triangle is important
Nothing further

BTC finds good support at 60k - VLOG #61BTC has been finding great support at 60k. We are starting to get lower highs on the 4 hour suggesting we could be in for some downside soon.
As price gets squeezed between 60k and lower highs it increases chance of a significant move up or down.
I've been wrong on major trend reversals at these points a couple times the past few months, but again, I can only really read it one way.. i wouldn't buy up here, price often comes down after highs like these, so I'm tipping for correction.
PREDICTION = 60k breaks, back into the 50s.
Some other ALTs I glanced at today were LSS, STEP, VRA, SLP, DYDX, DOT and KSM.
=== TimeStamps ===
0:00 = Welcome
0:30 = BTC 1 day
1:20 = Big candles
2:00 = 4H desc triangle
4:00 = Bearish pattersn are now bullish?!
5:15 = cryptopanic news
6:50 = Sideline money leave again?
9:00 = Dont buy tops
9:45 = CoinMarketCap alts
12:50 = Traditional markets
15:00 = LSS - Lossless
15:20 = STEP
16:00 = VRA - Verasity
17:00 = SLP
17:20 = DYDX
18:20 = DOT + KSM
19:30 = Closing words
------------------
NOT FINANCIAL ADVICE, please don't trade off solely my ideas. Always do your own TA and develop your own convictions.


Verasity, checking for a new entry. Currently at ATH, so wait!Intro:
- Verasity (VRA) is a protocol and product layer platform for esports and video entertainment
- Verasity keeps building since 2017 and has planned to introduce NFT's to their platform during Q4 2021.
- In circulation we have 6 billion coins out of currently 10million possible.
- Total market cap is currently around 500 million and still has a lot of room to grow
Daily chart:
- Price finds itself in an uptrend and currently sits at an ATH, so be cautious.
- Volume keeps increasing since August which is bullish and with the trend. It therefore confirms the trend.
- RSI analysis shows that we are within a larger consolidation wedge. The apex still is one month away which could act as a cool off phase.
- Support lines are at 0.05$ and 0.01$.
- Resistance lines are currently nonexistent.
Expectation:
- We expect VRA to cool off and retest the 0.062$ price line. From there we look for a support confirmation which would serve as a good entry point.
- End of the year prediction: We will see a 0.2$+ VRA before the end of 2021.
Basic rules:
- Never buy the top/ ATH
- Take profit as long as you can (also partial profit is profit)
- Use Stop/loss for leveraged positions
- If you are not experienced, don't leverage in the first place
Enjoy the ride and don't be too greedy.
If you like the content, please like, comment and give this channel a follow.
We would love it if you could share your thoughts in the comments.
Discussions are very welcome here.
Always do your own research and keep in mind that my charts and comments cannot be considered financial advice.
Cheers
ps.
Chart explanation:
Main lines:
- Green lines are tested support lines.
- Orange lines are resistance lines or, if we are above, possible support lines which were not tested yet.
- Cyan line is for volume trendline.
- White lines are Fibonacci retracement levels
Helplines:
- Purple lines are trendlines we take a look at.
- Blue, green, white and pink lines are 200MA, 100MA, 50MA and 20MA.
- Yellow lines are for visual help only.
Specials:
- Boxes represent either entry zone or support zone . Check the description.
- Cameras represent MA crossings. Yellow camera stands for a golden cross while the cyan camera stands for a death cross.

Double CupCoti looks ready to explode upwards in a similar fashion to its last run up followed by a consolation into a cup. We could see this playout once again.

The biggest cup and handle 5x in short termVRA will hit around 25-30 cents in the short term and $2 long without a doubt.
If it is going to be listed on Binance and Coinbase, the growth will be faster.

$VRA the coin that never stops increasingAnalyzing the 4 hour chart
Just as I thought VRA was going down from here, VRA may have found support on the 50MA and should continue upward into new All Time Highs.
A drop below 117satoshi is bearish and means BTC will outway the price of VRA
Also positive the stochastic RSI is oversold. Can take around 12-24 hours to have a decision on which way it will go. But still my 18X target is still a go ahead.

VRA/USDT Trend ContinuationJust my thoughts on targets for next phase of VRA trend continuation, using fib levels. KUCOIN:VRAUSDT

Next leg on $VRASimilar setup to the last bull flag, if we hold the 4Hr order block expect a break to the upside.
Entries are pin bar off of 4Hr OB or retest of top of the flag.
If we loose the 4Hr OB look for fake outs through the bottom of the flag for next leg up. Long the re-entry with successful retest or higher low inside flag structure.
Manage your risk, good luck.

$VRA eyeing $0.26 🤑🚀🚀On the Daily Time frame a Beautiful Cup and Handle Formation already formed for $VRA.
Our First Breakout Target is $0.088 cents.
Our Second Breakout Target is $0.26 cents .
A good place to take profits would be $0.14. You can honestly take profits at $0.12 as well.
TBH Either of those would be good areas to take profits.
The MACD confirms the Strong bullish momentum.
Volume is increasing which means price action should continue going 🆙
What's crazy...is the best has yet to come, VRA got me rubbing my hands like Birdman!! 😎

VRA/USDT : Possible 300% Rally after a retest on broken zoneKUCOIN:VRAUSDT
Hello everyone 😃
Before we start to discuss, I would be glad if your share your opinion on this post and hit the like button if you enjoyed it !
#VRA has formed a CUP & HANDLE pattern here.
However, There is a bearish divergence on RSI and Volatility is moving in over bought zone, So the retracement is expected.
We can set our bids below the the current broken resistance zone, But you need to caution about a close below the zone !
On other side, VRA/BTC has formed a bullish flag in 6H TF :
As you can see there was a falling wedge which is broken now, Also it just formed a stiff support zone at ( 0.0000007196 - 0.0000006863 ).
There's another support below the bullish flag and I expect a pullback from it on mid-term...
So it's more likely to break the flag from above !
🔴 Have to pay attention on BTC's chart, Once more BTC outperform ALTs, Then most of them will bleed badly !
So you can set your invalidation below the mentioned red light on USDT's chart and for BTC's chart you can set it below the current support zone.
Attention: this isn't financial advice we are just trying to help people on their own vision.
Have a good day!
@Helical_Trades

VRACITY This is VRA Target ,this is what am i thinking and not a financial advise .
Please do you own research guys ,

VRA Cup & Handle (Handle Breakout)VRA daily chart formed a huge cup & handle. It seems handle breakout is done. There is some good fundamental news (Exchange Listing & Burn ) also ahead of quarter 04. hope with the combination of FA & TA Verasity will explode soon.

HUGE CUP &HANDLE ON WEEKLY $VRA $VRA HUGE CUP & HANDLE ON THE WEEKLY ! READY TO ROCKET OFF ! IN SHAA ALLAAH
What Will This Look Like After #BINANCE #COINBASE & Other #crypto Exchange Listings. Two words Hold On!

$VRA HUGE CUP & HANDLE ON THE WEEKLY !$VRA HUGE CUP & HANDLE ON THE WEEKLY ! READY TO ROCKET OFF ! IN SHAA ALLAAH
What Will This Look Like After #BINANCE #COINBASE & Other #crypto Exchange Listings. Two words Hold On!

$VRA - Verasity @verasitytech next targets$VRA - Verasity next targets:
- 1st: $0.0765
- 2nd: $0.0920
- Please share your opinion in the comments.
* This is just an idea, Not financial advice.

$VRA breaks resistanceVeracity starting to move again, it seems the price is moving towards 0.10 cents

History tends to rhymeWhat we can expect to see:
- 70k this November
- Currently expecting a pullback to 54k
- Overall healthy trend for a bull market, expect volatility

VRA breakout between 25 october and 27 octoberVRA breakout between 25 october and 27 october.
VRA next target 0.10 cents.
