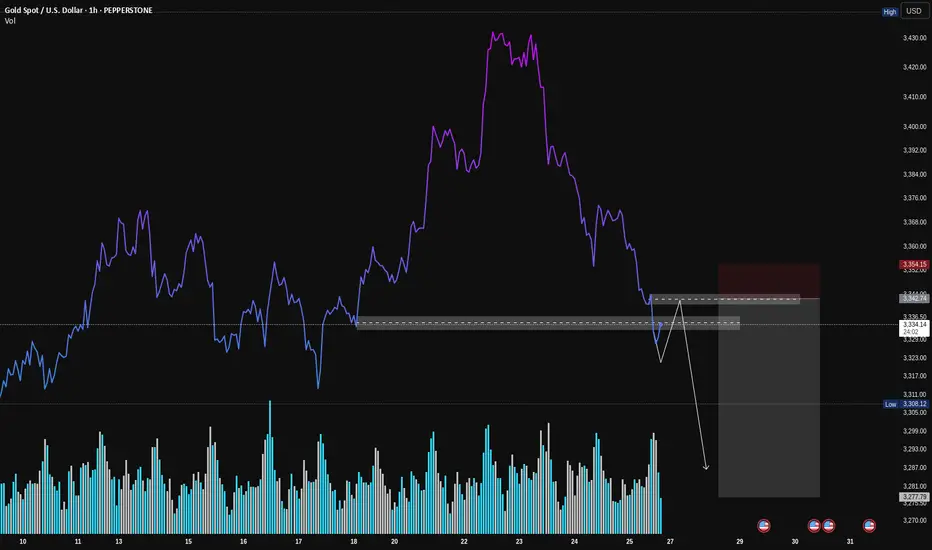
Gold (XAU/USD): A Classic VSA Short Setup in PlayHey Traders,
Following up on the general weakness we discussed in Gold, here's a closer look at a specific trade setup that's unfolding right now. This is a textbook example of a high-probability short setup according to Volume Spread Analysis (VSA).
Let's break down the story the volume is telling us.
1. The Breakdown: Sellers Show Their Hand
First, look at how the price broke down hard through that support level (the grey box). Notice the volume on that sharp drop? It was high. This is our clue that sellers are strong and in control. They had enough power to smash right through a level that was previously holding the price up.
2. The Retest: Buyers Don't Show Up
Now, the price is creeping back up to that same exact level. But here's the most important clue: look at the volume on this rally. It's much lower than the volume on the breakdown.
This is what VSA calls a "No Demand" rally. It’s like the market is trying to push a car uphill without any gas. It tells us that strong buyers (the "smart money") have no interest in buying at these prices.
3. The Setup: Selling into Weakness
This combination creates a classic short setup:
Logic: We are looking to sell at a level where old support has flipped into new resistance.
Confirmation: The low volume on the retest confirms the rally is weak and likely to fail.
How to Potentially Trade It
The grey box represents a high-probability entry zone. To time an entry, you could watch for a clear rejection signal right inside this zone. For example:
A "rejection candle" (like a pin bar) that pushes into the zone but gets slammed back down.
An up-bar with a tiny body and very low volume, showing buyers are completely exhausted.
Seeing one of these signs would be the final confirmation that sellers are about to take back control.
Conclusion:
This is a powerful setup because all the pieces line up: the background is weak, sellers have shown their strength, and buyers are now showing no interest at a key resistance level.
Disclaimer: This is my personal analysis using VSA and is for educational purposes only. It is not financial advice. Always do your own research and manage your risk. Good luck, traders!
VSA
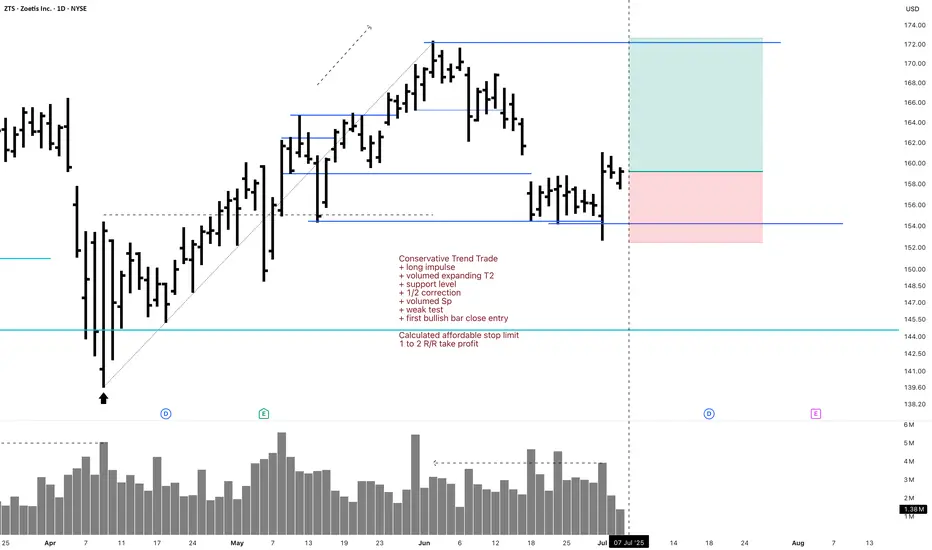
ZTS Investment 1D Long Conservative Trend TradeConservative Trend Trade
+ long impulse
+ volumed expanding T2
+ support level
+ 1/2 correction
+ volumed Sp
+ weak test
+ first bullish bar close entry
Calculated affordable stop limit
1 to 2 R/R take profit
Monthly trend
"+ long impulse
+ ICE level
+ support level
+ 1/2 correction
+ volumed 2Sp
+ weak test?"
Yearly trend
"+ long impulse
- correction"
ZTS 1D Investment Conservative Trend TradeConservative Trend Trade
+ long impulse
+ volumed expanding T2
+ support level
+ 1/2 correction
+ volumed Sp
+ weak test
+ first bullish bar close entry
Calculated affordable stop limit
1 to 2 R/R take profit
Monthly Trend
"+ long impulse
+ T2 level
+ support level"
Yearly Trend
"+ long impulse
- correction"

F 5M Long Daytrade Aggressive CounterTrend TradeAggressive CounterTrend Trade
- long impulse
- unvolumed T1
+ resistance level
+ biggest volume 2Sp-
+ weak test
+ first bullish bar below close entry
Calculated affordable stop market
T2 5M take profit
1H CounterTrend
"- long impulse
- unvolumed T1
+ resistance level"
1D CounterTrend
"- long impulse
- unvolumed T1
+ resistance level"
1M CounterTrend
"+ short impulse
- exhaustion volume
+ T2 level
+ resistance level
- unvolumed interaction bar
- reaction bar looks to close bullish in 6 days"
1Y CounterTrend
"+ long impulse
+ volumed T2 level
+ volumed 2Sp+
+ 1/2 correction
+ weak test"

F Investment 1D Conservative CounterTrend TradeConservative CounterTrend Trade
+ long impulse
- before 1/2 correction
+ expanding T2
+ support level
+ biggest volume 2Sp-
+ weak test
+ first bullish bar close entry
Calculated affordable stop limit
1 to 2 R/R take profit
Monthly CounterTrend
"- short impulse
+ 1/2 correction
- unvolumed T2
- resistance level
+ unvolumed interaction bar"
Yearly Trend
"+ long impulse
+ volumed T2 level
+ volumed 2Sp+
+ 1/2 correction
+ weak test"

Aggressive Trend Trade 1HAggressive Trend Trade 1H
- short trend
+ volumed T1
+ support level
+ biggest volume 2Sp+
Daily Trend
+ long impulse
+ T2 level
+ support level
+ 1/2 correction"
Monthly CounterTrend
"- short balance
+ expanding ICE
+ support level
+ unsuccessful biggest volume manipulation"
Yearly Trend
"+ long impulse
+ 1/2 correction
- below exhaustion volume?
- below SOS"
Will add more when 5M, 1H or 1D will show entry point

PLUG 1D Investment Long Aggressive Trend TradeAggressive Trend Trade
- short impulse
+ volumed TE / T1 level
+ support level
+ biggest volume 2Sp-
+ weak test
+ first buying bar close level
Calculated affordable stop limit
1 to 2 R/R take profit
Monthly Trend
"+ long impulse
+ support level
+ T2 level
+ biggest volume reaction bar
= below 1/2 correction"
Yearly CounterTrend
- short impulse

PLUG 1H Long Swing Conservative Trend TradeConservative Trend Trade
+ long impulse
+ 1/2 correction
+ volume zone
- strong approach
+ ICE level
+ support level
+ volumed Sp
Calculated affordable stop limit
1 to 2 R/R take profit
Daily Trend
"- short impulse
+ volumed TE / T1 level
+ support level
+ biggest volume 2Sp-
+ weak test"
Monthly Trend
"+ long impulse
+ support level
+ T2 level
+ biggest volume reaction bar
= below 1/2 correction"
Yearly CounterTrend
- short impulse
Will add more after successful test on 1H and / or after test completes on 1D.

BRENT outlook: Watching for a move toward the upper boundary (D)Price is currently trading within a broad range, and the main expectation is a move toward the upper boundary — but confirmation is key.
I'm watching the high of the May 22 bar as a key level, since it holds the highest traded volume in recent days.
If price breaks and holds above 64.987 ,
🎯 First target: 67.791
🎯 Second target: 68.619


is selling being absorbing near 23350 level ?yesterday 27 April I mentioned that nifty must have to break & sustained 23350 level it happened today but long upper wick on hourly time with high volume been noticed showing selling pressure in market of course market bullish momentum still intact it respected the near 23800 level trading above 20 EMA but we need to wait more multiple testing for confirmation to continue upside journey so consolidation may happen in 2-3 days.

GOOGL 1H Swing Long Conservative Trend TradeConservative Trend Trade
+ long impulse
+ 1H / 1D level coincide
+ T2 level
+ support level
+ biggest volume 2Sp-
Calculated stop limit
1 to 2 R/R take profit
Daily Trend
"+ long impulse
+ JOC test / T2 level
+ support level
+ 1/2 correction"
Monthly Trend
"+ long impulse
+ T2 level
+ support level
- before 1/2 correction"
Yearly Trend
"+ long impulse
- T1 level
- resistance level"

OGKB 5M Investment Aggressive CounterTrend TradeAggressive CounterTrend Trade
- short impulse
+ biggest volume T1 level
+ biggest volume 2Sp-
+ weak test
+ first bullish bar close entry
Calculated affordable stop limit
1/2 yearly level take profit at 0.459
1H Counter Trend
"- short impulse
+ biggest volume TE / T1 level
+ support level
+ volumed 2Sp-"
1D Trend
"+ long impulse
+ JOC level
+ support level
+ 1/2 correction
+ volumed manipulation"
1M Trend
"+ long impulse (in 1d 4h)
+ neutral zone"
1Y CounterTrend
"""- short impulse
+ 2Sp-
+ perforated support level"""

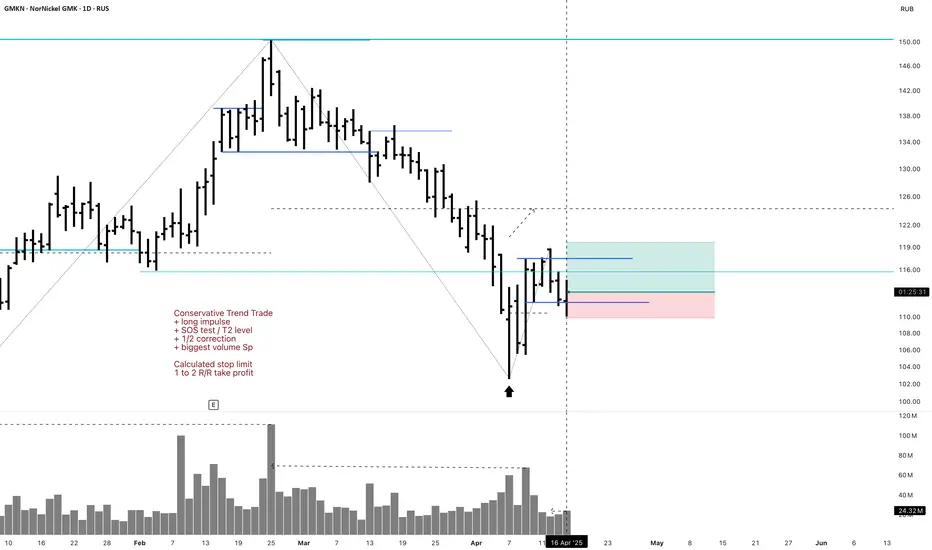
GMKN Long 1D Investment Conservative Trend TradeConservative Trend Trade
+ long impulse
+ SOS test / T2 level
+ 1/2 correction
+ biggest volume Sp
Calculated stop limit
1 to 2 R/R take profit
Monthly Trend
"+ long impulse
- SOS reaction bar level
+ 1/2 weak correction"
Yearly Trend
"+ long impulse
- below SOS
+ 1/2 correction"
ALRS 1D Long Investment Aggressive CounterTrend TradeAggressive CounterTrend Trade
- short impulse
+ volumed T1
+ support level
+ biggest volume Sp
+ weak test
+ first bullish bar close entry
Calculated affordable stop limit
Take profit
1/3 - 1 to 2 R/R
1/3 - 1D T2 / 1M T2
1/3 - 1/2 of 1Y
Calculated affordable stop limit
Take profit
1/3 - 1 to 2 R/R
1/3 - 1D T2 / 1M T2
1/3 - 1/2 of 1Y
Monthly CounterTrend
"- short impulse
+ volumed TE / T1
+ support level
+ volumed Sp
+ test"
Yearly Trend
"+ long impulse
+ 1/2 correction
+ T2 level
+ support level
+ manipulation"

VSA and PSA indicators on SUZB3VSA and PSA indicators, by Imamoglou, on SUZB3 showed a good correspondence in the 4h chart.

VSA and PA signals from Imamoglou for JBSS3 VSA and PA signals from Imamoglou for JBSS3.
Possible moment to sell JBSS3, or to buy PUT.

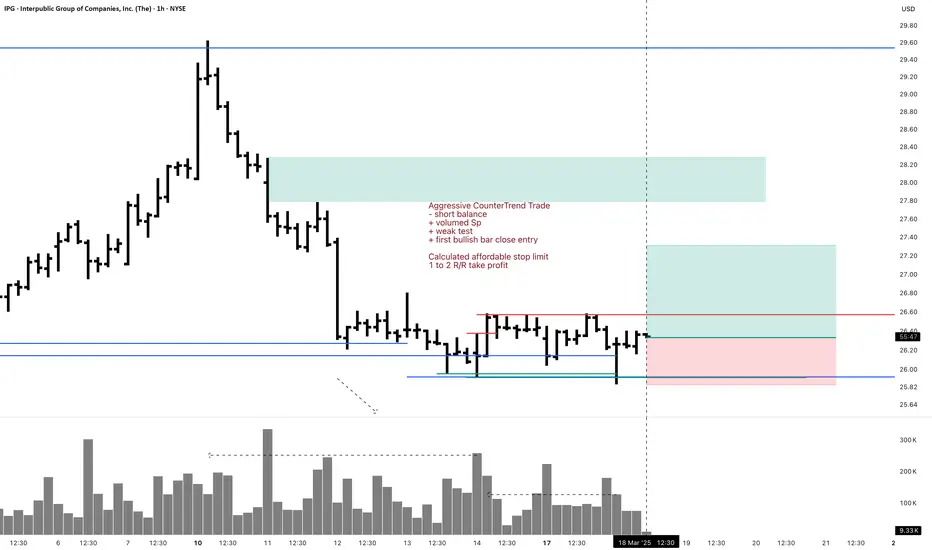
IPG 1H Swing Long Aggressive CounterTrend TradeAggressive CounterTrend Trade
- short balance
+ volumed Sp
+ weak test
+ first bullish bar close entry
Calculated affordable stop limit
1 to 2 R/R take profit
Day CounterTrend
"- short balance
+ support level
+ volumed expanding ICE level"
Month CounterTrend
"- short impulse
+ support level
+ T1 level
- before 1/2 correction"
Year Trend
"+ long impulse
- correction"
POSI 1H Investment Long Aggressive Trend TradeAggressive Trend Trade
- short impulse
+ exhaustion volume
- resistance level
+ long volume distribution
Calculated affordable stop limit
1/2 1M take profit
1D Trend
"+ long impulse
+ support level
+ T2 level?
+ 1/ 2 correction
+ weak approach"
1M Trend
"+ long impulse
+ 1/2 correction
+ biggest volume expanding T1
+ support level
+ biggest volume manipulation"
1Y Impulse
+ long impulse

POSI 1H Swing Long Conservative Trend TradeConservative Trend Trade
+ long impulse?
+ exhaustion volume
+ support level
+ long volume distribution
Calculated affordable stop limit
1/2 1M take profit
1D Trend
"+ long impulse
+ support level
+ T2 level?
+ 1/ 2 correction
+ weak approach"
1M Trend
"+ long impulse
+ 1/2 correction
+ biggest volume expanding T1
+ support level
+ biggest volume manipulation"
1Y Trend
+ long impulse

F 1H Swing Long Conservative Trend TradeConservative Trend Trade
- long impulse
- volumed T2
+ support level
+ 1/2 correction
+ biggest volume Sp
Calculated affordable stop limit
1 to 2 R/R take profit
Day Trend
"+ long impulse
+ 1/2 correction
- neutral zone
- context direction short"
Month CounterTrend
"- short impulse
+ 1/2 correction
- unvolumed T1
+ support level
+ long volume distribution
+ biggest volume manipulation"
Year Trend
"+ long impulse
+ volumed T2 level
+ volumed 2Sp+
+ 1/2 correction
+ weak test"

F 5M Daytrade Long Aggressive Trend TradeAggressive Trend Trade
- short impulse
+ volumed TE / T1 level
+ support level
+ long volume distribution approach
+ biggest volume 2Sp+
- no test
Calculated affordable stop limit
1 to 2 R/R take profit before 5M T2
Hour Trend
"- long impulse
- volumed T2
+ support level
+ 1/2 correction
+ biggest volume manipulation"
Day Trend
"+ long impulse
+ 1/2 correction
- neutral zone
- context direction short"
Month CounterTrend
"- short impulse
+ 1/2 correction
- unvolumed T1
+ support level
+ long volume distribution
+ biggest volume manipulation"
Year Trend
"+ long impulse
+ volumed T2 level
+ volumed 2Sp+
+ 1/2 correction
+ weak test"

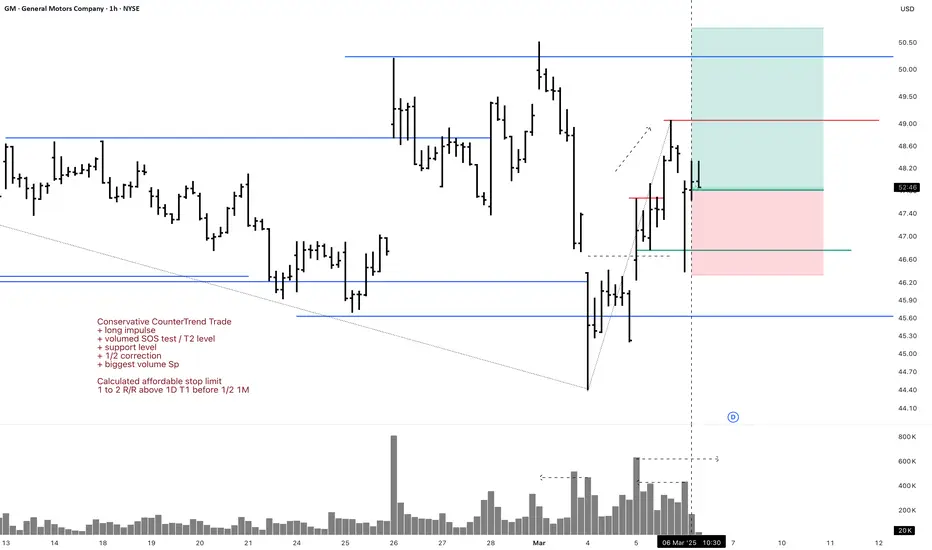
GM 1H Long Swing Conservative CounterTrend TradeConservative CounterTrend Trade
+ long impulse
+ volumed SOS test / T2 level
+ support level
+ 1/2 correction
+ biggest volume Sp
Calculated affordable stop limit
1 to 2 R/R above 1D T1 before 1/2 1M
Daily CounterTrend
"- short balance
- unvolumed expanding T1
+ volumed 2Sp+
+ test"
Monthly Trend
"+ long impulse
- below 1/2 correction
+ SOS test level?"
Yearly Trend
"+ long balance
- neutral zone"
Will add more if 5M corrects to 1/2 or 1H doest weak test and resumes buying