#Ethereum - thoughts out loud #10Good evening , we are from Ukraine!
For this period of time, the chart has a trading margin, the exit from which opens the door to 2 key levels:
1) A long scenario of breaking through the resistance level and going to 2300 and above.
2) Short, market weakness after a false breakout of 2200 and the price returning to the middle of the range with a further buyer's test at 1900 - 1850.
Thank you all for your attention, I wish you success.
Sometimes you win /sometimes you learn.
VSA

PFE 1H T2 level Upthrust in 1/2 correction and resistance levelDaily chart formation
Trend trade 3IBK
+ short balance
+ resistance level
- expanding CREEK
+ volumed 2 Ut
- month support level
Hourly chart:
Conservative trend trade 3IBK
+ short impulse
+ 1/2 correction
+ resistance zone
+ T2 level
+ volumed 2Ut

JPM 1H volumed spring of 1/2 correctionDaily chart signal
Trend trade 2IBK
+ long balance
+ support level
+ volumed ICE
+ volumed 2Sp + test
+ 1/2 correction
+ bullish bar closed entry
Hourly chart formation
Trend trade 2IBK
+ long balance
+ support level
- low volume expanding ICE level
+ 1/2 correction
+ volumed Sp + weakness test
+ after bullish bar close same level entry
Calculated affordable stop
1 to 2 target

MA 1H trend trade break under ice bar volumed testDay chart conditions:
Trend trade 1IBK
+ short balance
+ CREEK level
+ resistance level
+ 1/2 correction
Hourly chart:
Conservative trend trade 1IBK
+ short impulse
+ 1/2 correction
+ resistance level
+ BUI test
+ volumed 2Ut
+ better price level entry
Calculated affordable stop
1 to 4 target

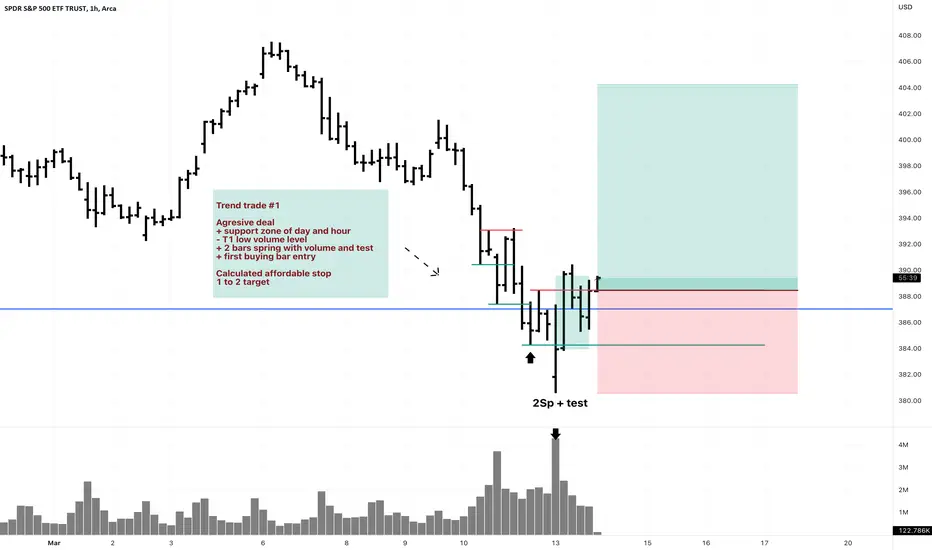
SPY 1H 2 bars spring with volume and test at day and support Trend trade #1
Agresive deal
+ support zone of day and hour
- T1 low volume level
+ 2 bars spring with volume and test
+ first buying bar entry
Calculated affordable stop
1 to 2 target
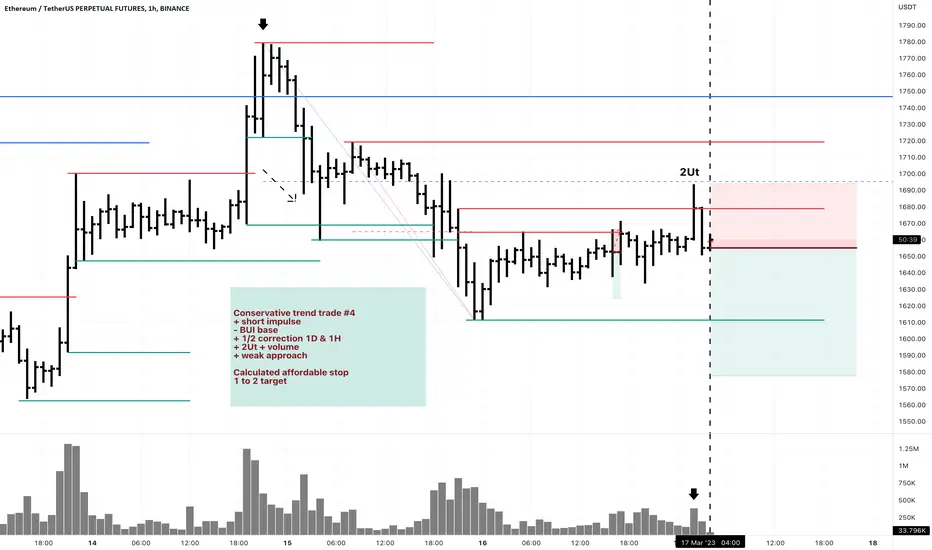
ETHUSDTPERP 1D short 2 Upthrust BUIConservative trend trade #4
+ short impulse
- BUI base
+ 1/2 correction 1D & 1H
+ 2Ut + volume
+ weak approach
Calculated affordable stop
1 to 2 target
Month chart analysis:
- long balance
+ resistance zone
+ CREEK level
+ 2Ut + volume
BRK.B 1D long conservative trend tradeConservative trend trade #2
+ long balance
+ volumed ICE
+ support zone
+ 2Sp + volume
Calculated affordable stop
1 to 2 target
Monthly chart analysis:
+ long balance
- neutral zone
+ 1/2 correction
+ volumed ICE
+ 2Sp + test

#Ethereum - thoughts out loud #9Good evening, we are from Ukraine!
Continuation of the movement.
Thank you all for your attention, I wish you success.
Sometimes youwin/sometimes you learn.

Live Trading Session: SMI,VSA and Stretch PrincipleOn this live trading session, we are looking at how we used the 3 principles of SMI,VSA and Stretch to take a trade and exit it especially by looking at the most important stats of how much move is left upon point of entry,otherwise known as open equity.

#Ethereum - thoughts out loud #8]Good evening, we are from Ukraine!
Continuation of the movement.
Thank you all for your attention, I wish you success.
Sometimes you win /sometimes you learn.

#Bitcoin - thoughts out loud #06Good evening, we are from Ukraine!
Extension of the agreement. The action plan remains unchanged. A mistake made by UT without confirmation.
Restart. The targets are unchanged.
Thank you all for your attention, I wish you success.
Sometimes you win/sometimes you learn.
#Bitcoin

Volume Spread Analysis Explained - Buying From Panicked SellersWas UBS a great buy last week, watch this and understand what really moves price, and its not the news, its the "Smart Money"!

#Bitcoin - thoughts out loud #05Good evening , we are from Ukraine!
The price range has been reached. Next, I assess the weakness of the acquisition recovery. UT is fixed, UTAD is possible. I'm going to support the trade.
Thank you all for your attention, I wish you success .
Sometimes you win /sometimes you learn .
#Bitcoin

BRWLDON'T HOLD THIS KIND OF CRYPTO FOR A LONG TIME. You'll need to determine how to exit your trades.

#Bitcoin - thoughts out loud #04Good evening , we are from Ukraine!
I'm finishing the previous idea and continuing the new one.
Action plan for this trade:
I'm waiting for UT/UTAD because there is liquidity there, then confirmation. I'm targeting the price of 25652.
Good luck to everyone!
Thank you all for your attention, I wish you success.
Sometimes you win /sometimes you learn .
#Bitcoin

#Bitcoin - thoughts out loud #02Good evening , we are from [b ]Ukraine!
At the price of 19549.09 , there is a resumption of acquisitions, as I said in the previous idea.
The deal is for the current period of time.
I'll continue with the previous idea.
Thank you all for your attention, I wish you success.
Sometimes you win /sometimes you learn .
#Bitcoin


#Bitcoin - thoughts out loud #19Good evening , we are from Ukraine !
There is "strength" on the chart, and I'm waiting for the asset to gain in value for further distribution.
Thank you all for your attention, I wish you success .
Sometimes you win /sometimes you learn .
#Bitcoin

#Bitcoin - thoughts out loud #01Good evening , we are from Ukraine!
Thank you very much to everyone!
Namely, to the Almighty
Thank you all for your attention, I wish you s ucce ss.
Sometimes you win /sometimes you learn .
#Bitcoin

NZDJPY 4.5 RR ShortHigh probability NZDJPY Short Trade
Volume Spread Analyse:
1. high volume: at low in comparison to high => at higher timeframe structure
2. high volume at low in comparison to high => at lower timeframe structure
=> high volume at lows => means a lot of Liquidity/ Money at lows => high probability that the price reach this levels
breakeven: at low of lower timeframe structure

USD JPY Absorbtion Hello Everyone i just want to share my VSA (Volume Spread Analysis ) to you people so you can understand that how beautifully volume and spread works and as you can see I have shared D1 chart analysis Price has break the level with increasing volume which we called absorption and now we have to wait for the price to come at support with low volume and in the near of support make Test / Shake out sign of strength and after that we can enter in the market with long position up to the resistance level is marked.
have a nice weak ahead
Put your SL below the absorption bar when price will came to retest , so your SL will be smaller and reward will be higher.

Bull Bear Power Void with a Killer Exit IndicatorWelcome to the coffee shop everybody and this is your host and baristo Eric. the bull bear power void has had a massive update since the last time I have been in the shop. So thanks for joining me on this one.
THE BACKGROUND:
I have recalculated the background to show you when you are looking for Longs and when you are looking for short trades. It's simple enough and the background is either red or green to tell you early that the trend has changed. just because the background color is red doesn't mean enter short it means that a retest is coming and a Divergence is about to complete. The same thing goes for green. when it changes to Green it means that a retest is coming or that I Divergence is about to complete and you trade into that direction.
The light blue filter is called the Volume regression moving average. this does a really good job of telling you exactly what's happening with volume as it's moving along. it calculates against the highs and lows of the immediately closed volume bars so when you break a previous high or a previous low then you know you have broken a range and you have maintained a new structure.
breaking a previous high or previous low also means that you can either trade to the long side or to the short side. This is just an added confirmation to layer into your background and your volume bar colors.
VOLUME BAR COLORS.
Speaking of the colors of the volume bars. I've changed them to make them a little bit more intuitive for people. Now it's really simple. if you have dark colors like dark green and dark red then you know volume is moving to the upside. if you have light colors like light green and light red volume is moving to the downside.
These colors are irrelevant to the location of the bar meaning it doesn't matter if the bar is liked or dark color above zero or below zero.
if you get a dark color below zero you're still moving up anyway because up is always up and down is always down.
the short of it is dark colors mean long light colors mean short.
The final Clincher of the updates to the bull bear power void is another filter using a hull moving average calculation.
in this oscillator it's shown as a purple moving average. this does an excellent job of telling you when a pullback is over or a trend is over or a trend has lost its momentum. it is the final layer of Confluence to tell you that the move you were in is over or it's on pause.
the bottom line is that this purple moving average is to be used as an exit indicator not an entry indicator.
When the light blue and the purple moving averages cross each other above closing volume or below closing volume is when you have a strong move in the opposite direction. These two moving averages combined are always pushing volume away from it.
as you watch your charts you'll notice that primarily volume will exist inside of these two moving averages in other words you will have these two moving averages at the bottom of your panel volume will exist above them and then the zero level would be there if this is the case you have an uptrend.

US DOLLAR WILL RISE AGAIN !!!the price reach a good level as demand area also we have a good signal by VSA and MACD divergence
which is matching with our weekend analysis with volume profile
our targets levels and stop loss as shown on the chart
