<TradeVSA> Identify Healthy Pullback in MCEMENT ? Sign of Strength in the chart:
1. Uptrend trendlines for weekly and daily chart
2. Pullback after breakout
3. Monitor for Sign of Strength at the lowest trendlines
Disclaimer
This information only serves as reference information and does not constitute a buy or sell call. Conduct your own research and assessment before deciding to buy or sell any stock
VSA


<TradeVSA> No Sign of Weakness yet in QESSign of Strength in the chart:
1. Re-accumulation with Effort Bars
2. Green Pentagon high volume
3. Pullback with price moving with trendlines
Disclaimer
This information only serves as reference information and does not constitute a buy or sell call. Conduct your own research and assessment before deciding to buy or sell any stock

<TradeVSA> Continuation in Uptrend after PullbackSign of Strength in the chart:
1. Pullback Completed with Red Pentagon low volume & Green Pentagon high volume
2. Price moving with trendlines
Disclaimer
This information only serves as reference information and does not constitute a buy or sell call. Conduct your own research and assessment before deciding to buy or sell any stock
<TradeVSA> AAPL to re-test Resistance Again?Sign of Strength in the chart:
1. Green Pentagon with price above 20/40ma
2. Price moving along with trendlines
3. Lots of Sign of Strength near support
Disclaimer
This information only serves as reference information and does not constitute a buy or sell call. Conduct your own research and assessment before deciding to buy or sell any stock

<TradeVSA> Pullback Completed in TeslaSign of Strength in the chart:
1. Green Pentagon above 20/40ma
2. Test and Spring bar near support
3. No sign of weakness or Red Pentagon yet
Disclaimer
This information only serves as reference information and does not constitute a buy or sell call. Conduct your own research and assessment before deciding to buy or sell any stock

<TradeVSA> Axcelis (ACLS.Nasdaq) Pullback with VCP SetupSign of Strength in the chart:
1. Reaccumulation with VCP Setup
2. Break out above UT
3. NS signal at Pullback
Disclaimer
This information only serves as reference information and does not constitute a buy or sell call. Conduct your own research and assessment before deciding to buy or sell any stock

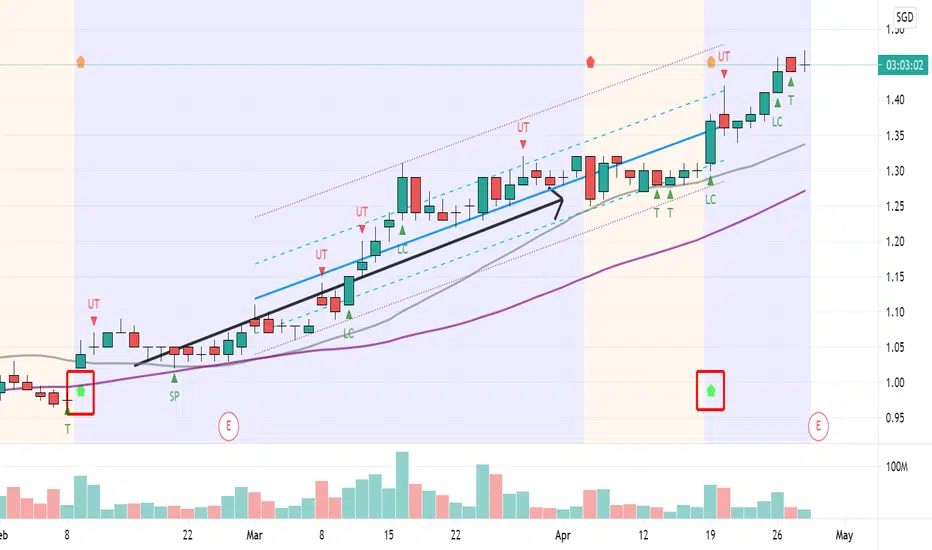
<TradeVSA> Strong Uptrend in Golden Agri-Res Sign of Strength in the Chart:
1. Uptrend with Pullback
2. Green Pentagon high volume
3. Overtake UT
Disclaimer
This information only serves as reference information and does not constitute a buy or sell call. Conduct your own research and assessment before deciding to buy or sell any stock

<TradeVSA> Weakness in Top Glove? Exit or Hold ?Sign of Strength and Weakness in the chart:
Hourly Chart
1. UT high volume follow by Red Pentagon
2. Spring as support with price in 20/40ma
Take note on the next Green Pentagon and CoC for Pullback Entry
Disclaimer
This information only serves as reference information and does not constitute a buy or sell call. Conduct your own research and assessment before deciding to buy or sell any stock

<TradeVSA> Pullback Completed in Prolexus. Similar like Gloves ?Sign of strength in the chart:
1. Trend reversal with high volume
2. Pullback with Green Pentagon in hourly chart
3. Low volume near support level
Disclaimer
This information only serves as reference information and does not constitute a buy or sell call. Conduct your own research and assessment before deciding to buy or sell any stock

<TradeVSA> Another Low Risk Trade Setup - MSCSign of Strength in the chart:
1. Re-accumulation
2. Double NS signal at support
3. High volume above 20/40ma
4. Volume increasing heading to resistance
Disclaimer
This information only serves as reference information and does not constitute a buy or sell call. Conduct your own research and assessment before deciding to buy or sell any stock

3 Malaysia Tech Stocks - D&O, QES, REVENUE Set to JumpAfter completion of a Wyckoff re-accumulation, these 3 Malaysia technology stocks - MYX:D&O MYX:QES and MYX:REVENUE set to rally to higher price targets.
In this video, you will find out the revised price targets based on the Point & Figure price target calculation together with potential entry based on breakout trading or pullback trading strategy.

Top 5 US REITs Poised to Resume The Bull Run (Targets Inside)REITs have been one of the market outperformers in the last 3 months despite the increasing of the market volatility.
In this video, you will find out the top 5 US REITs - NYSE:BRX , NASDAQ:REG , NYSE:UDR , NYSE:KRG , NYSE:RPAI poised to resume the bull run and start the markup phase (Wyckoff Phase E).

<TradeVSA> Another Pullback in Gloves. What's Next?Trades Setup in Gloves:
1. Trend Reversal with Volume
2. Pullback setup in hourly chart
3. Cluster of Closes in hourly chart
Monitor for next pullback opportunity for low risk entry
Glove Counters:
1. Top Glove
2. Supermax
3. Hartalega
4. Kossan
5. Comfort
6. Rubberex
7. Flexi
8. HLT
Disclaimer
This information only serves as reference information and does not constitute a buy or sell call. Conduct your own research and assessment before deciding to buy or sell any stock

<TradeVSA> Identify Low Risk Trades in 5 Minute1. Hartalega
2. Mclean
3. KGB
4. American Airlines
5. Jaks
Trade Setup:
1. No Supply Signal as support
2. 20/40ma as confirmation for trend
3. Green Pentagon for momentum
Disclaimer
This information only serves as reference information and does not constitute a buy or sell call. Conduct your own research and assessment before deciding to buy or sell any stock

<TradeVSA> SUPERMAX Pullback Completed?Sign of Strength in the chart:
1. Reversal with increasing Volume
2. Pullback in hourly chart
3. Green Pentagon high volume
Disclaimer
This information only serves as reference information and does not constitute a buy or sell call. Conduct your own research and assessment before deciding to buy or sell any stock

<TradeVSA> SUCCESS - Pullback in Daily & Hourly ChartSign of Strength in the chart:
1. Green Pentagon above 20/40ma
2. NS signal in daily chart
3. Pullback pattern in hourly chart
Disclaimer
This information only serves as reference information and does not constitute a buy or sell call. Conduct your own research and assessment before deciding to buy or sell any stock

USDJPY STILL GOING DOWN?We know in previous analysis that usd jpy still going down. Target is 107.825

Shorting on USDJPYUSDJPY could be still going to down. There is some buying effort but fail on test the resistence area. Maybe the price still going to support line. Option to go short is good idea target is on support line.

USDCHF CONTINUES TO GO DOWN?We could see that there is ultra high volume with low spread candle (yellow star symbol), then price go to resistence with the result price is going down.
The best scenario to go short is waiting price on supply area 1, then see test that happen to resistance area. If there is no demand that can surpass the resistence with easy, then the price is likely still going down to "target 1"

EURUSD ready to take long trade?From my previous analysis that happend as my scenario, we could see there is still some supply at resistance area (average vol), if there is no sign of weakness, then the price still could going up. Consider buying at above resistence area (with no supply/demand supass the resistance area).

BTC Distributing - Last Point of Supply Confirmed #WyckoffThe Wyckoff distribution setup has been in the making for over a week since March 31st and the breakout to the downside appears to be in progress
A drop to 54K is likely and a further move to 51K is possible

Volatility Contraction Patterns Spotted in LPLA, COHR, COF Volatility contraction patterns (VCP) which was popularized by Mark Minervini have been spotted in NYSE:COF , NASDAQ:COHR and NASDAQ:LPLA , which could be the signal prior to a start of the uptrend.
Find out how to trade the breakout with volatility contraction patterns to catch the potential explosive move to the upside.
