<TradeVSA> The Best Risk to Reward Trade Setup! No Supply Signal
1. Elsoft
2. DUFU
3. Supermx
Hit the "LIKE" button to support us :)
Disclaimer
This information only serves as reference information and does not constitute a buy or sell call. Conduct your own research and assessment before deciding to buy or sell any stock
VSA

nzdusd buy nzdusd simple method market breaaks the level and retest our level simply trade profitablity is almost 90%


NZDUSDNZDUSD is going to down trend just beacause market break the level and complete for retest so it can be happen market is going down

<TradeVSA> DBHD Pullback Completed !!!Strength in the chart:
1. Green pentagon
2. High volume Line Change
3. Pullback
Hit the "LIKE" button to support us :)
Disclaimer
This information only serves as reference information and does not constitute a buy or sell call. Conduct your own research and assessment before deciding to buy or sell any stock

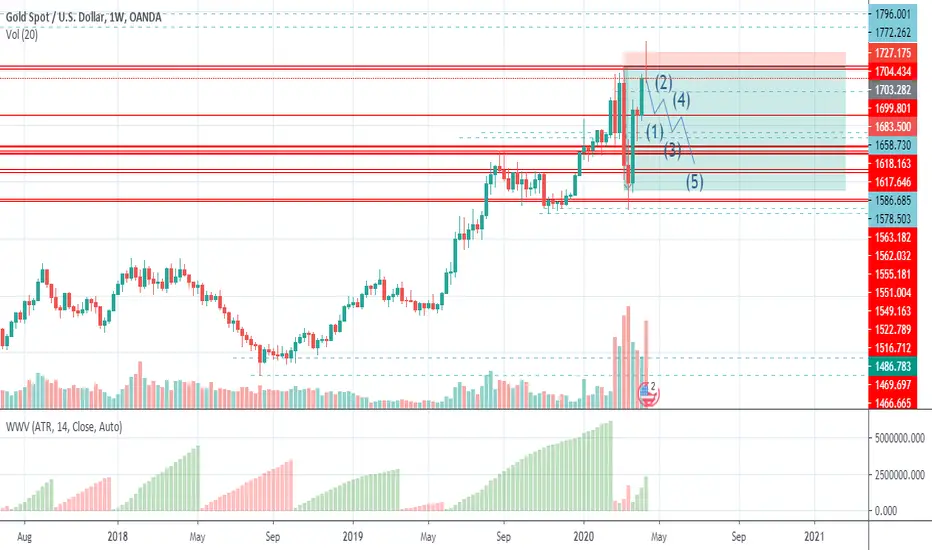
XAUUSDAs simple as that just because a big size of pendingorders in market thats why market reject the level and as you can see market is totally in down trend for next 1 month
Identifying support and resistance levels for day tradingCheck out my video on how to identify support & resistance and other key levels to prepare for day trading session.
I am using S&P 500 futures CME_MINI:ES1! as examples to prepare for trading session on 16 & 17 Apr 2020 (Thurs, Fri).
Key levels I pay attention to:
Previous day high
Previous day low
non-Regular Trading Hours (RTH) high
non-RTH low
Swing high from a few days ago
Swing low from a few days ago
Swing high/low formed during the trading timeframe (M3, M5).
The day trading process is very simple. Basically just to pay attention to how the price interacts with the key levels and trade on reversal or continuation.

Has the stock market hit bottom? Ways to tackle the marketAfter the bottom formed in 23 Mar 2020, the US stock market has been trending upwards and it has since gone up by 30% from the low. The S&P 500 index ( CME_MINI:ES1! ) has gone up from the low at 2174 to more than 2800 as of today. There are even dozens of stocks rallied up by 50–100% during the same period.
So, has the stock market hit a bottom already? Looking at the past events such as in 2008, 2000, 1987, etc…the bear market started from the peak on 20 Feb 2020 to the bottom on 23 Mar 2020, which lasted only slightly more than a month, could the shortest bear market in the history.
The momentum and speed of the V-shaped rebound from the low till now is also unusual compared to the past events. Let's take look at 2008 and 1987 to see if we derive anything useful out from the history markets. Watch the video for a walk through of the past market history.
The volatility index (VIX) has started to unwind since 18 Mar 2020. The texture and character from 6 Apr 2020 is different compared to the period from 24 Feb - 3 Apr 2020, which suggests a less volatile and more "normal" market session, where risk-on or risk-off mode corresponds to relevant assets.
For traders and investors, it is important to keep an open mind to consider different possibilities and have the right money management strategy that you are comfortable with before participating the market.


Dow Jones - supply absorption to rally up till overbought?Dow Jones futures ( CBOT_MINI:YM1! ) edged up slightly in the London session today as President Donald Trump will issue guidelines for the re-opening economies.
15 Apr 2020 recap - on the daily chart, Dow Jones futures had a reaction with slightly increasing supply, which broke the previous day's low but demand was seen in the afternoon session to push the price up.
Similar to S&P 500 futures movement, Dow Jones futures coiled within the bearish rising wedge pattern and broke down an hour before the US session due to bad retails sales data.
Despite falling 2% yesterday, excessive supply is not seen and the uptrend from 23 March is still intact.
Since bottom in March, shortening of the thrust is seen in the Dow Jones futures, suggests the buying momentum is fading. However, as I mentioned, until there is evidence of increasing of supply to take the price down, we are likely to see Dow Jones to inch up further, possibly to around 25000 as illustrated. This also coincides with the overbought area of the rising wedge and the resistance zone.
Bias - bullish when Dow is above 22500–23000
Key levels - Resistance: 24000, 24800–25000 Support - 23000, 22500
Potential day trading setup for Dow Jones futures - look for a spring of 23000 or swing lows in H1(23200)to initiate a long entry.
Enjoy this video? Like the idea and hover my picture to follow me and subscribe my channel to get instant notification for my next ideas.

EURUSDSimple method for buying side market you can see a to bar reversal if the sign was confirm that we will go for a buy side and if markets break this level then we will go for selling side

S&P 500 futures pending supply, intraday trading is the planS&P 500 futures ( CME_MINI:ES1! ) slide more than 1% in the Asia session after OPEC plus reached a deal in record oil production cut of 9.7 million barrels per day.
On the hourly timeframe, S&P 500 futures dropped sharply at the opening candle to below the support level at 2750. Subsequently it is forming an apex formation during London session, suggests indecisiveness among the participants.
Just 2 hours before the opening of the US markets, ES broke out from the apex formation and currently testing the resistance zone around 2770 and the opening candle today.
If the price action fails to commit above 2770 and broke below 2750, it is likely to swing down to test the next support level at 2700.
Should the supply emerge, this could be a start of a larger down move to test the support at low levels or even the selling climax low at 2174.
Bias - neutral to slightly bearish.
Key levels - Resistance: 2800 Support: 2750, 2700, 2630
Potential setup for S&P 500 futures -pay attention to how the price interacts with the apex formation. Either direction be traded. Always judge the market by its own action.

EURGBP: Potential Bullish ReversalChart is self explanatory
DISCLAIMER:
Any opinions, analyses discussed in this presentation are just my personal opinion and do not constitute investment advice.
I do not accept liability for any loss or damage, including without limitation to, any loss of profit, which may arise directly or indirectly from use of or reliance on such information.
PRICE ACTION only tell half the story. The other key half is VOLUME. For VOLUME drive price.

Possible inch up for S&P 500 Futures until emergence of supply9 Apr 2020 recap - S&P 500 e-mini futures ( CME_MINI:ES1! ) attempted to break 2800 but encountered strong supply. Though supply was present on Thursday session, there is no significant bearish result. In fact, there is some absorption of the supply as shown in the demand tails on the H4 chart.
The presence of supply has caused shortening of the upward thrust, but it is not that threatening at the moment. Until we see emerging of supply together with bearish price action, it is possible for S&P 500 futures to inch up to test higher targets at around 2850 before a start of the down move to test 2700.
Should ES broke 2750, 2700 is an important level to defend in order for the up trend to be intact.
Bias - bullish (Anticipate limited upside).
Key levels - Resistance: 2800-2850 Support: 2750, 2700
Potential intraday setup - look for a test of 2750 to initiate long entry. There are also some trading opportunities by leaning on the smaller timeframe structures (such as M3, M5).

Crude oil futures slump on OPEC+ production cut9 Apr 2020 recap - just when every one cheers up on a deal among Saudi Arabia, Russia and OPEC regarding production cut, crude oil futures( NYMEX:CL1! ) was sold into strength and broke the support at 24.
Crude oil had a jump initially to test 28 but was quickly rejected and dropped below 24.
Volume has increased during the slump of the crude oil futures together with big spread.
Since 18 Mar 2020, crude oil futures has been stuck between a trading range 19–28. Supply is present at the upper trading range
Bias - bearish. Expect a test of the support and demand zone around 22.
Key levels - Resistance: 27–28, Support: 19–20, 22
Potential setup - look for a test of 24–25 to initiate a short position on lower timeframe.

Will it happen again for S&P500 Future ES using analog from 20088 Apr 2020 recap - S&P500 e-mini futures CME_MINI:ES1! had a strong rally up and closed near the high around 2750. The strong price action has totally ignored the bearish tone set in 7 Apr 2020, where ES was up more than more than 3% but closed down on the day.
In 2008, similar situation had happened a few times, such as on 3, 14, 17 Oct 2008. Every times after the price rejection, ES started a downswing. If we pay close attention to 17-18 Oct 2008, it is similar to ES current situation (7-8 Apr 2020) because the rejection bar was followed by a strong demand bar both in 2008 and 2020. Yet, a down swing was followed in 2008 after the strong demand bar, as shown in the chart as illustrated.
Historical analog is good for reference and keep us to anticipate potential scenarios. However, always trade according to the charts.
So far, ES does not show any emergence of supply., which is a bullish sign. Could it grind higher to stretch to around 2800?
Bias - neutral. A range bound between 2630-2750 can be expected. A break below 2600-2630 will validate the up thrust scenario. A break above 2750 should see a test of 2800.
Key levels - Resistance: 2750-2780 Support: 2700, 2600-2630.
Potential intraday setup - A short entry is preferred. Pay close attention on how the price interacts with the key levels, swing high, swing low, neckline, etc...

Up Thrust of ES S&P500 future - What's next move?7 Apr 2020 recap - S&P500 e-mini futures (ES) tested the target around 2700-2770 yesterday and had an up thrust movement on level 2700 before closing below 2650, as per my trading idea yesterday. It had a great run-up during the non regular trading hours (RTH). However, weakness did show up during the US session. ES was rejected from the target 2700-2770 with increasing supply. The down wave is the greatest for the H1 trend started from the low at 2450, suggests a change of character, which means that the up move could stop at least for now, into a trading range or even a reversal to move down.
During today's non-RTH session, ES had a weak rally up, tested only 50% of the last hour bar from yesterday followed by a reversal bar, which could be a sign of weakness. Should ES break below the support levels at 2600-2635, it could test lower targets like 2400-2450 or even the selling climax's low at 2174.
However, if the levels 2600-2635 are defended, with absorption characteristics, ES could test the swing high at around 2750 and possible to grind higher.
Bias - bearish. Expect a break of 2600-2630 to test lower.
Key levels - Resistance: 2650-2700 Support: 2600-2630. Swing high and swing low from lower timeframe.
Potential intraday setup - look for an up thrust or test of swing high at 2658, 2680 and/or key levels followed by a reversal to short. If ES can commit below 2600, I will consider to switch the position to swing trade instead of day-trading.

ES S&P500 future - breakout to start a bull run? Analog inside6 Apr 2020 recap - S&P500 e-mini futures (ES) had a great rally to take out the immediate resistance at 2525 during the non-Regular Trading Hour (RTH) and to further commit above 2600-2635 during the RTH. Since ES broke out the trading range between 2440-2630, it is expected to test the higher target at 2700-2770.
It is worth noting that the upside target at 2700-2770 coincides with :
Fibonacci retracement of around 50% from the top (3397) to the selling climax (SC) low of 2174, as shown in the daily chart.
Axis line or flip zone where there is strong resistance and supply available, as shown in the H4 chart.
During the crash in Jan 2018, ES did up thrust twice before it came down to test the selling climax low. Using Jan 2018's event as an analog, we should be aware that an up thrust is a possible scenario.
Bias - Slightly bullish. Expect ES to test the upside target but also prepare n up thrust bearish scenario similar to 2018.
Key levels - Resistance: 2700-2770 Support: 2600-2635. Swing high and swing low from smaller timeframe
Potential intraday setup - look for an up thrust or test of the key levels / smaller timeframe for a short entry. Possible long entry at the support should it happen.

Is the ES rally done yet? What's next?3 Apr 2020 recap - ES did rally to level 2525 and was rejected again. In smaller time frame (M1, M3), it did provide great short entry after the up thrust of the level. However, ES only managed to test 2450 and bounced up from there. The low volume without aggressive demand caused ES to drift down. Should ES still stuck below 2525, it should break down to test 2400 or even lower (i.e. the Selling climax's low), under the background of lacking of demand.
Daily - After a sharp sell off, ES formed a selling climax (SC) low at 2174 followed by an automatic rally (AR). Now, it seems like the rally is coming to and end. The next move would be a secondary test (ST) to test the selling climax's low. It could in a form of a higher low, similar low or even lower low. Oct 2008 global financial crisis could provide a good analog for reference. Could we see a down-sloping accumulation structure similar to 2008?
Weekly - a megaphone structure is formed. ES could potentially test the low as illustrated should a down-sloping structure in progress. This won't surprise me given the COVID-19 situation is getting worse every day and the impact on the businesses.
Bias - bearish. If ES fails to commit above 2525, it should break down to test 2400 or lower, sooner or later.
Key levels - Resistance: 2480, 2525. Support: 2450, 2400.
Potential intraday setup - Look for a test or up thrust of the key levels and/or smaller timeframe to initiate a short entry. Yet, I will pay close attention for long opportunities like a spring of the swing low, shortening of the downward thrusts, etc... should it arise.
Stay safe and happy trading!

ES price action analysis for 3 Apr 2020 trading plan
2 Apr 2020 recap - Although yesterday was a bullish day, the character does not confirm this. It started with ugly numbers of jobless claims, which drove ES down to spring the low (around 2433) of the previous day followed by a rally up to test 2525 thanks to a spike up in crude oil.
It was highlighted in M15 chart that the 2 candles tested the 2525 level has volume spike, suggests the demand was met by supply at this level.
On the daily chart, candle b (yesterday) has slight increase of volume compare to candle a, yet the result (to the up side) is mediocre. The rally from yesterday only reached about half way of the previous down candle. This suggests supply was present and managed to stop the up move at level 2525.
Bias - slightly bearish. If ES fails to break above 2525 with aggressive demand, it might break below the swing low at 2425 and test further down.
Potential intraday setup - Look for how ES interacts with 2525 or structures in smaller timeframe. A short entry after a test or up thrust of level 2525 is preferred.
Key levels - Resistance: 2500, 2525 Support: 2450, 2425. Swing high and swing low from lower time frame.
Note: Since yesterday has increase of supply, it is important to see how significant is the reaction. A trading range between 2425-2525 will be neutral. A break above 2525 is bullish and expect continuation of the rally. A break below 2425 should draw out more supply to test 2380 or lower.

ES price action analysis for 2 Apr 2020 trading plan
1 Apr 2020 recap - Major movement of ES happened during non-RTH. Level 2450 was tested from the last 4 H1 bars and defended eventually. The last hour bar did spring the prior swing low and form a demand tail. The magnitude of the down move might be significant but without aggressive supply. Daily volume is slightly lower than the previous day (31 Mar 2020). Result - did not commit below level 2550 and the swing low formed on 30 Mar 2020, suggests a bounce up from here.
A trading range between 2450-2630 is expected. The down-sloping accumulation structure since 12 Mar 2020 is still valid. ES could have gone through a sign of strength (SOS) rally from 24-26 Mar 2020 and currently on a backup action before marking-up higher.
Bias - Break above 2500 to challenge levels 2550, 2600 and the swing high (2630).
Potential intraday setup - look for possible continuation of the rally if committed above 2500. Else, short into an up thrust of level 2500. Pay close attention on how ES interacts with the key levels for reversal trades. It is possible to switch to swing trade should the close is favorable.
Key levels - Resistance: 2500, 2550 Support: 2450 ; Prior day high 2509 and day low 2434; Swing high and swing low from lower time frame.
Note: bullish bias is maintained until emergence of aggressive supply. During the unwinding of the volatility, expects relatively normal session without huge swing (up or down).

<TradeVSA> Potential Setup, Entry & Exit1. Lii Hen
2. Scientex
3. Public Bank
Hit the "LIKE" button to support us :)
Disclaimer
This information only serves as reference information and does not constitute a buy or sell call. Conduct your own research and assessment before deciding to buy or sell any stock
