Gold (XAU/USD): A Classic VSA Short Setup in PlayHey Traders,
Following up on the general weakness we discussed in Gold, here's a closer look at a specific trade setup that's unfolding right now. This is a textbook example of a high-probability short setup according to Volume Spread Analysis (VSA).
Let's break down the story the volume is telling us.
1. The Breakdown: Sellers Show Their Hand
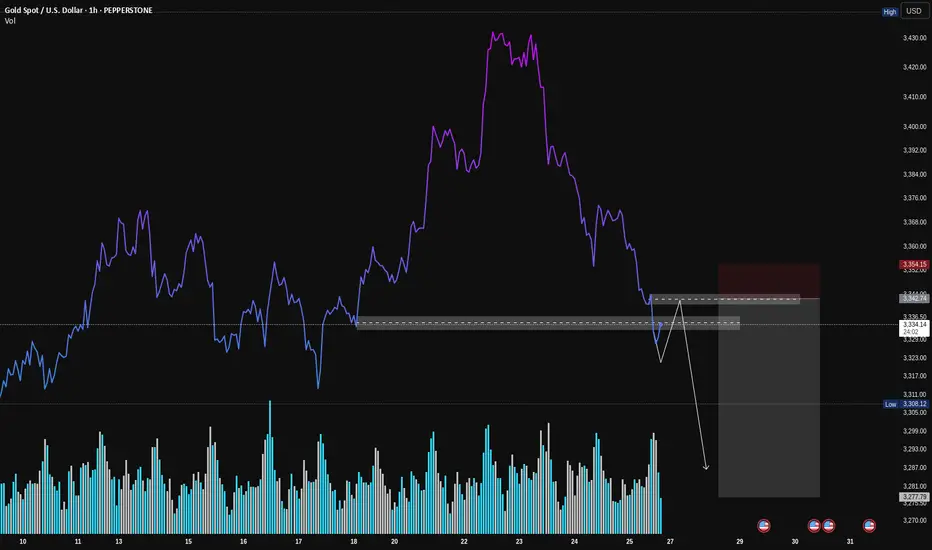
First, look at how the price broke down hard through that support level (the grey box). Notice the volume on that sharp drop? It was high. This is our clue that sellers are strong and in control. They had enough power to smash right through a level that was previously holding the price up.
2. The Retest: Buyers Don't Show Up
Now, the price is creeping back up to that same exact level. But here's the most important clue: look at the volume on this rally. It's much lower than the volume on the breakdown.
This is what VSA calls a "No Demand" rally. It’s like the market is trying to push a car uphill without any gas. It tells us that strong buyers (the "smart money") have no interest in buying at these prices.
3. The Setup: Selling into Weakness
This combination creates a classic short setup:
Logic: We are looking to sell at a level where old support has flipped into new resistance.
Confirmation: The low volume on the retest confirms the rally is weak and likely to fail.
How to Potentially Trade It
The grey box represents a high-probability entry zone. To time an entry, you could watch for a clear rejection signal right inside this zone. For example:
A "rejection candle" (like a pin bar) that pushes into the zone but gets slammed back down.
An up-bar with a tiny body and very low volume, showing buyers are completely exhausted.
Seeing one of these signs would be the final confirmation that sellers are about to take back control.
Conclusion:
This is a powerful setup because all the pieces line up: the background is weak, sellers have shown their strength, and buyers are now showing no interest at a key resistance level.
Disclaimer: This is my personal analysis using VSA and is for educational purposes only. It is not financial advice. Always do your own research and manage your risk. Good luck, traders!
Vsamethodology
Is Smart Money Selling Gold? A VSA LookHey Traders,
Let's take a look at the Gold (XAU/USD) 1-hour chart using Volume Spread Analysis (VSA). The price made a strong run-up to a new high around $3,438, but the volume is telling us a story of potential weakness.
Here’s a simple breakdown of what I'm seeing.
The Trap at the Top (Signs of Weakness)
Think of the market as being moved by "smart money" (professionals) and "herd money" (the crowd).
Climax Volume: See that huge volume spike right at the peak on July 23rd? While it looks like strong buying, this is often a classic sign of a Buying Climax. This is where smart money starts selling their positions to the excited crowd who are buying at the top, fearing they'll miss out.
No Real Buyers Left: After the peak, notice how the price tried to push higher a few times but on much lower volume? This is a "No Demand" signal. It’s like a car trying to rev its engine, but it's out of gas. It shows there isn't enough buying power to push the price any higher.
Sellers Take Control: As the price started to fall from the top, look at the volume on the down bars. It got bigger. This tells us that supply (selling pressure) is now in control, and they are pushing the price down with force.
Where Are We Now?
The price has dropped and is now hovering around the $3,330 area. The volume has dried up for now, which means the market is taking a pause and deciding where to go next.
What to Watch For Next
Based on the VSA story, here are two possible scenarios:
Scenario 1 (Bearish 📉): The weakness continues. If we see the price try to rally from here but the volume is very low, it would be another major red flag. It would suggest sellers are still in control, and we could see a break below the recent low of $3,320 for another leg down.
Scenario 2 (Bullish 📈): This is a bear trap. For this to happen, we would need to see a strong sign of buying returning. For example, a sharp drop on massive volume that is quickly bought back up. This would signal that the sellers have been absorbed and smart money is starting to buy again.
Conclusion:
For now, the evidence points more towards weakness. The action at the top suggests that smart money was distributing (selling) their gold.
Key Takeaway: Be cautious of any weak-looking bounces. The sellers appear to have the upper hand until we see a clear sign of strength with high buying volume.
This is not financial advice. This is just my interpretation of the chart using VSA. Always do your own research and manage your risk. Good luck trading!

Bitcoin Market Cap Breakout Potential | Bullish SetupThis 1-hour chart for the Bitcoin market cap ( CRYPTOCAP:BTC ) suggests a potential bullish breakout.
🔹 Major Support: The price recently tested and respected a strong support zone, indicating buyers are stepping in.
🔹 Triangle Formation: A symmetrical triangle is forming, which typically leads to a breakout.
🔹 Weak High & ATH Target: If the breakout occurs, the market cap could push past previous highs, targeting the 1.88T level and beyond.
🔹 Bullish Scenario: A successful breakout above the triangle’s resistance may trigger an uptrend towards the weak high, followed by an attempt to reach new all-time highs (ATH).
💡 Key Levels to Watch:
Support: 1.65T
Breakout Confirmation: 1.66T+
Target: 1.88T
This setup suggests a bullish continuation, but a failed breakout could lead to a retest of support. Keep an eye on volume and momentum for confirmation.
What are your thoughts? Will BTC market cap break out soon? 🚀📈
#Bitcoin #BTC #Crypto #Trading #TechnicalAnalysis

Gold (XAU/USD) - Potential Liquidity Sweep Before ReversalGold has been in a strong uptrend, forming a rounded bottom pattern, which led to a breakout above key resistance. Currently, price is consolidating near the all-time high (ATH) around $3,005, suggesting a potential liquidity sweep before a larger move.
📌 Key Observations:
Rounded Bottom Formation: A bullish reversal pattern led to a breakout.
Consolidation Zone: Price is ranging just below the ATH, likely gathering liquidity.
Liquidity Sweep & Weak Highs: The chart suggests a push above the ATH to trigger stops before a potential reversal.
Projected Bearish Move: A break lower could lead to a corrective move towards $2,920 - $2,800 in the coming sessions.
⚠️ Trading Plan:
Bullish Scenario: A clean breakout above ATH with strong volume could invalidate the bearish setup.
Bearish Scenario: If the liquidity sweep occurs and price fails to hold above ATH, a strong sell-off could follow.
Traders should watch for confirmation signals before entering any positions. Stay cautious and manage risk effectively!
📊 What are your thoughts? Will gold continue higher or reverse? Share your views below!
#XAUUSD #Gold #Trading #Forex #LiquiditySweep #ATH

Bullish behaviour on NEM stockThe price of Newmont Corporation shares retraced to the areas where professional buying took place in the past (blue rectangles). The volume during that move down is decreasing, which, according to Volume Spread Analysis (VSA), is bullish behaviour.
Also, given that today's bar penetrates the recent demand zone and the professionals were buying there again, this stock looks very strong and has a high chance of reversal.
Closing above the $43.72 level followed by its testing on daily or lower (1H, 15 minutes) timeframes might start the rally towards $55.13 - $55.89 with resistance around $49.27 - $50.12.
If today's bar is tested and supply reappears during this process, we may expect an extension of the ongoing correction to the $37.53 - $38.37 area and another surge of buying there.

Strength on HPQ ChartHP Inc., stock approaches the bottom of the sideways channel (black horizontal lines) from which it may bounce again.
During the May 29, 2024 bar, professionals bought (blue rectangle), and since then, whenever the price reached this zone, they were buying more.
It should be noted that the buying around the bottom of the sideways is much bigger than the selling around its top which is bullish behaviour. Wyckoff's Spring on the recent activity adds to strength too. Another good sign for bulls is the decreasing volume on the down move, which indicates an absence of professional interest in lowering prices.
The testing process is ongoing as of today. If the price reaches the buying zone and no supply reappears, there is a big probability for a move up towards $37.30 - $ 39.29 with minor resistance around $34.62 - $34.72.
If supply reappears and the price breaks the bottom of the sideways channel ($32.41) we may see another leg down to $29.00 - $30.00 for more buying.

XAU/USD - Buy Limit Setup for a Bullish Reversal Overview
Gold (XAU/USD) is showing signs of a potential bullish reversal after a recent decline. A buy limit order is placed around the $2,911 level, targeting a move towards the $2,928 resistance zone. This setup follows a structured risk-reward approach with a stop loss below recent lows at $2,900.90.
Trade Setup
📍 Buy Limit: $2,911 (Key support zone)
📍 Stop Loss: $2,900.90 (Below recent lows for risk management)
📍 Take Profit: $2,928 (Major resistance zone)
📍 Risk-Reward Ratio: 1:2+
Technical Analysis
🔹 Support Zone: Price is testing a demand area where buyers previously stepped in.
🔹 Bullish Structure: After a sharp sell-off, gold is attempting a recovery.
🔹 Potential Reversal: Expecting price to trigger the buy limit before rallying towards resistance.
🔹 Volume Confirmation: Watching for increasing bullish volume near the entry.
Trade Plan
1️⃣ Wait for price to reach the buy limit zone (~$2,911).
2️⃣ Monitor price action for bullish confirmation (e.g., bullish engulfing, rejection wicks).
3️⃣ Ride the move towards the take profit zone (~$2,928).
4️⃣ If structure shifts bearish, adjust SL accordingly.
🔥 Gold remains volatile, so risk management is key! Watch for market reactions at key levels before entering the trade.
📊 Like & Follow for more gold trade ideas! ✅

GBP/USD - Weekly Liquidity & Fair Value Gaps AnalysisOverview
The British Pound (GBP/USD) is currently trading around 1.2652, showing a bullish recovery after sweeping weekly sell-side liquidity. Price has reacted from a weekly fair value gap (W.FVG) / BISI and is approaching key resistance levels.
Key Levels & Liquidity Zones
📌 Weekly Sellside Liquidity: Taken, leading to a bullish reversal.
📌 Weekly Buy-side Sweep: Possible target around 1.2774 (50% retracement).
📌 W.FVG // BISI (Bullish Imbalance Sellside Inefficiency): Acting as support.
📌 W.FVG / SIBI (Sell-side Imbalance Buy-side Inefficiency): A potential rejection zone around 1.2774.
Technical Outlook
🔹 Bullish Reversal: The price has bounced from key liquidity zones, suggesting further upside.
🔹 Fair Value Gaps (FVGs): The market has filled some inefficiencies but still has upside targets.
🔹 Potential Scenarios:
A continuation towards 1.2774 (weekly resistance & FVG fill).
A possible rejection at that level before resuming the trend.
Trade Plan
✅ Bullish Bias: Looking for pullbacks into support (W.FVG) for long opportunities.
❌ Bearish Confirmation: Rejection from 1.2774 could signal a retracement.
📊 Risk Management: Stop-loss placement below recent structure lows.
🔥 Watch these liquidity sweeps and fair value gaps for potential trading opportunities!
📌 Like & Follow for more trade ideas! 🚀

Strength on PCAR stock Paccar Inc. stock looks strong. We can see that since October 2024, the largest volume occurred after publishing earnings reports or on ex-dividend dates. Please note that:
- All bars on those days are down with the closing price in the middle of the bar which in Volume Spread Analysis (VSA) indicates strength.
- The volume on the October 22nd 2024 daily bar is the largest till now and the current price is above it.
- All professional activity after October 2024 is happening around the buying zone created during the October 22nd bar (blue rectangle $104.38 - $104.91).
- Recent buying (February 12th) breaks the previous low ($102.64) and recovers above that level which is a Wyckoff's Spring.
This all is very bullish. Still, the last testing showed the presence of supply.
If professionals can absorb the supply, we may expect a rally towards $116.01 - $117.83 with potential resistance in the $112.18 - $114.73 zone. Otherwise, another leg down to $100.01 for more buying is possible.

Strength on FMC stockAfter publishing the February 5th 2025 earnings report, the FMC Corporation stock gapped down, losing almost 34% of its value. Moreover, nowadays, the company is under serious pressure after being accused of publishing false Sales and Inventory information and downgrading shares from "Buy" to "Neutral" by some analytic companies (e.g. Redburn). Logically, in such circumstances, prices should continue down, but as a matter of fact, it is not the case. Why?
First, the February 5th bar is a down bar on a huge (largest in the last 15 years) volume, which, according to Volume Spread Analysis (VSA), indicates professional buying. Then, 2 days later, professionals bought again and the market responded by the higher prices.
Finally, the gapped-down bar reached the level of the previous support (blue rectangle on the daily and weekly charts), which adds strength.
Even though it looks very bullish on the daily chart, the price should be tested before the rally. Therefore, we may expect a shallow correction to $35.13 - $36.34 or, if supply is still there, to $30.80-33.73.
If testing is successful and the up move begins, the potential resistance on the way up will be around $48.06-$48.73 and $52.65 - $54.54 areas.

Weakness on HOOD stockRobinhood Markets, Inc. (NASDAQ: HOOD) shares appear to have sold off after publishing its February 12th earnings report. Following the report's good news, the market gapped up on opening and triggered a buying surge, allowing professionals to sell. The next day, the price recovered on a significantly lower volume, indicating absence of the professional interest on the upside (weakness). Then, on February 18th, another selling took place, which absorbed the remaining demand and pushed the price below the low of the gapped-up bar. This is bearish behaviour.
It has to be noted that there were a few more selling activities in December 2024/January 2025 (red rectangles), making the overall situation on the stock even weaker.
Despite the serious weakness, we may still see a retracement up into the $62.09 - $65.21 area for either more selling or retesting of demand, after which a move down to the $41.04-$42.66 zone could be expected. In this case, the support might reappear around the $52.96 level and at the $49.56 - $50.19 area.

Strength on MRNADespite negative news, Moderna, Inc. stock is in a good position to rally. Its price has been falling since August 2021, but relatively big buys have begun to emerge since August 2024.
It has to be noted that on every bar with buying, volume is increasing, which is usually a sign of accumulation on a down move.
If the price breaks the $40.83 level (the high of the bar with the largest volume), then tests it on low volume later, and supply does not re-emerge in the $49.94 - $56.70 zone, this would signal the end of accumulation. In such a case, we could expect the move towards $102.90 - $118.10, and if shares would not be sold off there, it might go even higher to $156.94 - $163.19.
At the same time, if accumulation has not been finished yet, we may still see another leg down for more buying.

Weakness on DIS stockThe stock of Walt Disney Company looks interesting from the VSA point of view.
The monthly chart shows that the price is now around the top of the horizontal channel formed after a year of down move (blue lines). On one side, there is professional buying in the background, which might resolve this sideways to the upside, but there is much more supply around market peaks from the other side, and that might lead to a down move.
Deeper analyses of the price action over the last few months on the daily chart show massive supply. Moreover, the price went below the selling zone (red rectangle) and returned to its bottom on a low decreasing volume, showing an absence of professional interest to participate in an up move.
So, to summarise it together:
As of now, this stock is weak . With a big probability, the price may fall to the bottom of the monthly sideways channel first and if no buying suddenly appears while the price breaks the $79.24 level, it could reach the $20.0-$30.0 area then.
If professionals buy around the channel bottom, the move-up will depend on the size of that buying, but will most probably push the price back to the monthly channel's top.

Strength on AMD stockAfter almost a year of down move, on February 5th 2025 a huge professional buying took place on Advanced Micro Devices Inc. stock (Ticker NASDAQ: AMD). Even though we've seen professional buying on that move before, the volume there was much lower and, as a result, caused small retracements up only. The volume on the February 5th daily bar has much bigger potential. Moreover, a few things are adding to the strength:
- Recent buying appeared on the market opening after the earnings report with an immediate price rise.
- The price returned into the area of big volume (blue rectangle) on relatively low volume, showing no professional interest in the downside (testing).
Therefore, if no supply reappears below or around the $116.37 level, we may see a rally towards $150.37 - $153.03 and even higher to $166.10 - $167.08 zone.
In case supply hits the market in the mentioned area, another professional buying could take place around $95.61.

Gold- Order Block Hunting! ICT and VSA Setup!As gold dropped today and sweep the order block near asian low there was also liquidity zone. and now gold bouncing from these level. gold can hit now 2899 and if gold breakout 2907 then we can see a new ATH on friday
Support: 2879-2876
Resistance Area: 2901
Liquidity Zone: 2899

Bullish behaviour on ADBE stockIt looks like, after half a year of retracement, Adobe Inc. stock (Ticker NASDAQ: ADBE) is now setting up for longs again.
On the gap-down daily bar following the December 11th 2024 earnings report, professionals bought. Then, over December and January 2025, more buying can be seen. It has to be noted that recent professional activity took place around the previous level of support ($433.97) which adds to the strength. By January 10th supply has been absorbed, in February the price pushed above the support level and has been tested with relatively low volume creating conditions for the move up.
Today's bar is a positive reaction to the recent testing and might be the beginning of the rally towards $566.79 - $576.30 with minor resistances around $482.66 - $489.52 and $541.74 on the way.
At the same time, as we've seen a high volume around the support level (January 27th, 28th and 31st bars), there is still the possibility of its re-testing and the beginning of the rally from there.

Snoflake [SNOW] Wyckoff Bullish PatternsVery fundamental company. The last consolidation after very large drops is a good prognosis for an upward exit. It is necessary to focus on Wyckoff Wave Volume, which decreases at the bottoms. This means a decrease in selling pressure. There were two shafts with a very large purchase volume and a wave marked with volume 200. It was a very large sale that did nothing to the price. This sale was absorbed by buyers.
This security has typical accumulation features. In my opinion, it is on BUY with a target of $ 140/150
For more analyses using price and volume and the Wyckoff method, subscribe to the profile


USD JPY Absorbtion Hello Everyone i just want to share my VSA (Volume Spread Analysis ) to you people so you can understand that how beautifully volume and spread works and as you can see I have shared D1 chart analysis Price has break the level with increasing volume which we called absorption and now we have to wait for the price to come at support with low volume and in the near of support make Test / Shake out sign of strength and after that we can enter in the market with long position up to the resistance level is marked.
have a nice weak ahead
Put your SL below the absorption bar when price will came to retest , so your SL will be smaller and reward will be higher.

WTF Is Happening To Ethereum?!After the Market Crashes in The Last Few Days, Following The Loss of Some Important Technical and Psychological Supports of Ethereum, This Cryptocurrency Lost a Much Larger Percentage Reduction in Price Compared to Bitcoin. Examining the Bitcoin-based Ethereum chart, Ethereum Has Been Able to Fill the Liquidity Void Left Over From the Past Uptrend During This Price Correction, and By Hitting Liquidity Areas in Several Times, Has the Potential to Reverse the Trend. It Should Be Noted that By Analyzing The Chart From a V.S.A Perspective, One Can See The Tangible Inflow of Smart Money. However, Given The Amount of Tick Volume and the Size of The Candle Wicks, It is not Out of The Question to Retest Supply at These Levels. If The Supply Test Is Successful, The Scenario Drawn in The Chart Will Be The Most Likely Scenario For ETH/BTC.

JICPT| ZM consolidates around 100 with possible reversalHello everyone. Last November, I posted an idea titled 'Don't rush to buy Zoom for the new wave of Covid' . I'm actually right, price has dropped by more than 60% since then.
Now, I observed a possible reversal pattern, with downtrend violation. Now, I need $94 to be served as a solid defense line, in addition, $128 is required to be firmly conquered. By then, I would be more interested in the long setup.
What do you think?

CHRUSDT possible scenarios Hello tradingview army, good morning, I hope all are doing good 😇
This is my price action analysis for CHRUSDT on daily time frame , I tried to explain everything on chart itself,
If you like the idea give thumbs up thank you !!

Shorting on USDJPYUSDJPY could be still going to down. There is some buying effort but fail on test the resistence area. Maybe the price still going to support line. Option to go short is good idea target is on support line.
