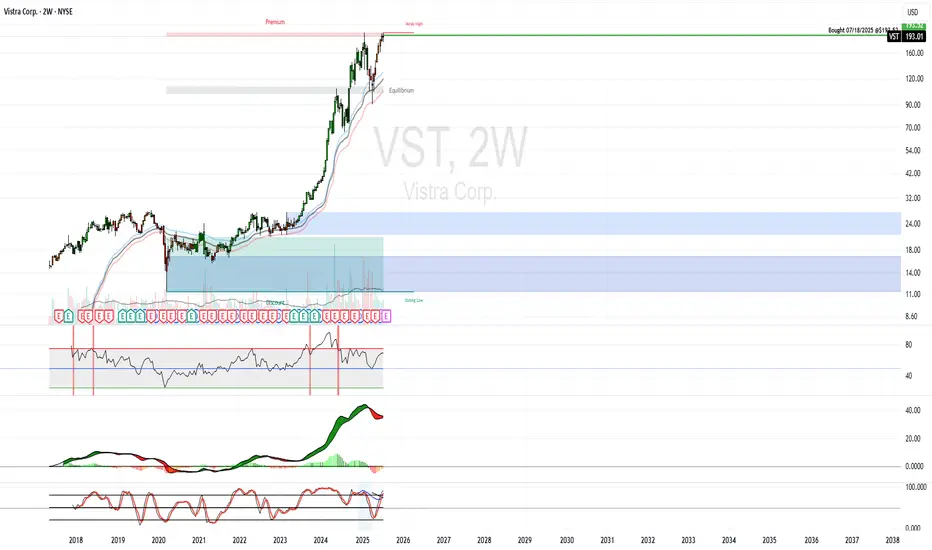
VST Purchase - Nuclear ThemeVistra Corp. (VST) – Cash Flow Machine
$4.09B TTM operating cash flow, highest among peers 2.
Strong nuclear and renewables mix, with AI data center exposure.
Thesis: Balanced growth and income play with upside from AI-driven demand.
Purchased CEG earlier. AI megatrend is tied to nuclear.
Not stoked about the purchase price, but long term growth should overcome any short term volatility. Also, not excited about the GreenBlue rank, we will see if it continues to improve.
Other Nuclear stocks on my radar:
VST
CEG
GEV
TLN
SMR
GreenBlue Rank: 1055 / 2500
GreenRed Rank: 143 / 3147
VST
VST Weekly Analysis Summary (2025-04-16)VST Weekly Analysis Summary (2025-04-16)
Below is a consolidated analysis synthesizing the key points from all the model reports:
──────────────────────────────
Comprehensive Summary of Each Model’s Key Points
• Grok/xAI Report
– Technicals on 5‑minute and daily charts show price holding above key EMAs with a bullish MACD and neutral‐to‐moderately overbought RSI.
– Bollinger analysis finds price near the upper band on M5, hinting at some short‑term resistance.
– News and falling VIX support a moderately bullish stance.
– From the options chain, the $120 call (Ask $0.82) stands out due to high liquidity (5,481 OI) and moderate distance from the current price.
• Claude/Anthropic Report
– Daily and intraday indicators (EMAs, RSI, and MACD) support short‑term bullish momentum with price positioned above key moving averages and support.
– Relatively high open interest in the $120 call reinforces trader interest despite max pain at $115.00.
– Despite some headwinds (high volatility from VIX), the recommended play is a moderately bullish call trade.
• Gemini/Google Report
– Confirms price action above major M5 EMAs and recovering daily charts reinforcing bullish momentum.
– Highlights that although max pain at $115.00 and heavy OI at $120 could introduce trade friction, short‑term momentum supports a call play.
– Recommends a naked call trade using the $120 strike—even if its premium ($0.82) sits slightly outside the “ideal” range—given the risk/reward balance.
• Llama/Meta Report
– Mixed signals emerge: the 5‑minute chart shows some overbought tendencies and a bullish MACD, while the daily MACD is less convincingly bullish.
– A bearish angle is noted (via max pain and alternative put analysis), yet this view is in the minority.
– Although it suggests a potential put play at $112, most models discount this given the broader bullish momentum indicated by technicals and sentiment.
• DeepSeek Report
– Emphasizes bullish technical momentum on both the daily and intraday charts (price above EMAs, bullish MACD, and neutral‑to‑positive RSI).
– Falls in line with the other bullish reports despite noting that max pain at $115.00 might pin prices.
– Also supports the liquid $120 call option based on a favorable risk/reward trade setup.
──────────────────────────────
2. Areas of Agreement and Disagreement Between Models
• Agreements:
– The majority of the reports note that the price remains above key short‑term moving averages and shows bullish MACD momentum.
– All models acknowledge the high open interest and liquidity in the $120 call options.
– There is consensus that the VST overall outlook is “moderately bullish” in the current weekly cycle, supported by positive news catalysts and a falling VIX.
• Disagreements:
– While four reports lean toward a bullish call play, one (Llama/Meta) introduces a contrarian view by suggesting a put option trade due to concerns about max pain and slight overbought conditions on the M5 graph.
– The divergence is mainly in risk appetite and emphasis on short‐term technical extremes versus broader bullish momentum signals.
– As a result, while one model weighs in on a bearish possibility via puts, the majority support a call-based strategy.
──────────────────────────────
3. Clear Conclusion
Overall Market Direction Consensus:
The aggregated signals point to a moderately bullish short‑term outlook for VST. Although max pain at $115.00 and high volatility temper the enthusiasm, the combination of price action above key EMAs, bullish MACD indications, positive news flow, and heavy call open interest overall favors a call trade.
Recommended Trade:
Based on the consensus, the recommendation is to BUY a single‑leg, naked call option.
Trade Parameters:
– Instrument: VST weekly options (Expiration: 2025‑04‑17)
– Strike: $120.00 call
– Option Premium at Entry: Approximately $0.82 per contract
– Trade Strategy: Long naked call
– Entry Timing: Enter at market open
– Profit Target: Approximately a 50% gain on the premium (target around $1.23 per contract)
– Stop-Loss: Roughly 20% below the entry premium (near $0.66 per contract)
Confidence Level in the Recommendation: ~70%
Key Risks and Considerations:
– The option premium is a bit higher than the ideal $0.30–$0.60 range, though justified by liquidity and risk/reward.
– High VIX levels imply elevated volatility; sudden reversals or wide swings can affect the trade.
– The max pain level at $115.00 could apply downward pressure, so an intraday loss cut is essential if price momentum stalls or reverses.
– Given the short lifespan (weekly expiry), theta decay is significant; close monitoring at open is critical.
──────────────────────────────
TRADE_DETAILS (JSON Format)
{
"instrument": "VST",
"direction": "call",
"strike": 120.00,
"expiry": "2025-04-17",
"confidence": 0.70,
"profit_target": 1.23,
"stop_loss": 0.66,
"size": 1,
"entry_price": 0.82,
"entry_timing": "open"
}

OptionsMastery: Looking at a H&S on VST! 🔉Sound on!🔉
📣Make sure to watch fullscreen!📣
Thank you as always for watching my videos. I hope that you learned something very educational! Please feel free to like, share, and comment on this post. Remember only risk what you are willing to lose. Trading is very risky but it can change your life!

H5 Trade of the Week! Nancy Pelosi SpecialTrade of the Week: NYSE:VST
Nancy Pelosi hype will return!
In this video, we cover:
🔍 In-Depth Trade Idea Breakdown
🎯 Precise Trade Execution
💰 Profit-Maximizing Tips
Don't miss out, friends! Watch now 👇
Not financial advice

Vistra Corporation (VST) AnalysisCompany Overview:
Vistra Corporation NYSE:VST is a prominent U.S. integrated power company, combining retail and wholesale energy services. The company is actively transitioning toward renewable energy while maintaining a balanced portfolio with its conventional energy assets. Vistra's commitment to sustainability is reflected in the recent development of solar projects, positioning it well for the future of energy.
Key Growth Drivers
Renewable Energy Expansion:
Large Solar Projects in Illinois: Vistra's recent connection of two significant solar projects underscores its push to diversify into clean energy. This not only aligns with consumer demand for green energy but also supports regulatory trends favoring sustainability.
Strategic Diversification: By enhancing its portfolio with renewables, Vistra is positioning itself as a leading player in the transition to cleaner energy sources.
Operational Adaptability with Conventional Assets:
Baldwin Power Plant Extension (1,185 MW): The extension of this key asset through 2027 allows Vistra to maintain reliable power generation in the MISO market while transitioning to renewables. The move exemplifies strategic balance, ensuring reliability while supporting green energy goals.
Operational Flexibility: Vistra's ability to adapt its mix of assets enables it to capitalize on diverse market conditions.
Leadership and Regulatory Expertise:
Rob Walters Appointment: The recent addition of Rob Walters as an independent director strengthens Vistra’s regulatory and strategic leadership. This move enhances the company’s ability to navigate the evolving energy landscape, building investor confidence in its long-term strategy.
Investment Thesis:
Vistra is well-positioned to capitalize on both renewable energy growth and conventional energy reliability. The company's expansion into solar power and commitment to sustainable energy solutions, combined with the extension of key assets like Baldwin Power Plant, reinforces its competitive edge in a transforming energy market.
Bullish Case:
Target Price Range: $210.00–$220.00
Entry Range: $140.00–$142.00
Upside Potential: Strong growth potential due to diversified energy portfolio, renewable energy investments, and strategic leadership appointments.

VST triangle breakout possible94 above resistance breakout possible
95/98/100/102 can test soon
close 21 ema above which is a bullish sign

VST Mean ReversionVST looks good for some mean reversion to the upside on lower time frames. Daily picture also looks to be setting up for continuation.

SELL VST STOCK$VST breakout of the ascending channel which has been holding for so long! New york open will be very volatile today but bearish in overall.

Prior accumulation with 3 points to resistanceVST popped up in TechniTrader scans today due to the rising volume and price pattern. Note the prior accumulation patterns. Resistance is strong at 27.25. Earnings on May 3rd.

4 hr. Low to High Fib starting in Sept 2021 (2.01.2022)BTC low to high fib mark up that is long term from one of the last lows in Sept 2021. This graph demonstrates how price passed the one fib markup and broke through.

VST - Broke Trend Resistance from Nov 2019 HighsNYSE:VST
Broke trend resistance from Nov 2019 high. Successfully tested new support. Approaching first resistance level (see chart).
MACD, RSI, & TTM Squeeze all look good.
Put/Call Ratio between .12 and .03 throughout the past 2 weeks. Currently at .03
Bullish Options Flow at $22 - 1/21/22 strikes.
Bullish Options Flow at $23 - 2/18/22 strikes.

BUY $VST - NRPicks April 04Vistra Energy emerged from the Energy Future Holdings bankruptcy as a stand-alone entity in 2016. Vistra is one of the largest power producers and retail energy providers in the U.S. It owns and operates 38 gigawatts of nuclear, coal, and natural gas generation in its wholesale generation segment after acquiring Dynegy in 2018. Its retail electricity segment serves 5 million customers in 20 states. Vistra's retail business serves almost one third of all Texas electricity consumers.
Market cap: 8.5 B
Rev: 11.44 B
Dvdn Yld: 3.39%
Operating Cash Flow (Proxy): 3.38 B
LT Debt: 9 B
Employments: 5K
ROE: 7%
P/S 0.76 vs 0.85 industry
P/E (TTM) 13.74 vs 226 Industry
Earnings and Revennue growth: 19.3% (Next 3 Years)
Fair value: $90 (80% undervalue)
Valuation: $27 (34% undervalue)


Waiting For Earnings On This One.Said sell 26, but I think it's worth the risk to hold for earnings. A lot of positive developments with this company.
A lot of typos in the first pick though lol. They don't let you edit. I didn't even look into the company that much, just saw the ownership, sector, and chart pattern, and plus they started paying a dividend. Looked like a sure thing

Fortress Investment Group Allocates 39.56% To Their HoldingsEntry 1/2 ****STOP 8%****
We routinely review hedge fund filings, and the trend is becoming clear: funds are bullish on oil. From Warburg Pincus, to Elliot Management, concentrated funds are betting big on the energy sector.
The reason why we chose this particular oil company was because of two reasons. First, and most importantly, the risk reward is extremely attractive right now because the price is coming off a key support level. Those supports were breached on two separate occasions, but, both times that happened was during a significant market correction. The second reason we like this stock is because of the extent to which Fortress is concentrated; 39.5%, a bold prediction.
Since the stock is ranging, $26.00 looks like a good area to consider taking profits. Entry 1/2, ****STOP 8%****
Good luck as always and happy trading everyone
**********WE ARE NOT FINANCIAL ADVISERS. THIS IS A HIGH RISK TRADE. CONSULT A FINANCIAL ADVISER BEFORE BUYING ANY PUBLICLY TRADED SECURITY. WE DO NOT OWN THIS STOCK, NOR DO WE INTEND TO BUY THIS STOCK IN THE NEAR FUTURE. WE ARE NOT BEING PAID TO WRITE THIS OR BEING COMPENSATED IN ANYWAY. YOU SHOULD NOT USE THIS INFORMATION AS INVESTMENT ADVISE. ALSO, BY READING THIS ARTICLE, YOU AGREE TO INDEMNIFY US OF ALL LIABILITY FOR ANY LOSSES INCURRED FROM USING OUR INFORMATION AS THE BASIS FOR AN INVESTMENT DECISION *****


Victory Square (CSE:VST OTC: VSQTF) Movement soonLikey drop to 1.6, and depending on news on the Feb 6th, will reverse, or tank.
