TOTAL CRYPTO TOTAL MARKET CAP ALMOST AT 1 TRILLIONCrypto's total market cap positions to break $ Trillion.
Altcoins are rising.
Looks like the start of profit-making, make sure to take profits before this Bull Run ends.
what are your thoughts?
Vtho


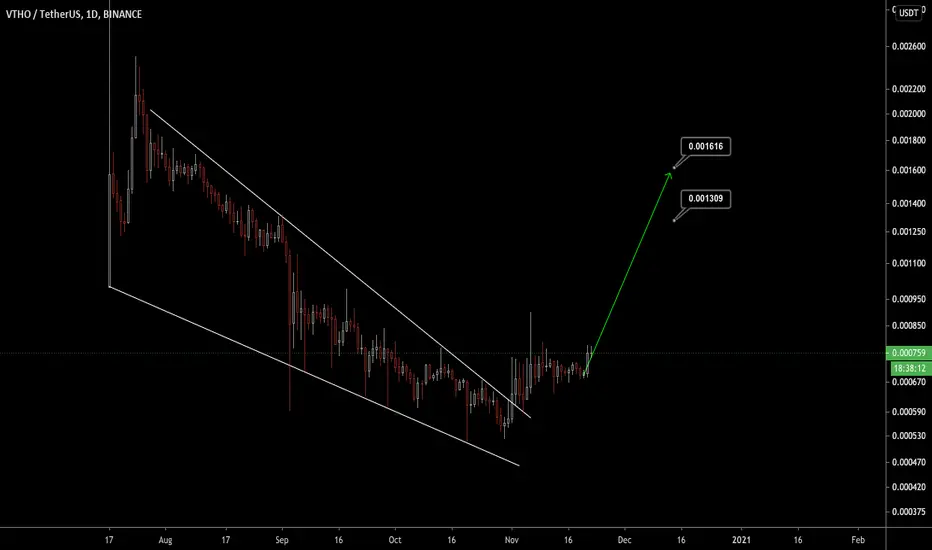
VTHO STEADY GROWTH? UPWARDS OF 40% GAINS INCOMINGBINANCE:VTHOUSDT
A few days ago we looked at VET's bullish indicators. VTHO is the gas of the VeChain ecosystem, so generally if VET sees major growth in price and volume VTHO follows.
Doing technical analysis on VTHO to confirm our beliefs, we see our EMA20 still trending above the EMA50. We just hit a very important point where price touched the EMA20 (first support). If we see a nice rebound and remain within the purple lines a nice bull run can be expected.
The awesome oscillator also confirms this trend with the lines steadying out and turning red, best case scenario would be the lines to go back green and continue rising along with price.
I try to point out these moves BEFORE they happen, not just post analysis on bull runs. Please understand this can still take a short turn down based on overall market sentiment, but most indicators point to be very bullish.
This is not financial advice! Please trade at your own risk.

Vechain is ready for a move higher!$VET
Confluent zone at around 100 sats. I expect a 30-40% move to the blue box. Falls between the daily 55ema and 200ema. Also is the bottom of the cloud. All indicators point to a retest of this level.

Vechain is ready for a MAJOR move!Elliot wave count is showing that the C wave is completing here at the 55 EMA. Assuming 1 cent holds, we should bounce. 50 MA is near 0.0085. Taking my chances here!

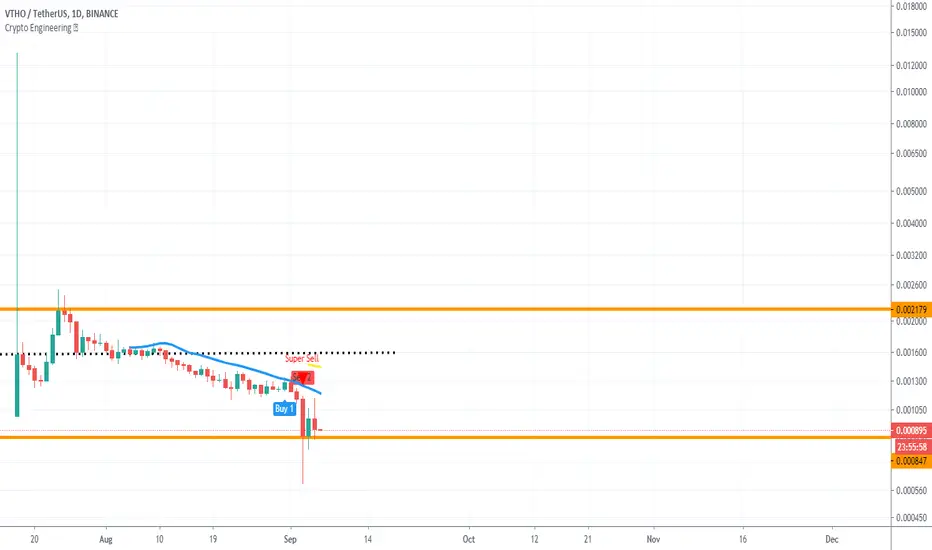
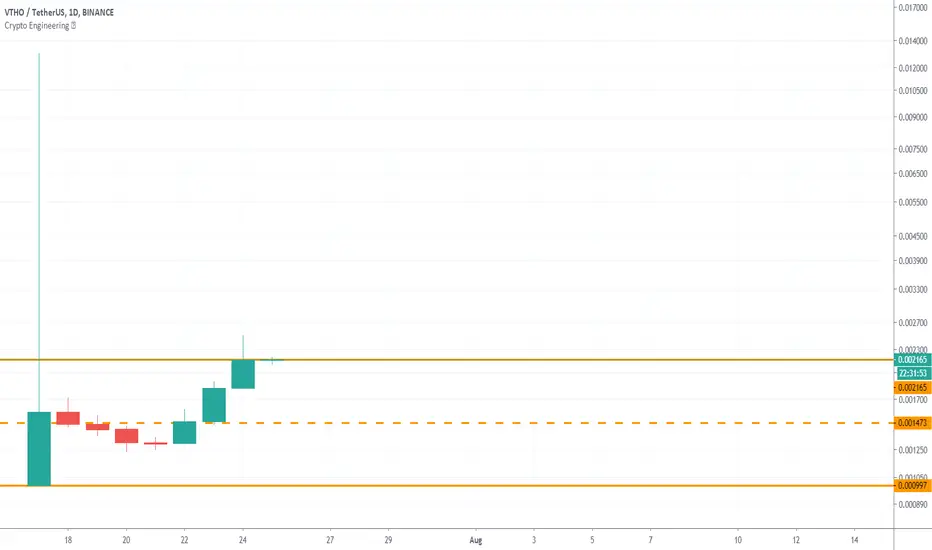
VTHOUSDT ANALYSISBuy this coin if one candle open close totally above the support line ( $ 0,000847)
Sell at the resistance line ( $ 0,0016) or sell with the EngineeringRobo ' s sell signal
Unfortunately EngineeringRobo gave Sell 1 & Sell 2, Bear, Hell and Sell 3 to Bitcoin, I am not strongly recommending to buy any altcoins at the moment
Have a good trade If you want to use EngineeringRobo please dm me.
Bullish MACD Divergence on the 4hr for VTHO?Looks like a trend reversal is underway?
Key Notes: A bullish MACD divergence occurs when the price action is moving downwards and the MACD is showing higher bottoms. In this case, the MACD indicator is giving us a strong bullish signal. Very often we will see price begin a strong upwards move after a bullish divergence with the MACD. Below you see an example of a Bullish MACD Divergence. After the occurrence of the divergence we see that the price starts an uptrend.
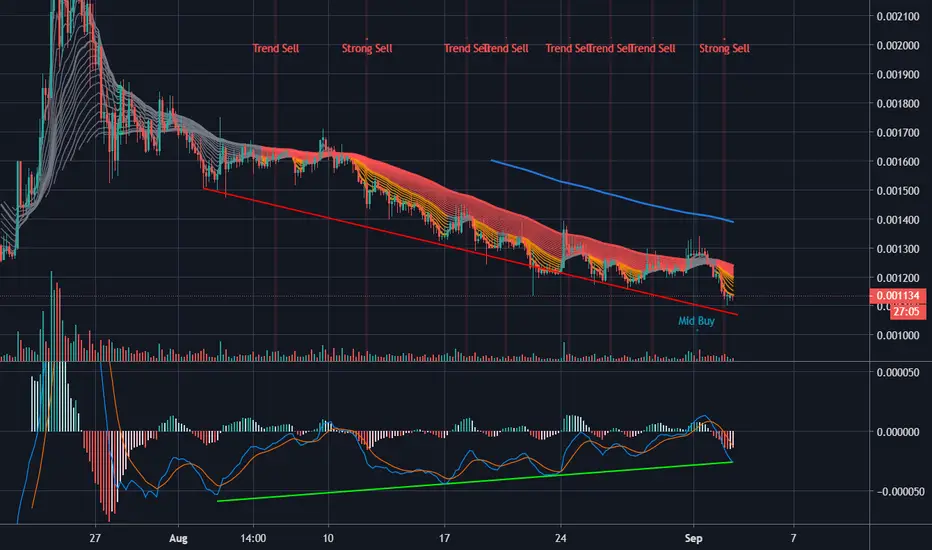


I would say we are breaking upwards here for VTHO...What say you? Symmetrical triangle break up for VTHO/USDT?

VTHOUSDT ANALYSISOnly nine days :)
Let's see what happens in the future.
However, If you are a daily trainer, 3H is maybe work :)
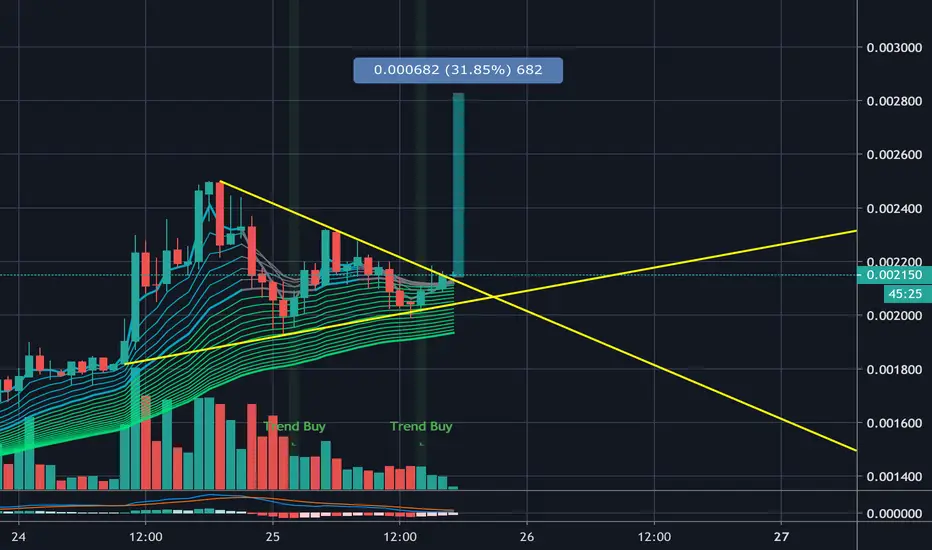
VTHO just flashed green on the hourly after listing on BinanceVTHO just flashed green on the hourly after listing on Binance, thoughts on the SUPER GUPPY?

Vechain: range low - range high is the play Simple range play on Vechain. Buy the range low, sell the range high until either breaks. If we fail to hold, we could be in trouble and possibly start dropping back near the lows.

