Master HBAR with Fibonacci: The Golden Pocket BlueprintSince topping out at $0.20151, HBAR has spent the last nine days in a corrective pullback. Digging into a rich confluence of supports that offers a long trade setup. Here’s how to spot the high‑probability entries, manage your risk, and scale out for maximum reward.
Current Context
Two days ago, price was firmly rejected at the weekly open ($0.19029) right alongside the anchored VWAP drawn from the $0.28781 swing high.
HBAR now trades below the monthly open ($0.18210), the weekly open ($0.19029), and the daily open ($0.18024), sitting at about $0.177.
Just beneath today’s level lies the swing low at $0.17543. Breaching this could flush out stops before any meaningful bounce.
The Golden Support Zone
All signals converge between $0.170 and $0.1725:
The anchored VWAP from the $0.12488 low sits at around $0.17.
The 0.618 fib retracement of the $0.15396→$0.20239 move falls at $0.17246. Just under the swing low where the liquidity lies.
The secondary 0.666 fib retracement lands at $0.17014, reinforcing that floor.
Volume‑profile analysis of the past 27 days pins its Point of Control right at $0.17, great confluence with the anchored VWAP.
This “golden pocket” is your pivot for a low‑risk, high‑probability long.
Long Trade Setup
Ladder buy orders between the swing low ($0.17543) and the 0.666 fib at $0.17014.
Aim to average in around $0.1725.
Place a single stop‑loss just below $0.17
Scaling Your Exits
First Partial Exit at the monthly open ($0.18210). This offers roughly a 2:1 R:R.
Second Exit Zone around the weekly open and VWAP resistance (~$0.19) for about a 3:1 R:R.
Final Target at the 0.618 fib retracement of the entire down‑wave (from $0.28781 to $0.12488) near $0.2256. An astounding 10:1 payoff for the patient trader.
Keep in mind a potential false‑break (SFP) at $0.17543: if price briefly dips below then snaps back up, with increased volume.
Short Trade Setup
For traders looking to play the downside from the “golden pocket” flip, here’s a clear short strategy:
Entry Zone: Ladder short entries between the 0.618 fib at $0.22557 and the 0.666 fib at $0.23339.
Confluence: The 0.666 level aligns perfectly with the negative 0.618 fib from the prior swing, creating a resistance zone.
Stop‑Loss: Place your stop just above $0.23339, invalidating the confluence.
Take‑Profit: Target a return to around $0.206, where you can lock in gains as HBAR retests its previous high.
By scaling into shorts across that fib band, you balance your risk and capture the high‑odds reversal offered by stacked Fibonacci confluence. Let the golden pocket guide both your longs and shorts!
Key Takeaways
Confluence is king: VWAPs, Fibonacci retracements, Liquidity and volume‑profile all align in the $0.170–$0.175 zone.
Risk control: One stop‑loss under $0.17 protects the entire laddered entry.
Tiered targets: Small wins at $0.182, larger as you clear $0.19, and a big payoff if HBAR rallies toward $0.225. Trail your SL accordingly.
Patience pays: Wait for price to enter the golden pocket, avoid chasing!
With these confluences lining up and clear levels to work from, HBAR’s next high‑probability long setup is staring you in the face. Trade smart, size appropriately, and let the market reward your discipline.
Happy Trading!
___________________________________
If you found this helpful, leave a like and comment below! Got requests for the next technical analysis? Let me know.
Vwapstrategy

Panic Selling LINK? Here’s Your Master PlanBuckle up! LINK has been riding a relentless bearish trend for 113 days, ever since it kissed its peak of $30.94 back in December 2024. With economic uncertainty casting a shadow over the markets and fear gripping investors, the big questions loom: Is this the dip to buy while others panic-sell? Or is it wiser to sit on the sidelines? Let’s slice through the noise, dissect LINK’s chart like a seasoned pro, and uncover the setups that could turn this chaos into opportunity. Let’s dive in!
The Big Picture: LINK’s Bearish Blueprint
LINK is currently trading at $13, a far cry from its yearly open of $20. April has kicked off, and LINK has already surrendered the monthly open at $13.5, a critical level now acting as a brick wall overhead. Zooming out, the trend is unmistakably bearish: lower highs and lower lows dominate the chart. Adding fuel to the fire, LINK is languishing below the Point of Control (POC) at $14.32, derived from a 1.5-year trading range. This is a market screaming caution for bulls and whispering opportunity for bears, at least for now.
But charts don’t lie, and they’re packed with clues. Let’s map out the key levels, pinpoint trade setups, and arm ourselves with a plan that’d make even the most seasoned traders nod in approval.
Resistance Zones: Where Bears Sharpen Their Claws
1.) Resistance - The Golden Pocket ($13.6 - $13.7)
Using the Fibonacci retracement tool on the latest downward wave, the golden pocket (0.618 - 0.65 Fib) aligns beautifully with the monthly open at $13.5. Oh wait there’s more, this zone overlaps with a Fair Value Gap (FVG), making it a magnet for price action.
Trade Setup (Short):
Entry: ~$13.5 (if price tests and rejects this zone).
Stop Loss (SL): Above the recent swing high at $14.4.
Take Profit (TP): First target at $11.85 (swing low), with a stretch goal at $11.
Risk-to-Reward (R:R): A solid 2:1.
The Play: If LINK crawls up to this resistance and gets smacked down, bears can pounce. Watch for rejection candles (e.g., shooting star, bearish engulfing) to confirm the move.
2. Key Resistance - Cloud Edge & VWAP ($15.74 - $16.5)
The Cloud edge of my indicator sits at $15.74, while the anchored VWAP (from the $26.4 high) hovers at $16.5. A break above $16.5 would flip the script, snapping the bearish structure and signaling a potential trend reversal.
Bullish Scenario: If bulls reclaim $16.5 as support, it’s a green light for a long trade. Until then, this is a fortress for bears to defend.
The Play: No bullish setups here yet.
Support Zones: Where Bulls Build Their Base
1.) Support - Swing Low ($11.85)
This is the first line in the sand for bulls. A potential Swing Failure Pattern (SFP), where price dips below $11.85, sweeps liquidity, and reverses—could spark a long trade.
The Play: Watch for a bullish reversal candle or volume spike here.
2.) Major Support Cluster - The Golden Zone ($10 - $11.85)
This is where the chart sings a symphony of confluence:
Swing Low: $11.85.
POC: $11.33 (1.5-year trading range).
Monthly Level: $11.02.
Fib Retracement: 0.886 at $10.69 and 0.786 (log scale) at $10.77.
Psychological Level: $10.
Trade Setup (Long):
Entry: Dollar-Cost Average (DCA) between $11.85 and $10.
Stop Loss (SL): Below $10
Take Profit (TP): First target: $13.5 (monthly open), stretch goal: $20 (yearly open).
Risk-to-Reward (R:R): A monstrous 6:1 or better, depending on your average entry. This is the kind of trade we are looking for!
The Play: Patience is key. Wait for confirmation—think bullish engulfing candles, a surge in volume, or positive order-flow momentum. This isn’t a “hope and pray” trade; it’s a calculated ambush on the bears.
Market Structure: Bears Rule, But Bulls Lurk
Right now, LINK’s chart is a bear’s playground—lower highs, lower lows, and no bullish momentum to speak of. The $16.5 VWAP is the line in the sand for a trend shift, but until then, short trades take priority. That said, the $10 - $11.85 support zone is a coiled spring for bulls. If fear drives LINK into this range, it’s time to load the boat with longs—provided confirmation aligns.
Your Trading Edge
LINK’s 113-day bearish descent is a wild ride, but it’s not random chaos—it’s a roadmap. Bears can feast on rejections at $13.5 - $13.7 with a tidy 2:1 R:R short. Bulls, meanwhile, should stalk the $10 - $11.85 zone for a high-probability long with a 6:1+ R:R payoff. Whether you’re scalping the dips or swinging for the fences, these levels give you the edge to trade with confidence.
So, what’s it gonna be? Short the resistance and ride the wave down? Or stack bids at support and catch the reversal of a lifetime? The chart’s laid bare—now it’s your move. Drop your thoughts below, and let’s conquer this market together!
If you found this helpful, leave a like and comment below! Got requests for the next technical analysis? Let me know, I’m here to break down the charts you want to see.
Happy trading =)

XRP - Choppy Market, Will We See $1.5 Again?After finishing the 5-wave structure in early 2025, XRP had a rough patch, trading between $3 and $2 and offering some pretty neat swing trade opportunities. Now, two months later, the big question is: will this range continue, or is a breakout on the horizon? Let’s break down the key levels and high-probability setups.
Short Trade Setup
Resistance Zone:
The weekly level and the 0.618 Fibonacci retracement are both around $2.5763 to $2.5792, aligning nicely with each other.
The anchored VWAP from the all-time high at $3.4 adds extra resistance at about $2.63.
Setup Details:
A low-risk short trade can be considered at the weekly level, with a stop-loss set above both the anchored VWAP and the swing high.
Target: The monthly open, aiming for an R:R of about 4:1.
Support Backup:
Additional support in this range comes from the 0.618 Fibonacci retracement (from a low at $1.9 to a high at $2.59), the weekly 21 SMA at $2.28, and a weekly level at $2.0942 just below the monthly open.
This support between the weekly level at $2.0942 and the monthly open is crucial for maintaining bullish momentum. If it holds, the bearish short setup stands; if it breaks, things could get tricky.
Long Trade Setup
When to Consider a Long:
If the support zone mentioned above fails, look for a long trade opportunity at the swing low around $1.77.
Support Confluence:
Primary Support: The swing low at $1.77, with lots of liquidity around that area.
Additional Layers:
The monthly level at $1.5988.
The weekly level at $1.5605 sits just below the monthly.
The 0.618 Fibonacci retracement from the 5-wave structure at $1.5351.
Anchored VWAP from the low at $0.3823, aligning with the weekly level.
And don’t forget the psychological level at $1.5.
Setup Details:
This long trade setup would offer an attractive R:R of roughly 6:1, targeting back to the monthly open for an approximate 33% gain, with a stop-loss placed below the $1.5 mark.
XRP's current trading range has provided some good short and long trade setups, a long opportunity at the swing low ($1.77-$1.5) could be the next big play. Whether you lean towards short or long, finding these confluence zones helps in making more informed, high-probability trade decisions.
If you found it helpful, please leave a like and a comment. Happy trading!

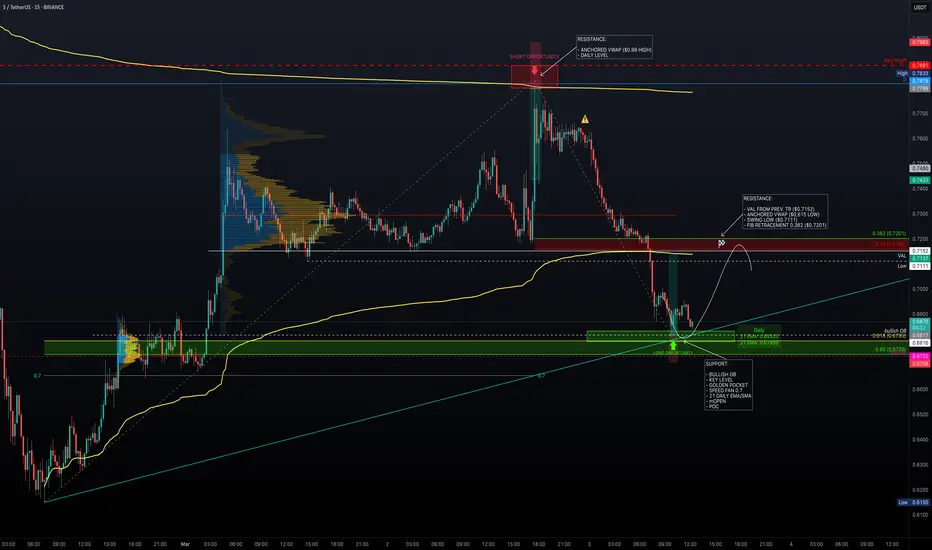
Major Levels – Is Sonic Ready to Pump?After reaching the daily resistance level ($0.7818), price faced strong rejection. The anchored VWAP, acting as dynamic resistance just below the daily level, provided additional confluence for a low-risk short opportunity.
Additionally, a key high at $0.7891 further reinforced this resistance zone. Following the rejection, price sharply declined -13%, retracing back into the previous trading range.
Support Confluence
Price is now approaching a well-defined support zone:
Bullish Order Block: $0.6816
Key Level Near Order Block: $0.6803
Golden Pocket (Fib 0.618 - 0.65): 0.618 at $0.6793 & 0.65 at $0.6739
Monthly Open: $0.6732
Point of Control (POC): $0.6732 (aligning with Monthly Open)
Daily 21 EMA/SMA: 21 EMA at $0.6835 & 21 SMA at $0.6790
Fib Speed Fan 0.7 (from $0.615 to $0.7818): Providing additional support in this zone
Long Trade Setup
Entry Zone: $0.6816 – $0.6732
Stop Loss: Below the Monthly Open ($0.6732)
Take Profit Zone: $0.7111 – $0.7201
Risk-to-Reward (R:R): 3:1 R:R setup, offering a high-probability trade
Take Profit Targets & Resistance Zones
Previous Swing Low: $0.7111 (untested)
Value Area Low (VAL): $0.7152
Anchored VWAP (from $0.615 low): $0.7137
Fib Retracement 0.382 (from $0.7818 high to current low): $0.7201
DEEP - Finding The Next Trade SetupDEEP recently took out the January 13, 2025 low at $0.12345 with a Swing Failure Pattern (SFP), followed by a successful retest. This led to a bounce that hit a key level at $0.12141, presenting a solid long opportunity with minimal risk.
After this, the market turned bullish, forming a 5-wave structure and rallying to the 0.786 Fibonacci retracement level at $0.18643 (measured from the $0.20473 high to the $0.11922 low). This was a key take-profit zone for longs and a great short opportunity.
Adding confluence, the anchored VWAP also acted as resistance just above at $0.19, offering another low-risk short setup. Additionally, a key resistance level at $0.1809 further reinforced the rejection zone.
Current Price Action & Short Setup
From the 0.786 Fib retracement, DEEP retraced 20% downward, nearly touching the 0.618 retracement of the 5-wave structure before bouncing. Now, price is finding resistance at the golden pocket (0.618 at $0.17347 and 0.666 at $0.17534) of the recent drop, aligning perfectly with the daily 21 EMA ($0.1757) and daily SMA ($0.17347).
This setup suggests an ABC corrective move is forming.
Using the trend-based Fibonacci extension, the 0.786 extension aligns with the 0.618 retracement at $0.1457, creating a strong short setup.
Short Entry: Between $0.17347 - $0.17534
Target: $0.1457 (0.786 trend-based Fib extension / 0.618 retracement)
Stop Loss: $0.1845
Risk/Reward: 2.5:1
There’s also potential to extend the target to the 1:1 trend-based Fib extension at $0.13733, but this would depend on price action.
Potential Long Setup
If price reaches the $0.1457 support zone, this could present a high-probability long opportunity.
Entry: Around $0.1457
Risk/Reward: 2:1 or better, but confirmation is needed before executing the trade

XAUMO Strategy: Institutional-Grade XAU/USD Trading FrameworkThe XAUMO Strategy is a comprehensive institutional-level trading framework designed for precision, adaptability, and profitability when trading XAU/USD. This strategy incorporates Fixed Range Volume Profile (FRVP), VWAP bands, POC, Value Areas, and Market Maker Logic to anticipate price movements with surgical precision.
Core Elements of the XAUMO Strategy
Key Levels (Dynamic Zones):
1. POC (Point of Control):
• Primary POC: $2,685.
• Secondary POC: $2,700.
• Acts as a magnet, offering breakout and retest opportunities.
2. Value Area Levels (VAH & VAL):
• VAH (Value Area High): $2,695 – Resistance Zone.
• VAL (Value Area Low): $2,675 – Support Zone.
3. VWAP Bands (Monthly Anchored):
• Lower Band: $2,670 – Buy Zone.
• Upper Band: $2,705 – Sell Zone.
4. Fair Value Gaps (FVG):
• Untested FVG: $2,675–$2,680.
• These gaps provide reversal or breakout opportunities.
XAUMO Trade Setups
Trade 1: Long from $2,680 (VAL & Lower VWAP Band)
Trigger:
• Price interacted with VAL, lower VWAP band, and untested FVG ($2,675–$2,680).
• RSI divergence confirmed a bullish reversal.
Execution:
• Entry: Buy at $2,680.
• Stop Loss: $2,670 (below VAL).
• Take Profit Levels:
• TP1: $2,690 (POC).
• TP2: $2,695 (VAH).
• TP3: $2,705 (Upper VWAP Band).
Trade Management:
• Scale out at each target:
• TP1: Close 40%.
• TP2: Close 30%.
• TP3: Hold 30% with a trailing stop.
Trade 2: Short from $2,705 (VAH & Upper VWAP Band)
Trigger:
• Price rejection observed at $2,705 (Upper VWAP band).
• Bearish divergence on RSI and liquidity sweep confirmed a reversal setup.
Execution:
• Entry: Sell at $2,705.
• Stop Loss: $2,710 (above resistance).
• Take Profit Levels:
• TP1: $2,695 (VAH).
• TP2: $2,690 (POC).
Trade Management:
• TP1: Close 50%.
• TP2: Close remaining 50%.
• Adjust SL to breakeven after TP1 is hit.
Scenarios for XAUMO
1. If Price Breaks Above $2,705:
• Enter a breakout long trade.
• TP1: $2,710 (short-term extension).
• TP2: $2,715 (macro extension).
2. If Price Breaks Below $2,675:
• Enter a breakout short trade.
• TP1: $2,670.
• TP2: $2,660 (macro target).
3. If Price Stalls at POC ($2,690):
• Tighten stop loss or scale out to lock in profits.
Confluence and Key Observations
1. POC and Volume Levels:
• Both $2,685 and $2,700 POCs have shown strong respect from price action in prior trades.
2. VWAP Bands:
• The lower band ($2,670) aligned with support (VAL) and FVG, confirming strong buy opportunities.
• The upper band ($2,705) coincided with resistance and liquidity traps.
3. RSI Divergences:
• Bullish divergence near $2,675 and bearish divergence near $2,705 validated turning points.
How to Use This on TradingView
1. Add Indicators:
• Use Fixed Range Volume Profile (FRVP) from the swing low ($2,670) to swing high ($2,700).
• Anchor VWAP bands to the monthly chart for dynamic support/resistance levels.
• Overlay RSI and MACD for momentum confirmation.
2. Chart Setup:
• Draw the ascending parallel channel on the 30M chart:
• Support: $2,680.
• Resistance: $2,695–$2,705.
3. Entry Markers:
• Highlight buy zones at $2,680 (VAL) and sell zones at $2,705 (VAH).
4. Targets and Stops:
• Use dynamic TP/SL levels from VWAP, POC, and FRVP zones.
Visualize the Idea
• Bullish Setup: Enter long at $2,680 with targets at POC and VWAP upper band.
• Bearish Setup: Enter short at $2,705 with targets at VAH and POC.
This strategy ensures that you are trading like an institutional player, targeting high-probability zones while managing risk dynamically.
Let me know your thoughts or drop a like if you’re ready to master XAU/USD trading with the XAUMO Strategy! 🦈

Trading Idea of week 35 - S&P500 - TradingMasteryHubWelcome to the TradingMasteryHub Trading Ideas!
Are you ready to gear up for the upcoming week? Join us as we dive into a detailed analysis to uncover top trading opportunities that could potentially boost your trading account. We’ll break down our strategy, defining precise Entries, managing Risk, and pinpointing the optimal Exit zones—steps that can transform your trading performance. Whether you’re just starting out or looking to fine-tune your approach, these insights are crafted to help you on your path to mastering the markets.
S&P 500 Poised to Break New All-Time Highs!
The S&P 500 has climbed back above its long-term uptrend (green trend line) that’s been in play since early November 2023. The current all-time high (ATH) of 5,680.4, set on July 16th, also marked the beginning of a mid-term downtrend (red trend line). However, two weeks ago, we witnessed a significant breakout from this downtrend, accompanied by high volume, which also reestablished the long-term uptrend. The last four trading days have been range-bound between key support (green) and resistance (blue) zones, with a stable volume profile (orange box) in between.
If the price manages to break through the key resistance zone (blue), new ATHs are highly likely. This presents a clear and compelling trading opportunity that we’re excited to share with you.
How to Turn This into a 5-Star Setup!
Before we rush into a trade, excited by the prospect of bullish momentum, it’s crucial to do our homework. This means waiting for multiple confirmations before entering the trade:
1. The Trend is Your Friend: The chart shows different trends depending on the time frame. We’re trading on a 15-minute chart, where the uptrend is clear. But we also need to confirm that the higher time frame (above our execution trend) is in an uptrend and not in a consolidation phase following a longer-term downtrend.
- Box Checked: We saw a breakout from the mid-term downtrend on August 15th with high volume (RVOL > 3) and a 15-minute close above the last higher low of that downtrend on August 19th, also with high volume.
2. We Need New Bullish Momentum: To hit new ATHs, we require strong buying pressure. This could come from a catalyst like favorable news (e.g., interest rate cuts by the Fed) or a technical breakout above the key resistance zone (blue).
- Box Checked: We’ll look for a 15-minute close above the blue zone, RVOL > 3 at the breakout, and ideally, a U.S. market opening above the previous day’s Volume Profile high to confirm a trending day.
- Plus: Price must be above both the session VWAP and 2-day VWAP.
- Bonus: An additional catalyst in the form of a market-moving news event.
3. We Need Patience: Only when all the above criteria are met should we enter the trade.
- Entry: After a 15-minute candle closes above the blue zone, but only if the risk/reward ratio is >1.3 up to Target 1.
- Risk Management: Stop Loss (SL) at 5,624.7, just below Friday’s Pivot R1 minus 6 points for market noise. Take Profit (TP) Target 1 is set at 5,678, just below Pivot R2 (also the 1.618 Fib Extension), where we’ll scale out 50% of the position and move the SL to the entry level, making the trade risk-free.
- Profit Target 2 (50%): This will likely be around 5,730, just below the 2.618 Fib Extension. If we don’t see new ATHs, TP Target 2 will be triggered by a close below the highest green 15-minute candle.
4. We Need Discipline: Trading only when all conditions are met will give us an edge in the long run.
- Discipline: Sticking to your rules is crucial for consistent trading. Without discipline, you lose the ability to analyze and refine your edge, leaving you at the mercy of emotional decisions.
5. We Need to Review Our Trades: Keeping a Trading Journal is essential for learning from both mistakes and successes. We’ll provide another e-Learning session focused on this vital topic. A simple journal can significantly improve your trading.
Always Have a Plan B!
Sometimes Plan A doesn’t play out. That’s why it’s important to have a Plan B—a slightly less optimal, but still viable, 4-star setup.
In this case, if the breakout above the blue zone doesn’t occur and the market reverses towards the green zone, we might consider a short trade instead. But again, we need a separate checklist:
1. Range Trades Need a History: The market must test key zones (green and blue) more than twice each to confirm a range.
- Confirmation: More than two touches of the green and red zones have already occurred.
2. We Need Bearish Momentum: A bearish environment is necessary for a return to the range. This could be triggered by a negative catalyst (e.g., lower unemployment rates) or a breakdown below VWAP.
- Box Checked: We need a 15-minute candle close below both session VWAP and 2-day VWAP, RVOL > 3, and the market ranging within the Volume Profile.
3. We Need Patience: Enter the trade only when all conditions are met.
- Entry: After a 15-minute candle closes below both VWAPs, with a risk/reward ratio >1.7 up to TP Target 1.
- Risk Management: SL at 5,647, just above Friday’s Pivot R1 plus 6 points for noise. TP Target 1 at 5,602, just above Pivot P (0.382 Fib retracement), where we’ll close 100% of the position.
4. We Need Discipline: As always, sticking to the plan is key.
5. We Need to Review Our Trades: Keeping track of your trades ensures you learn and improve over time.
---
Conclusion and Recommendation
By focusing on clear trends, momentum, and discipline, you can capitalize on high-probability trading setups like the ones we’ve outlined here. However, it's crucial to understand that not every 5-star setup will be a winner. Even the most promising setups don’t guarantee success every time. The true key to long-term profitability lies in consistently following a well-defined strategy and maintaining a favorable risk/reward ratio. Over time, this disciplined approach can lead to steady profits, helping you grow your trading account while minimizing losses.
Having a solid Plan B also keeps you prepared for whatever the market throws your way. With these strategies, you’re not just following the market—you’re mastering it.
Can’t Get Enough? Don’t Miss Out!
Subscribe to stay updated on all our latest trading ideas and strategies. Share your thoughts in the comments, and let’s build a community of traders who are committed to learning, growing, and succeeding together. Your journey to market mastery is just beginning, and we’re here to guide you every step of the way!
What You’ll Learn:
- In-depth market analysis
- Proven trading setups
- Effective risk management techniques
- The importance of discipline in trading
- How to adapt to changing market conditions
- And much more!...
Best wishes,
TradingMasteryHub

QQQ rangbound bearish bias SHORTQQQ on the daily chart hit a hpivot high on 3/21 followed by a slight downtrend of 1-1.5 %
overall this past week. Buying volumes are low. The Price Momentum Oscillator has
reversed to bearish and the Raltive Trend Index has entered the chop zone and is heading
bearish. Price is presently one standard deviation above the intermediate-term anchored
VWAP. Reversion to the mean suggests another 1% move downside before VWAP support
exerts itself. Price is compressing in a symmetrical triangle. Accordingly, I am expecting
a move down before a potential reversal in a VWAP bounce from that support.

ESPR a penny and medtech stock LONGESPR on the 120-minute chart is surging with momentum from an FDA approval for a new
cholestrol and lipid medication which will be an alternative to the at statin class which has
side effects and can cause diabetes. I am familar with a few of the professionals on the
science advisory board they are researchers and academics of the highest claiber. The chart
shows price testing and getting support from the mean VWAP and a little bit of resistance
from the first upper VWAP line. I have added to my existing position at the consolidation at
VWAP. I am well informed on ESPR market prospects; this could be disruptive.
The dual time frame RSI of Chris Moody has curled up and validates the idea. My interim
target is the double top of this past winter. I do expect increasing volume in time with the
price action that follows.
Disclaimer This a hot penny stock highly volatile - you could lose on this trade. Do not trade
with money you cannot afford to lose. You must manage the trade well to realize profit.
There are options if the put to call ratio is rising big money is pushing a reversal

Positive Earnings Gaps Seldom Fill: NFLXTo follow up on my analysis of NFLX from Wednesday ...
Despite the market moodiness and selling, NASDAQ:NFLX reported well above estimates.
HFTs triggered a huge gap up on heavy pre-open order flow yesterday. Volume was also huge, so smaller funds' VWAPs triggered and retail traders chased the stock while Pro Traders and HFTs made some big profits.
Gaps up on positive earnings seldom fill completely. There is a strong support level at $350 which the gap up now confirms.

How to Profit from Trend Exhaustion - XAGUSDHow much ... and when? What else is there to know? Enjoy this multi-timeframe tour of the XAGUSD chart to learn how I find MAJOR reversals and targets BEFORE price action reaches them. As always, I strive to produce charts that speak for themselves, and yet this is my video debut here on Tradingview, and I could not be more pleased to narrate this unusual experience. If you enjoy it or, better yet, if you learn from it, then consider this a preview of forthcoming weekday morning livestreams, which I hope you will follow. Until then, be liquid!

"A Dangerous Tool" - Palantir Rally Ends w/ 6.66:1 Short A detailed look at the weekly price action history of PLTR indicates that the recent rally has come to end ... but I've been wrong before, so I welcome your tough questions and chart-based counterarguments. The strongest confluence supporting my conclusion is the simultaneous retest of the Euler Trend Exhaustion Limit and the 2nd Standard Deviation of the VWAP anchored at the Swing Low.
As always, I strive to render these ideas of mine so obviously that their explanation will require no words, and this forecast is no exception. My trading tactics - including the beauty of Tradingview and how it makes me look good - are based on identifying the opportunities within VOLUME, VOLATILITY and TREND EXHAUSTION.
In this case, it is the last of those, TREND EXHAUSTION, and specifically the use of Euler's number as a ratio in the Pitchfork to estimate the major inflection points in advance, that makes this chart unusual, and explains why it must be viewed in the weekly timeframe. This technique has appeared before (Bluzelle, for example) and will appear again in my ideas and videos.
Notice how price interacted with the Limit before, when it passed thru it for the first time in August of 2022 ...
The Short position is placed in the future, as I expect price to range and even retest the aforementioned AVWAP one last time before falling into the trade. If you zoom in carefully, you will notice that the Stop Loss and Profit targets are discretionary and based on dynamic levels within the AVWAP Array.
The Risk:Reward ratio is arbitrary, and 6.66 is merely a measure of my esteem for this beastly "business" and the product that it sells. As Gandalf said, "If all the Seven Stones were laid out before me now, I should shut my eyes and put my hands in my pockets."
The overlapping S-Curves indicate a price squeeze followed by a breakout, which I anticipate will be upward. If price rise to the highest potential shown, that would only improve the Short entry as opposed to negating my opinion, which is, of course, subjective.
The fact that this company and others like it (BAH, for example) are so enthusiastically traded by a sheltered public foretells of a troubled future, which I look forward to discussing in forthcoming livestreams. Again, I welcome your best questions.
Until then, be liquid !!!
. . .
movie-sounds.org

Review and Plan for 1st SeptemberNifty future and banknifty future analysis and intraday plan in kannada.
This video is for information/education purpose only. you are 100% responsible for any actions you take by reading/viewing this post.
please consult your financial advisor before taking any action.
----Vinaykumar hiremath, CMT

VWAP explanation, description and usage examples.Hello Traders:)
Enjoy this small tutorial about VWAP
1. Definition:
VWAP is a popular technical indicator used in trading to assess the average price at which a security has traded throughout the required time range, weighted by the volume of each trade. It provides a reference point for traders to evaluate whether they are buying or selling at a favorable price relative to the average market price.
2. Using VWAP:
- Trading Decisions: Traders use VWAP as a benchmark to make informed trading decisions. They may aim to buy when the current price is below VWAP, indicating a potential value opportunity, and sell when the price is above VWAP, suggesting potential overvaluation.
- Order Execution: VWAP can help traders with large orders execute trades efficiently. By splitting the order into smaller portions and executing them at intervals close to the VWAP, traders can minimize market impact and obtain more favorable prices.
- Identifying Trend Strength: VWAP can be used in combination with other technical indicators to assess the strength of price trends. When the price consistently stays above VWAP and VWAP slopes upward, it suggests a strong bullish trend, and vice versa for a bearish trend.
3. Different Types of VWAP and their purpose:
- Intraday VWAP: This calculates the VWAP over a single trading session, typically from market open to close.
- Rolling VWAP: It calculates the VWAP over a specified rolling time period, such as the past 20 days, providing a longer-term average.
- Volume Profile VWAP: It calculates the VWAP for specific price levels within a range, giving insights into the distribution of volume at different price levels.
- Additional option available on TradingView: Fixed Range Volume Profile. We can set the VWAP from literally any time and select only part of the intraday session. Useful, for example, to track your VWAP trade from the start of our trade. This allows us to determine the strength of the trend during our open trade.
4. Settings for Different Purposes:
- Timeframe: Traders can choose different timeframes for VWAP calculations based on their trading strategies. Shorter timeframes (e.g., 5-minute or 15-minute) provide a more granular view of intraday trading, while longer timeframes (e.g., 1-hour or daily) capture broader trends.
- Volume Weighting: Traders may consider using different volume types, such as total volume, buy volume, or sell volume, depending on their specific objectives and the information they want to incorporate into the VWAP calculation.
5. Visual Possibilities:
VWAP can be plotted on trading platforms as a line or a ribbon overlaying the price chart. It is often displayed alongside other indicators, such as moving averages or Bollinger Bands, to provide additional context and facilitate analysis.
6. Additional Ranges of VWAP:
- Standard Deviation Bands: Traders may add standard deviation bands around the VWAP line to identify potential overbought or oversold conditions. These bands help highlight when the price is deviating significantly from the average and can signal potential reversals or mean reversion.
- Multiple Timeframe VWAP: Traders may plot VWAP calculations for different timeframes on the same chart to gain insights into intraday and longer-term trends simultaneously. This allows for a comprehensive view of price dynamics across different time horizons.
Remember to adjust the settings and interpret VWAP in the context of specific trading strategies, market conditions, and the characteristics of the securities being traded. Additionally, it's recommended to backtest and validate any trading strategy before applying it in live trading.
If you enjoy this tutorial please follow for more content and live trading:)
At the end example of how I am using VWAP with Heikin Ashi on BTC:

DAX Monday SHORT setup. 200 points range. Market Profile/ VWAP
Hello Traders:)
I expect a morning rebound after the market opens to the red line levels. Hence, I will look for an opening of shorts with targets marked with green lines. The first level of short is the upper limit of the market profile for both Thursday and Friday. This level has been tested many times. The second level of potential short play is the upper limit of the weekly VWAP, which was tested on Thursday with a dynamic decline. Take profit first is the middle level of Thursday's Market Profile, while my second target is the bottom level of Thursday's Market Profile. I am planning to enter a small position at level 1, with a stop loss above the 2nd target. The rest of the items I include only after testing the second level. Depending on the situation, I can exit 50% after reaching target 1, or hold 100% of the position until target 2. The planned range of a potential trade - 200 points.
I wish you all a great trading week!

NIKE: A POST EARNINGS PLAYNike reported earnings on the 20th after the market close. The stock increased by more than 12% the following day.
The price of the stock revisited the resistance level that was rejected in June and August of 2022. Before the rejections, this level acted as a support as seen in March and April of 2022. In this chart, the support/resistance zone is marked by the yellow box.
Additionally, this zone currently coincides with a VWAP anchored back to November of 2021. We observed that the price action rejected at both the anchored VWAP and the yellow box zone of resistance on December 21st of 2022. If price revisits this level, look for price action consistent with what we have observed in the previous rejections.

How to Short TSLA with a the SV-X strategy CONSISTENT , SIMPLE & CLEAR
THE SV-X & LV-X strategies.
This is a very well known pattern among HRTs. High resource traders. basically, the few 10%. The highly leveraged traders, utilize this strategy very often.
- You can trade this with any account , so as long as it covers the cost to trade.
- You will find these patterns occur between 2 - 3 x per week, that's 8 - 12 times per month.
- If you have an account size of $25k USD or more , our experience has shown a monthly gross income of or about $7,436/mo or $89,232/Year trading just these 2 setups SV-X & SV-LONG .
Short strategy = SV-X , S.V. stands for SHORT THE VWAP.
Long strategy = LX-X , Long the vwap. simple.
THIS EXAMPLE : Short on $TSLA ( Details can be explained )
Begin to pay more attention just after 9:45 am ET.
Just around/after this time, the price action will decide the move for the day.
TRADE MGT :
- Stop loss must be pre-determined before 9:30am ET ( we provide a reliable SL )
- Entry = $ 157.58 - I call this Backside entry*
- Exit = $ 151.15 - I call this a clear exit.
1. Watch closely to see price action confirm to you that p/a is headed south and NOT a fake-out to the NORTH.
Your
2. Learn about my method in risk mgt.
3. The stop loss is key. That zone will determine whether you make money , lose money. get faked , & more!
4. Your entry is an agreement , between your logic to GO and the reality of NO GO.
5. Think like an Ai machine learning trader .
6. You must agree with your logics' reasoning as well as your personal experimental knowledge.
7. Do all of this FAST! like 1.1 sec FAST. Real FAST.
8. Trade with a plan. Plan your trades.
#ProfitsPlanned
NASDAQ:TSLA

Circular Decomposition of Harmonic Pattern & 3:1 Long of CD LegThe long position in XRP is merely incidental. The emphasis is on using clean line work to discover areas where price is more likely to reverse.
In this example, which includes a bearish harmonic pattern , decreasing volatility is visible to the naked eye, even without the compression of the MA ribbon or the decreasing ATR.
Some unusual arrangement of pitchforks suggests that a lower time frame trend is breaking out and may retest diagonal support. If this occurs, a long entry presents itself, which would complete the CD Leg of the pattern and set up a Short at the D point.
Trading the CD Leg is NOT recommended because it often fails the test that comes at this level; the pattern is NOT considered confirmed until reaching point D. The incidental long shown here AWAITS the resolution of the test, as suggested by the S-Curve.
Fibonacci ratios are used not only to establish a potential action space for longer range forecasts but also to measure a profit target at point D, on the 1h chart. Although less obvious, but they are used also to estimate Trend Exhaustion (diagonals) and, hence, time.
In addition to more common elements of a Volume Spread Analysis, a series of overlapping VWAPs interacts with the action space implied by the Fibonacci ratios to reveal what might be described as the "grain" in the price history. Of especial importance is how certain VWAPs anchored to real-world events (as opposed to swing highs and lows, or opening bells) predict otherwise invisible volatility when either price or other VWAPs cross them.

ETCUSDT (2H) VWAP StrategyThe information contained herein has been prepared for general information purposes only. The comments and recommendations contained herein are based on the personal opinions of commenters and recommenders. It should not be interpreted as a buy-sell recommendation or a promise of return on any investment instrument. These views may not be suitable for your financial situation and risk and return preferences. Therefore, making an investment decision based solely on the information contained herein may not yield results that meet your expectations.
