The Wall StreetFriday, 4 November 2022
15:44 PM (WIB)
Bulls Market has losses of around 3.22% on date 3 November 2022, late midnight at 00:00 AM (WIB). The times of trading could not be underestimated and floating in trading transactions again. What times in Europe and New York while in Asia at late midnight? The funds could be destroyed immediately if forget to set Stop Loss or even get worse to trade in big amounts.
The big players seem trying to seek and destroy the stop loss trail, as seen on the chart on 3 November, at 00:00 AM late midnight. Supposed to be traded in a safety zone and at time of office hours, Not at after hours or late midnight.
Back to the bulls, losing about 3.22% because of the Double Top Formation, will lead the bulls back to the top and get even.
From the top of resistance of the double top, there will be a stronger bear market that will move the price down to the target direction of around 50% to 61.8% F.
Wallstreet

HON Daily Technical AnalysisA SHORT Position
Support Price: 204,26 - 206,40 - 207,84
Resistance Price:200,50 - 193,67 - 184,36 - 179,77
Daily and Hourly indicators NEGATIVE. With market stuation price can DOWN. All Market index looking like will go DOWN. So HON can be good for short position.
Its i my mind. it is not a investment mind

¡¡Waiting for a number!!Hello trading community! We see on the US500 chart that the price faces significant resistance in the area between 4000 and 4100. On the daily chart, the US500 is in a descending channel. A continuation of the dollar's bullishness and no rate cut at its next meeting could wipe out investor bullishness and leave the index looking for new lows and support between the 3300-3500 level. Conversely, the other side of the coin prompts us to believe that a softer Fed policy will drive a sudden uptick in expectations for a positive end to the final quarter of the year. On the other hand, the market is pricing in a 75bps rate hike from the Fed and a 50bps cut in December (bullish outlook). Don't forget we have the Bank of England meeting on Thursday, the same outcome is expected (bullish outlook). The DXY is down 80% from the 111.60 level, but we do not rule out buyers entering the 112.4 technical level in the Fed preview. A level at which index bears can be activated against a bullish panorama of the market.

US30 31st OCTOBER 2022Concerns about recession resurfaced among investors as the Fed continued to follow a hawkish path lined with interest rate hikes.
This led some companies in the US to change their earnings projections again, with several companies and analysts revising their outlook downward for the coming quarter.
The market also expects the Fed to raise its benchmark interest rate again at its November meeting.
According to FedWatch, 96.7% of market participants project that the Fed will raise its benchmark interest rate by 75 bp and bring the Fed funds rate to a range of 3.75%-4%.
Wall Street still tends to weaken despite the positive sentiment from the release of the financial performance of issuers in the US.

$BTC Wall Street Cheat Sheet$BTC breaking away from anger for a small bear market rally. Could end anywhere between 25-30k. Breaking back and holding above 32k~ would be similar to breaking back 6k in 2019. Holding above 20.400$ on the daily is essential.

S&P 500 Daily Chart Analysis For Week of October 28, 2022Technical Analysis and Outlook
The upside target marked at 3875 has been completed. Mean Res 3955 and Outer Index Rally 3975 are in the making. Follow-through above targets down move designated to Mean Sup 3805 is very high, with the possibility of the two additional targets - for NOW.

GBPJPY 1hr TF ViewBUY on Close above 169.370
BUY TARGET 1=169..870
TARGET 2=170.150
SELL on Close below 168.820
SELL TARGET 1=168.450
TARGET 2=168.220

Gold(XAUUSD) 1hr TF ViewBUY on Close above 1665.10
BUY TARGET 1=1669.70
TARGET 2=1673.30
SELL on Close below 1657.50
SELL TARGET 1=1650.40
TARGET 2=1644.40

Positive GDP + SupportGo long based on price action and if trendline is respected.
Beware of liquidity sweeps.

The Nasdaq 100 feels the weight of soft earningsThe Nasdaq was the weakest of the three major indices on Wall Street ahead of Apple’s earnings report scheduled later today.
Despite a strong start, Wall Street indices snapped a 3-day winning streak on Wednesday and handed back early gains just before lunch. Weak earnings guidance from large tech companies weighed on sentiment and served as a harsh reminder that we’re in a bear market. Microsoft (MSFT) and Alphabet (GOOG) shares fell around –8% and -10% respectively, causing concerns that Apple (AAPL) will also report a gloomy outlook later today.
The Nasdaq 100 has risen over 11% since its October low, but price action suggests a swing high may have formed. A resistance zone around 11,680 includes the 50-day EMA, 38.2% Fibonacci ratio and previous swing highs, and a bearish pinbar has formed on the daily chart.
Nasdaq E-mini futures :
Despite the weak close, the Nasdaq 100 is currently set to open around 0.4% higher looking at price action on Nasdaq futures. Yet as prices are only drifting higher the current assumption is this is part of a retracement, and we anticipate a break of yesterday’s lows.
Nasdaq 100 daily chart :
Given we are amidst a busy earnings season, we’re not looking for an outlandish move and will be ready for markets to turn one way or another at short notice. But given the Nasdaq’s reluctance to break above resistance ahead of Apple’s earnings, the path of least resistance over the near-term seems to be lower. 11,200 makes a viable initial target ahead of the lows around 11,000 – which also coincides with the June low – a break beneath which brings the month to date (MTD) low into focus.

¡¡The trend is changing!!Hello trading community! Well, I think the market has been waiting a long time for this drop. I've said it for a long time, this is that every trend has an end and a new beginning. Despite being manipulated by different players, markets are inherently immutable cycles. Technically, the US dollar index has been making lower highs since its high of 114.8, showing a loss of bullish strength and a bearish divergence. While we know the Fed's rate decision is approaching next week, which, as expected, will cause market volatility, we've been observing that 10-year yields have fallen, and some of the Fed's official actors have expressed their concern about Dissatisfaction with the aggressive rate hike policy. In addition, the market had two negative quarters, signaling the company's urgent need for profits to try to end the year positive rather than loss-making. This is not a financial advice, good trades and profits!!

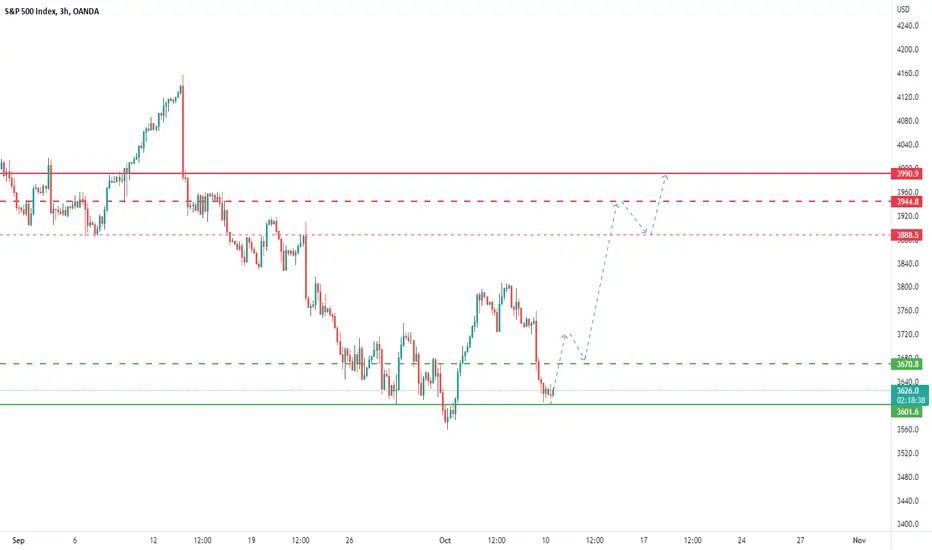
SP500 Gathers Bullish MomentumThe price gathered bullish momentum and finally broke out of the descending channel.
We can expect bullish price movement towards the resistance 3835.
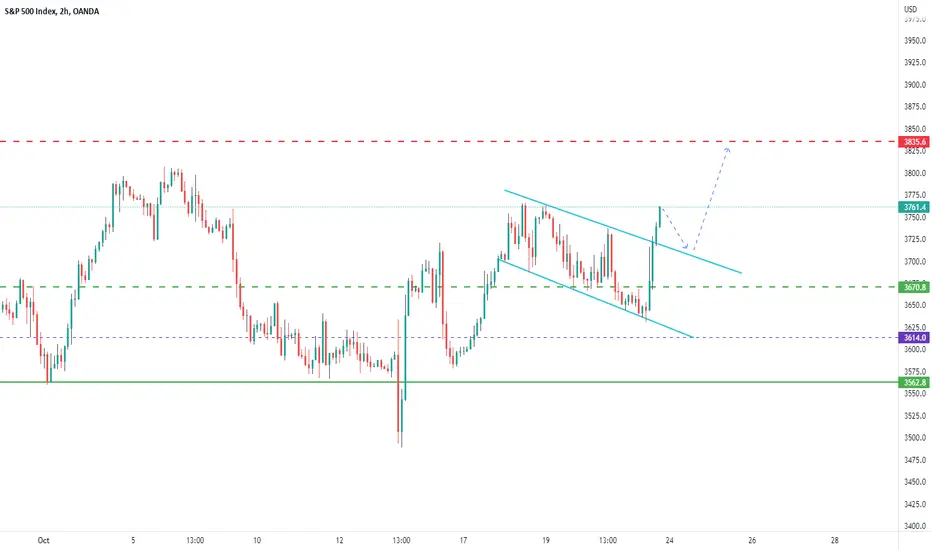
SP500 Price has formed an inverted head and shoulder suggesting a bullish trend.
We can expect price to gather bullish momentum to rise towards the 3945 resistance level.
Wall StreetTuesday, 25 October 2022
22:40 PM (WIB)
One more time, Wall Street shows bullish confidence movement and is confirmed to take control of daily MA50 and MA100, with an easy move.

Wall StreetTuesday, 25 October 2022
19:30 PM (WIB)
After reaching the daily resistance, where there are lays MA50 and MA100, the price started to develop bearish as they want these lines to be base support for moving down the price.
The ability of bear volumes still could not see as the base support, but the accumulative volumes getting stronger in 4H.
For the downtrend, the bears could expect to reach the resistance lines between 38.2% to 61.8%.
For Wall Street, I am only interested to open buy orders at the very strong base support to move up again.

The Wall StreetTuesday, 25 October 2022
12:45 PM (WIB)
Wall Street has been moving in bullish since the price hit the bottom around 28.600 points.
And start immediately rising with created A Tower of Bullish Engulfing.
These volumes absolutely were coming from a global market worldwide that expected the price to move high.
The bearish itself seems to have been finished when completed the downtrend at around 28.600 points.
The bulls successful run and stand above 38.2% as these lines became S/R.
Now, the price already meets 61.8%.
So, if the bears are strong enough, the price should move down back to 38.2%.
The Golden Ratio of 61.8% lays MA50 and MA100 in a daily trading session.
So, the bears will use this momentum to take control of the chart again.

¡Only the begining, stay alert!Hello trader comunity! We are seeing that the markets want to change their trend. More especifically the people thats is behind the computers wants to make gtains after two trimesters in loss. In the other hand, the DXY is fatally crushing after reach the level of 114 and we are seeing lower highs as the index cling to supports. The pair USDJPY after reach the level of 152 gets a reaction from the bears of the pair and then found support in the level of 147 (ema 21). Next week we have de interest rate decision of the Bank of Japan, event that could bring volatily to the pair. But what we must see is how the DXY start the week, anf if it continuos dropping behind 112 ( acting as resistance), we expect a recover from the US500, pairs against the dolar, and the crypto market. This is not a financial advice, good trades and profits!

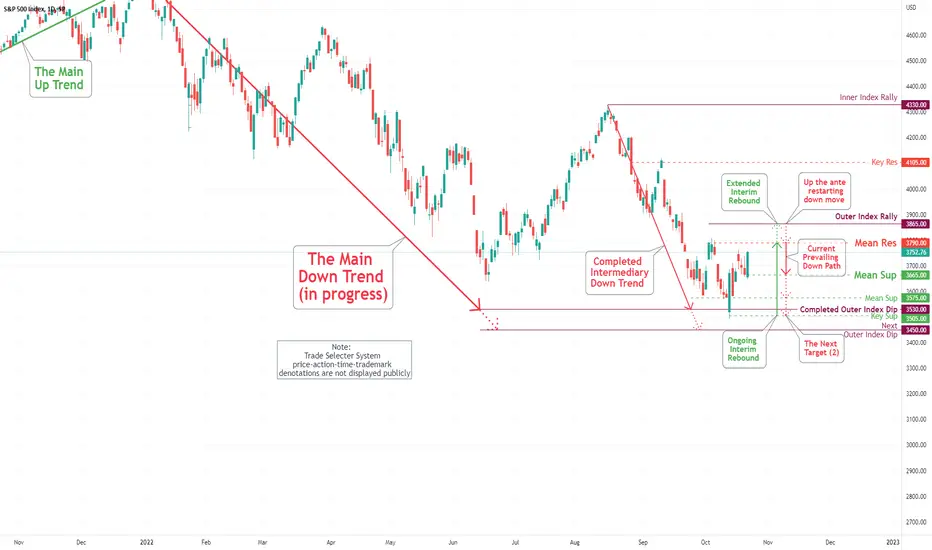
S&P 500 Daily Chart Analysis For Week of October 21, 2022Technical Analysis and Outlook
Currently, in the S&P 500 market, we have tremendous volatility both ways . . . traders/investors are losing both ways. The longs get stopped on the downside, and the shorts get stopped on the upside. What we got is that the whole floor gives way. Pay attention to the critical data presented here.
The upside target is marked at Mean Res 3790 and Outer Index Rally 3865. The downside destination is the retest of the Mean Sup 3665: Followed by the Mean Sup 3575, a retest of the completed Outer Index Dip 3530, and Key Sup 3505. Continuation to the next Outer Index Dip of 3450 is in the making.
Gold loses interest as a refuge, DXY with bullish forceWe have two consecutive quarters with losses in the markets. The bulls defend the last of the supports before a big drop, located at 1613. The great resistance to overcome is at 1637. If we remain below this level, we will see the bearish force renew. The dollar index has broken an important resistance level, heading towards the 114 level. The specter of the recession in the US continues and there are still no signs of a change in trend in the markets. In addition, the results of technology companies have not been very good, further weakening the confidence of investors in search of a change in trend. This is not investment advice, good trades and profits!!

USDCAD Bullish targetUSDCAD fake brake out after consolidation shows that price will reach 1.3945 level. Great level to put sell limit order.

The Wall StreetThursday, 20 October 2022
15:50 PM (WIB)
The bulls seem to defend the Support lines from the bearish market movement and until now, bears look does not have strong support in the major trend for moving down the price to the MA50 and MA100 as these are playing roles as important keys for moving up the price.
However, I will wait until the price has a clear directional move to enter the market.
My point of view is still in a bullish outlook with the target to hit around 32.000 points.
The bullish engulfing tower still could come around again in a strategic momentum.

The Wall StreetThursday, 20 October 2022
7:25 AM (WIB)
Wall Street is still in the middle of the battle for the pride of price. Bulls have taken control and rising the price by almost 300 points with A very high Tower Bullish Engulfing. That still stands strong today. While the Bears are still in the early to developing bearish market that looks still in a minor. But the MA200 4H is the important key to starting and reaching the market confidence for the next step either to moving up or down.
In my point of view, A very high Tower of Bullish Engulfing is a superb strong signal to attracting bull run until now. With currently have taken control of the MA50 and MA100 also MA20 of Bollinger Band. I will open Buy Order soon when the price has been confirmed to stand exactly at MA50 and MA100, or stand above exactly at the MA200 4H. Even though the blue lines are developing as Support for the Bulls right now, but is too risky to put the money in that area.

sell nasadq “Higher interest rates, slower growth, weaker labor market, and market conditions will reduce inflation , but they will also hurt businesses and citizens , these are the costs we will pay to reduce inflation . But failure to restore price stability means more pain.
