The Wall StreetWednesday, 19 October 2022
12:33 PM (WIB)
38.2%FR now being as support lines for the bullish move to take control of MA200. I could not see some towering of bearish engulfing except short-term on this bullish momentum. So, I’m expecting the price reaches the resistance at 31.500 and fly high to 32.800 points as my target order.
Wallstreet

Nasdaq 100 Sets up to Bounce, How Far Could it Go?From a technical standpoint, the Nasdaq 100 could be eyeing near-term gains. Prices have left behind a Bullish Engulfing candlestick pattern, opening the door to an upward extension.
This also follows positive RSI divergence, which showed that downside momentum was fading.
Prices closed above the 20-day Simple Moving Average as well.
Further gains would place the focus on the early October high at 11729.
Keep a close eye on a potential falling trendline from August (red-dashed line). It could reinstate the downside focus, falling toward the February 2020 high at 9763. Otherwise, more gains could be in store toward September peaks.
NQ1!

S&P 500 - BROKEN RESISTANCE LINE 🚀The S&P500 price breaks the Resistance Line & Retested 🧐
the old Resistance Line becomes new support line 🔥
so, i predict a bullish move 🚀
TARGET: 3790.86 🎯
...
if you agreed with this IDEA, please leave a LIKE, SUBSCRIBE or COMMENT!

WALL STREET Saturday, 15 October 2022
21:55 PM (WIB)
After reaching the very strong support where there are stand MA200W and MA50M, the price rose very fast vertically to the first resistance, and could not break out from this resistance.
I see a very strong tower of bullish engulfing that reached and stands above MA100 and MA50. The price also ended exactly at MA50D 4H.
The situation is still in Bullish Control, even though Bears taking control of the first resistance and the Clouds data in a bearish market,
I see the Bollinger Band shows the price has the intention to move up and will try to break out from that resistance.
This week will be the final battle for the Bulls to create a strong signal for the Golden Cross.
I also see the Ichimoku Cloud has been flat now. This would be indicating the price will move higher from now.
Unfortunately, if the price falls below MA50 and MA20, Bears will be trying superb vertical volumes to take control as the Bearish Support. And the price absolutely will be falling down.
So, I’m expecting the price will move up and create A Morning Star formation to the resistance. This formation will lead the price to move higher and higher.

S&P 500 Daily Chart Analysis For Week of October 14, 2022Technical Analysis and Outlook
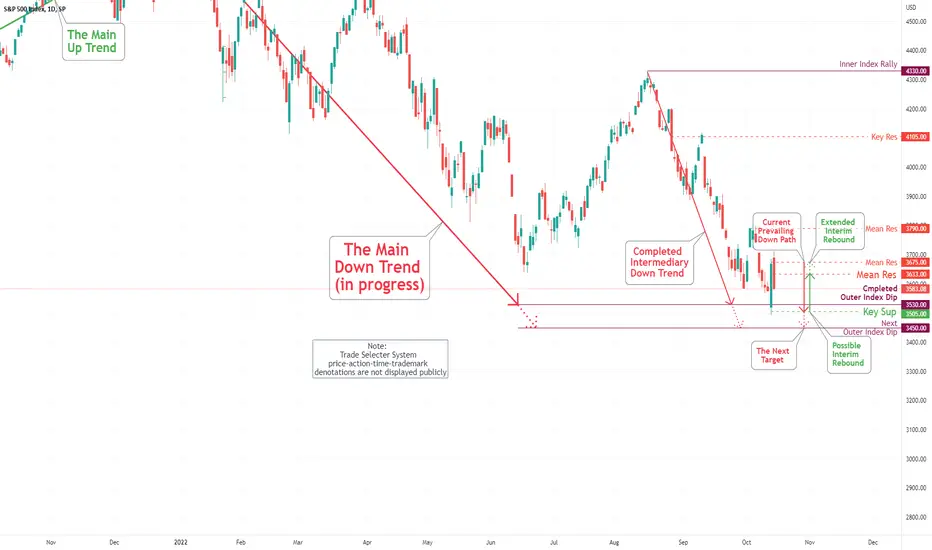
The immediate reversal on Friday of the vigorous upside rebound (Dead-cat ricochet) on Thursday was caused by the long-term specified Outer Index Dip 3530 (Oversold market): The downside target is the retest of the Key Sup 3505, Outer Index Dip 3530 with the Next Outer Index Dip 3450 is in the making. Following the completed above-specified targets, a short-term move leading to the newly created Mean Res 3633 is possible.
NAS100UPDATE . TP1 hit , still holding some position to the downside as the market closes. MOMENTUM STILL BEARISH , Target 2 is the lows created or supply below.
Note. Analysis was done on 5min TF.
Blessed Weekend yall

Gold is about to go down again!!!The Fibonacci level matches the key level, after retesting that level and an upcoming USD hawkish rally will be a fact, once the US Market opens, this will give us another opportunity to short the gold again.

DJIA (US30) losing Investor InterestI personally do not trade Dow Jones Industrial Average but it does not hurt me at all to guide people who do. Well, bad news guys, the picture on the popular index US30 does not look very appealing to the investors at the moment. FEDs are to blame for the vicious rate hike adventure that is drawing investors away from a very large investment pool such as US30.
Technical Perspectives:
1- We have come across an inverted head and shoulders pattern that encompasses nearly 2 years of consolidation and reversal dynamics
2- Darvas Box 1 consolidation exit that is pointing the trend back to pre-COVID levels
3- Blunt Rate Hikes from FEDs is drawing investors away
Counter-inflation measures are actually proving to be a double-edged sword. Not really an appealing picture to buy DJIA shares at the moment!
But considering that it has also presented a great opportunity to go short on US30, you can still make money off the fall. Therefore, trade safe, manage risk responsibly and happy trading :-)

S&P 500 Daily Chart Analysis For Week of October 7, 2022Technical Analysis and Outlook
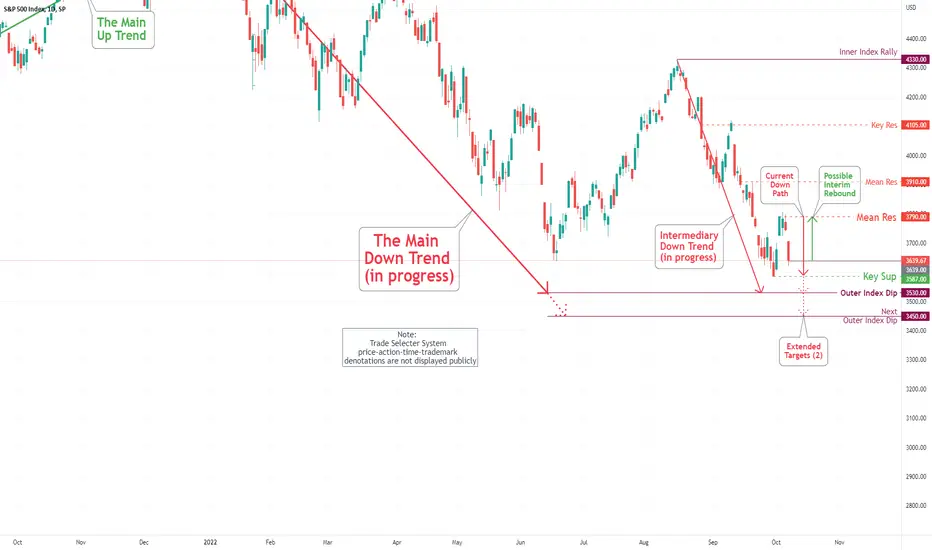
Repeated dead-cat moves to Mean Res 3720 and Mean Res 3775 - the letter partially fulfilled last week (as pointed out on S&P 500 Daily Chart Analysis For September 30) was in order throughout the trading week. Short-term moves leading to the newly created Mean Res 3790 are possible. Currently, on the downside, the main target is Key Sup 3587, and Outer index Dip 3530 - Next Outer Index Dip 3450 is in the making.
253 RetestAll investors are curious to know where the bottom of this movement is.
I will not say I know it, yet this stocks needs some relief in price and it seems today we might be getting it.
TSLA price bounced off the 233.51 level and aims to retest 240.
If we are able to hold above 241 then I expect the next target for retest is 252 if price action helps

TM Toyota crash scenarioIf US Market goes down, $52 is good level to place buy limit order on Toyota Motors!

S&P 500 Daily Chart Analysis For September 30, 2022 Technical Analysis and Outlook
Repeated dead-cat moves around completed Inner Index Dip 3760 were in order throughout the week, along with the partial completion of our interim rebound target to Mean Res 3775. On Friday, the index penetrated the Inner Index Dip 3760 and is on its way to our next specified target Outer index Dip 3530 - Possible short-term moves are leading to Mean Res 3720. Next Outer Index Dip 3450 is in the making.

US30 28th SEPTEMBER 2022Wall Street is increasingly concerned that the Fed's six-month inflation fight will push the economy into recession. The recent selloff seems to be the catalyst, including the US central bank (Federal Reserve/The Fed) being aggressive to raise interest rates. Finally shaking up the currency market.
With the dollar overvalued in recent weeks, market participants are likely to avoid the risk of a correction by moving into large companies that are likely to survive a recession.
US30 23rd AUGUST 2022

SPX500 ShortSPX500 is moving toward a weekly zone .. looking for it to break the some moving down & to continue with bearish momentum.

DOW JONES | LongThe falling trend has been quite continuous; But the price has approached a relatively strong support level, while the daily candle has closed similar to the hammer. My outlook is a suitable correction of this falling trend.what do you think?

S&P 500 Daily Chart Analysis For September 23, 2022 Technical Analysis and Outlook
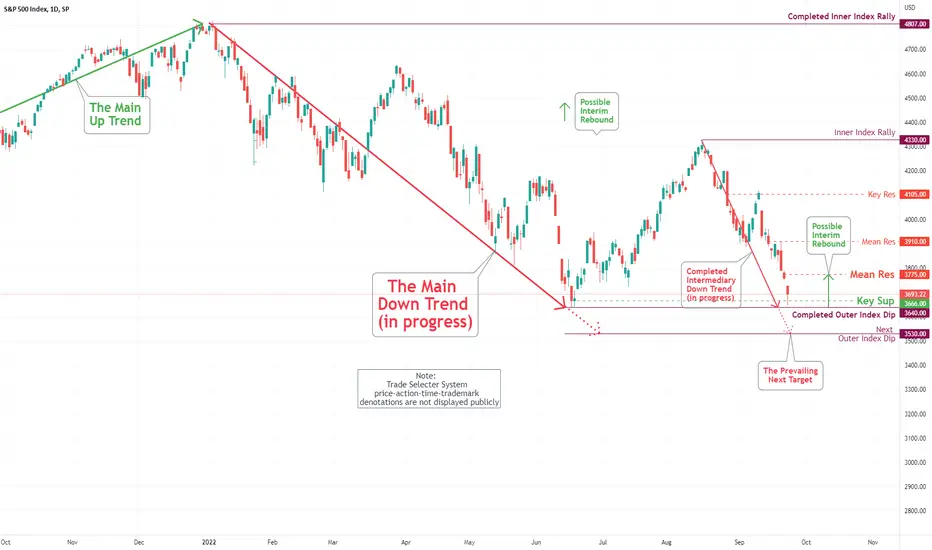
Aggressive down move to Inner Index Dip 3760 and the next move to completed Inner Index Dip 3640 and Key Sup 3666 - completed, as specified on ''Daily Chart Analysis For September 16''. The following primary down target is the Next Outer index Dip 3530. The interim rebound to the newly created Mean Res 3775 is very much possible.
S&P500 - Hammer time, good chance of a rebound. $SPXHammer on the daily chart needs confirmation, but the low price coincides with the Fibonacci level 2 and the static support of the November 2020 high. The stochastic is oversold on the daily, weekly and monthly chart is at 2008 levels. Previous situations always followed by a rebound. On the weekly chart, the rebound occurred followed by an increase in volumes which at this time are still low. Friday's downside stopped at a double low from June 2022. If confirmed, there is a good chance of a rebound. Take care.

Uncertainty or controlled Chaos?Everyone witnessed the new lows across the market with exception of a few stocks.
TSLA was one of those stocks that even after experiencing a sharp drop it managed to still hold its ground and maintain its previous bullish structure.
My expectations for the day are simple...
Expect to see some chop between 298-300
This is important since if TSLA is to remain bullish you would need to see a bounce at this level that is being retested.
A bounce at this level might encourage buyers to retest the stronghold sellers have set up around 310-312. But another test of this level will weaken sellers sentiment for the time being.
If TSLA is unable to hold above 298 then your next levels to look for are 295 and
290 with and eye to the 280 level.

$SPX downhill without brakesFear inside Wall Street
The CNN Business Fear & Greed Index, which measures seven gauges of market sentiment, is once again showing signs of Fear on Tuesday as the broader market plunged. The VIX, a volatility index that is one of the seven components of the Fear & Greed Index, shot up nearly 8%.
The Fear & Greed index was in Fear mode a week ago as well but it had recently moved back into Neutral territory following a 4-day winning streak for stocks.
That streak is coming to a spectacular end thanks to the hotter than hoped for consumer price index report, as investors worry that the Federal Reserve is going to raise rates even more aggressively next week to fight persistent inflationary trends.
Wall Street's mood has largely tracked the rapidly changing expectations regarding inflation and rate hikes. Just a month ago, before Fed chair Jerome Powell gave a speech that suggested more big rate increases were coming, the Fear & Greed Index was indicating levels of Greed, a sign of complacency.

S&P 500 Daily Chart Analysis For September 16, 2022Technical Analysis and Outlook
The index destiny to the Mean Res 4105 - completed. Aggressive down move to Mean Sup 3908 - completed. The succeeding move to Mean Res 4105 caused the index to drop viciously and progress to the Inner Index Dip 3760, which is on its way, as specified on ''Daily Chart Analysis For September 9''. The interim rebound to the newly created Mean Res 3946 is very much possible.

FSLR Daily Technical AnalysisFSLR Daily Technical Analysis
Resistance price: 139,91
Support Price: 121,91 - 111,20 - 102,12
We added this stock from 127,03 price early time. Four days ago daily technical started show NEGATIV and 3 days volatility started down. Losting power. Until 77,50 has space of technical graphic. Middle term price need close this.

S&P 500 Daily Chart Analysis For September 9, 2022 Technical Analysis and Outlook
The current index destiny is the Mean Res 4105, and the worst-case scenario Mean Res 4205 is designated by interim rebound. The current Inner Down Trend targets Mean Sup 3908 and the Inner Index Dip 3760, following hitting upside prices.

Are we still bullish here?While all other tickers are falling apart TSLA has done an incredible job at keeping its structure almost intact.
The bounce at 273 was a great sight of relief for buyers since the next leg down would be 256.
yet the retest of 280 will tell it all.
looks like while TSLA is still on a Macro down trend it has held a rising channel and is signaling a flag as well.
Do we see the test of 327?
