BTC heading down to 18-20K When you have MULTIPLE confluences in SAME PLACE that could lead to high probability scenario.
Those confluences that make MACRO and short term outlook on BTC so bearish are :-
1) LOG REGRESSION CHANNEL :-
2) Target of bear flag is just at that major support zone which coincides nearly with PREVIOUS ALL TIME HIGH as well.
3) As per wall street chart, it seems to ME that we are in ANXIETY Phase and slowly moving towards Denial Phase
pbs.twimg.com
4) ALSO MANY bought BTC ABOVE 30K. They would be BAGHOLDING BTC NOW.
**THIS IS A WARNING**
DANGEROUS TO SHORT FROM LOWS. BE WARNED.
PREVIOUS IDEAS :-
1) Short idea for BTC :-
2) updated views on BTC :-
3) ETH IDEA :-
ALSO, NONE OF THE ABOVE IS A FINANCIAL ADVICE. IT IS MERE MY OWN SPECULATION AND IDEA. DOYR.
Wallstreet

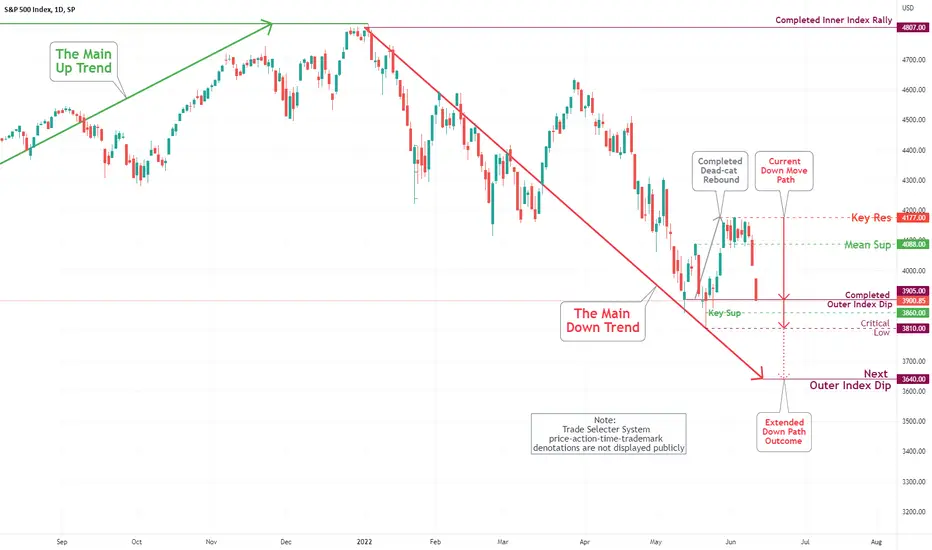
S&P 500 Daily Chart Analysis For June 10, 2022 Technical Analysis and Outlook
The index bounced between our Mean Sup 4088 and Key Res 4177. But from the Wednesday session, all went downhill, as shown on S&P 500 Daily Chart Analysis For June 3. Critical Key Sup 3860 and low 3810 are the following targets: The ultimate Next Outer Index Dip 3640 is the primary mark. Short-term rallies are expected.
StoneCo (STNE) following exactly: Wall street Cheat sheet Hello Traders / Investors
Seems like Wall st. Cheat sheet is CORRECT. Sad for me I realized it too late and missed some profits in last weeks.
Considering my DXY Elliot Wave coun, my expectation is another drop of STNE price where wave C will be 1.618 of A = Price around 5.5 USD. (Best place to buy some shares + Also watch Konvergence of RSI on 1D/1W TF).
ritholtz.com
Learning every day.
Trade safe, take care and enjoy the ride.

S&P 500 - RECESSION SCENARIOInterval: 4hrs
Description: Took 4 hour interval and in this scenario S&P 500 sees 30% plunge from current Levels of 4100 to 2900s. Not just being gloomy it's just the possibility of the current recession indicators pointing out. Again this is not a financial advice or something. Don't take it seriously.

NAS100 LONG SET-UPNAS100. What we currently seeing is a simple channel , that is now showing us that the third is still not filled yet, a great opportunity to enjoy the rally to the upside. the market is now consolidating showing us market breath after the impulsive move, Thinking in probabilities, we see that the market has some probability of giving us a double bottom, whereas we open to that possible move, Risk your capital wisely, stay away from putting stops near psychological areas market makers know where to take you out, be careful.

*UPDATED* nas100 analysis (06 june-10 june)so this is just an update of the analysis i published two days ago, the clear-off on the daily seemed like a breakout to me but now i know to always wait for a significant close above or below to confirm a breakout.
but my analysis is as follows :
1. we are at a monthly level of support
2. market closed above an upward trendline from the weekly timeframe
3. a double bottom was formed on the daily and its neckline was broken and retested and the market failed to break below that level for a week
4. so on the H4 i'll be waiting for a significant breakout of that range to the upside and then look for buy entries
5. entries could be the breakout of a counter trendline (downward trendline), a retest of that broken resistance level or if price respects an upward trendline
same could happen for a bearish move but there is just a higher probability of price moving up

GER.30 SIMPLICITYGER.30. Great view i have on the ger.30 simple technical methods i used here. firstly we would do a multi-time frame analysis 1W and see that price broke our major trendline but never came to retest it enough momentum to look for a buy , moving to the 4H chart we see the price created rising channel CLEAN confirmation on the uptrend reversal, with inner patterns formed inside, currently we waiting for price to finish the correction pattern, our point of interest is at @14398,1. Risk management is what keeps you longer in this Game...

CROUSDT CROUSDT seem to complete is bear rally and bulls are in at this time its worth risking as you buy at discount price

S&P 500 Daily Chart Analysis For June 3, 2022 Technical Analysis and Outlook
The previously specified (S&P 500 Daily Chart Analysis For May 20, 2022)
Mean Res 4088 inverted to Mean Sup 4088 performed at best on May 1 and 2 this week trading. A solid dead-cat rebound is completed; however, follow-through to New Mean Res 4177 is possible - from where we stand, a down move is expected.

US30 ON A CORRECTIONUS30 Stock looks like this. first we looking at broken inner falling channel, whereas price shows the no return, after a strong impulsive move price is now consolidating, clearly signing a breakout/continuation, If you look closely you are looking at Bullish rectangle, and our Doji candlestick on daily Timeframe. My technical move is to the upside, wait for proper price confirmation, and apply a proper RR. PLEASE COMMENT BELOW YOUR VIEWS....

US30 l DAILY l OUTLOOKDAILY TAKEAWAYS:
Last weeks TA played out perfectly.
1. Broke two BOS @ 31550 & 32650
2. Broke out of descending channel
3. Broke though major key level zone 32100 - 32450.
Looking at what we see now. (4 HR)
1. US30 rejected off bottom of major zone 33350 - 33650.
2. US30 broke through 200 MA which could potentially change trend if a bounce retest is made.
3. If we continue to push bullish there is a major BOS @ 34050 that has acted as a rejection / resistance zone.
4. Viewing top MACD indicator it is the first time in months we have been above the 200 level.
Previous TradingView TA linked

Crypto Decouples From Stocks. Is the "Flippening" on its Way?On Friday the (currently volatile) stock market rallied a little, putting Wall Street somewhat at ease. But an interesting thing happened that day that never happened before - crypto assets actually went down, instead of up.
If you're a crypto holder you're probably prefer to see the pattern reversed, but it's still an interesting pattern worth exploring further. If crypto and stocks are finally "decoupled", does this mean that when stocks go down next time, crypto is going to go up? If so, when the recession hits later this year, it could mean good things for the crypto ecosystem, long-term. The "flippening" may well be on its way.
Many investors are waiting to see what happens on Monday, when Wall Street opens up again - the fiat markets are likely to go down again in response to Friday's rally, at least in the short-term. How will crypto assets respond to this event? Will it move in parallel again? Or will it do its own thing?
Also a few comments about Tezos (XTZ) and Dogecoin (DOGE) that displayed independent movement on Friday as well.

NASDAQ BOUNCES ON SUPPORTLast week Nasdaq tested the support and bounced bullishly attempting to recover. The price dropped back to the support but could not close below it.
The price rejections on the support, rsi bullish divergence, and double bottom indicate a bullish move in the coming week.
Initial targets are 12600 and 13150.

Rally or continuation?Tsla closed 05/25/22 @ 658.68
Continuing to offer Lower Highs and Lower Lows.
Though price action shows some signs of hesitant buying so far and it is noticeable in the forming Bear flag on the 4H.
Lets see what comes out of this formation?

US 30: Intraday Technical AnalysisThe US30 once again took rejection from 32200. My idea is that the price is going to test the adjacent supports from where long positions can be taken. My goal is to enter after confirmation of supports near 31600 and 31200 with the goal of target resistance of 32000.
If you like this or if you think the opposite of this or if there is any other opinion, mention it in the comments. I am open to all kind of suggestions and critics

US30 l DAILY l OUTLOOKLooking back at May 16th & May 22nd (LINKED IN DESCRIPTION) TA that was sent on US30 the following was stated and played out for both.
MAY 16th TA
“We saw on Friday a nice bullish flag pattern play out. We broke our downtrend trend-line and retested the our bull flag twice clarifying added support to that area.
What we see / need to see now.
1. US30 is still not out of our bearish zone. US30 is still under 200 EMA on our 4 hr chart.
2. US30 retest our downtrend trendline and formed a nice price action support pattern (circled).
3. US30 has entered back into major zone 32050 - 32450.
4. Need to see a higher low formed or a BOS of 32450 which has been a major rejection zone.”
MAY 22nd TA
DAILY OUTLOOK / TAKEAWAYS:
1. US30 is still overall bearish . Retesting major levels 31250 & 30750 for the first time MARCH 2021.
2. Last time these levels were touched we reached ALL TIME HIGHS.
3. US30 is still breaking in and out of descending channel .
4. US30 bounced off of major zone 30750 and is now retesting major zone 31250.
5. NEED TO SEE A FULLY ENGULFING CANDLE TAKE OVER AND ENTER BACK INTO DESCENDING CHANNEL .
6. ENGULFING candle needs to clear BOS and retest BOS to see continued upwards bullish movement.
MAY 25th TA
DAILY TAKEAWAYS:
1. US30 saw multiple retests of BOS / support and resistance level 31550.
2. Fake of candle breaking through BOS (circled) rejection wick.
3. We have broken out of descending channel once again.
4. Need to see a minor retest of descending channel then a break into major zone 32100 - 32450.
5. Next major BOS is positioned at 32650.

US30 Intraday Technical Analysis:US30 took support from 30600 on Friday. The rally continued on Monday . US30 met with initial rejection at 31900 after testing the resistance multiple time the price action started moving downwards. Currently the US30 is testing the support of 31600. My idea is that the price will try to take support from 31600. My goal is to make entries at 31600 and 30600 with target of 31600 and 31900.
If you like this or if you think the opposite of this or if there is any other opinion, mention it in the comments. I am open to all kind of suggestions and critics

US30 l DAILY l OUTLOOKLooking back at May 16th (LINKED IN DESCRIPTION) TA that was sent on US30 the following was stated and played out.
“We saw on Friday a nice bullish flag pattern play out. We broke our downtrend trend-line and retested the our bull flag twice clarifying added support to that area.
What we see / need to see now.
1. US30 is still not out of our bearish zone. US30 is still under 200 EMA on our 4 hr chart.
2. US30 retest our downtrend trendline and formed a nice price action support pattern (circled).
3. US30 has entered back into major zone 32050 - 32450.
4. Need to see a higher low formed or a BOS of 32450 which has been a major rejection zone.”
DAILY OUTLOOK / TAKEAWAYS:
1. US30 is still overall bearish. Retesting major levels 31250 & 30750 for the first time MARCH 2021.
2. Last time these levels were touched we reached ALL TIME HIGHS.
3. US30 is still breaking in and out of descending channel.
4. US30 bounced off of major zone 30750 and is now retesting major zone 31250.
5. NEED TO SEE A FULLY ENGULFING CANDLE TAKE OVER AND ENTER BACK INTO DESCENDING CHANNEL.
6. ENGULFING candle needs to clear BOS and retest BOS to see continued upwards bullish movement.

S&P 500 Daily Chart Analysis For May 20, 2022 Technical Analysis and Outlook
The down sentiment move is completed with respecting our completed Our Index Dip 3,905 with the possibility of a significant solid rebound to our Mean Res 4,088 is not out of the question.

Dowjones - Long Fibo 38.2Chi so Dowjones da co 1 phien giam den 1300, co hoi de an song dieu chinh vung fibo 38.2 khung H4.

USD/CHF: Heavy Bank Selling | Short attractiveUSD/CHF Short Setup:
> Heavy Bank selling seen
> POC above current level
> Head n Shoulder Formation
> Downward Trend intact
> Sell-off in stocks favors USD strength
For more ideas just look at my bio!

aaplThe scenario of shorts and longs is on the chart
To enter after pullback
We can enter the position

DJIIm going short on dji. I was waiting for pullback to D poc (untested) after previous H4 bos. confirming with regular div & change in coch on M5 for entry.
Stop loss just above previous Dpoc. Target 1 = new printed D poc , target 2 = H4 lows.
