US30 BEARISH DYNAMICSDow recently bounced off the support and retraced to the monthly pivot before dropping back to the support.
A small retracement may happen at the beginning of the week before gathering enough momentum to break the support and head towards 31700 initially.
Wallstreet

EURUSD bullish manipulationThere's a hidden move in play. Community sentiment is already high, about 80% buyers and 20% sellers, they'll try to feed on our expectations in the coming days... Trade responsibily and use proper risk

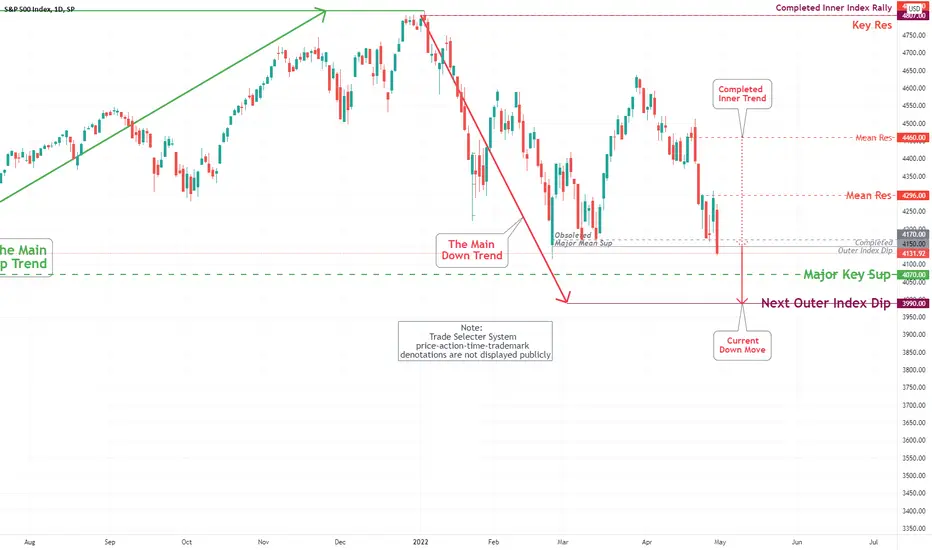
S&P 500 Daily Chart Analysis For May 6, 2022Technical Analysis and Outlook
The downtrend as specified in Daily Chart Analysis For April 29, 2022
to Major Mean Sup 4070 is firm and concrete. Down movement continuation to Next Outer Index Dip, 3990 must obsolete the Major Key Sup to continue - we will observe and track this the following week's session. Interim bullish moves are possible within the current downtrend.

Bank of America - it will be a great again like USA? hi,
we have a big problem, because when I look on the Simple Wall Street application I see that lot of managers from top banks sold their stocks of their own banks. I think: Citi, Goldman Sachs, GP Morgan,
Please read also ZeroHedge article about banks in USA, only to summarize it: we have to wait to October to see where will be the index of SPX
in Poland we say - without banks there is no hosanna, bullish market.
There is great back in stocks, lot of selling, people are right now on the cash sitting.
I think that looking on Fibonacci - 25 will be tested, o 20 USD?
Also look if there are more PUT or Call Options.
It is better to wait right now and wait for any signal that it will move up back, on all the market, not only on one stock
There will be up and down, hills and bottom, remember that next hill must be above last one that we can say that market will move then up...
Also there must be a calm down - no more sliding down in quick time ...

BTC BULLRUN STILL ACTIVE!- We are still in consolidation everyone!
- IF BTC breaks below the support level, closes and retests to the downside then we could see a massive crash, but long term 1-3 years we will see $100,000 + BTC
- NOT FINANCIAL ADVICE!

CL-OIL Trading Signals Daily Analysisas you see the target is achieved. the price got to the green resistance.
follow and share for live trading signals.

CASPER NETWORK EASY 44X- Follow the WALL STREET CHEAT SHEET!
- I made easy 10-20X gains since 2020-2021 by simply following the WALL STREET CHEAT SHEET!
- Invest when the market is in disbelief!
- HIGH RISK = HIGH REWARD!
- A lot of CRYPTOS have peaked above the 4.618 FIB EXTENSION - a lot have peaked above the 34 extension, so from the low we are at now $0.048 we could hit a minimum of £2.14 in the next 1-3 years.
- £2.14 divided by £0.04829 = 44.3 - so if you would invest £1,000 at this low you could potentially turn that into £44,000, then look for another 10X project and that's £440,000 do that one more time and you now have £4.4 Million!!! Easier said than done!
- However if your patient then its possible to achieve those gains!
- NOT FINANCIAL ADVICE!

S&P 500 Daily Chart Analysis For April 29, 2022 Technical Analysis and Outlook
The current downtrend is expected to continue to Major Mean Sup 4070 and Next Outer Index Dip 3990. Interim bullish moves are possible within the current downtrend - such as Mean Res 4296.

DJI Dow Jones Possible MoveThe Dow Jones Industrial Average is pullback after breaking the trend line and can grow up to 34069 units.


S&P 500 Daily Chart Analysis For April 22, 2022 The current downtrend is expected to continue to Major Mean Sup 4170 and completed Outer Index Dip 4150. Pending verification, the upside move to the newly created Mean Res 4465 is possible within this movement.

S&P 500 Daily Chart Analysis For April 15, 2022 Technical Analysis and Outlook
The current downtrend is expected to continue to near-term Inner Index Dip 4337. Pending verification, the upside move to Mean Res 4447 is anticipated - some bullish activities are possible within this movement.

Wall Street Will Target 31000 By SummerLooking for sells over the next several weeks as Wall Street ended the quarter bearish. We should expect monthly continuation in the bearish direction allowing for the weekly to trend lower. At 31000 the weekly is exhausted and I expect a monthly retracement to the upside short term.

US 30 below the supply zone
US30 is currently below the supply zone of 34500. We can target 34000 from here if the price breaks below 34500 and give a daily closure below this level. My target is 34300 and 34000.
If you like this or if you think the opposite of this or if there is any other opinion, mention it in the comments. I am open to all kind of suggestions and critics.

CITIGROUP: earnings coming soonNext week will be published the US most important banks earnings and among them, Citigroup is for sure the one with the best focus. In particular, the US bank is the one with higher exposition in Russia: almost 10 billion dollars.
So, what can be the next scenario?
I'm short on CITI due to both fundamental reason and technical reason:
We are in a short trend, so basically, being trend follower, I will search for retracement to be in.
CCI oscillator gives long signal plus bullish divergency on the price. This can give the necessary boost to the stock to retrace up to 56-58 dollars before getting back to its lowest price.

us30usdIn the daily time, due to the inability to break the static resistance, I expect the Dow to fall

Full multiple breakdown analysis of US30Here is a full multiple timeframe breakdown of US30 /Wallstreet30 indice.
Enjoy and come back with a feedback of results.

Long Tesla after Musk's speachTesla, before reaching next highs at around 1190$, can retrace until the first area, that we can visualize in the green rectangle, that covers the price range of 940-1000$. In addition, the bearish divergence upon the CCI oscillator can accelerate the price retracement.
The 200 average shows how the long term is still bullish and Tesla could be above it for the next days confirming its strength.
From a fundamental point of view, the company estimates to sell more cars than the previous quarter although the electric cars industry has faced a serious issue in supplying chain.

us30 (wall street)this fibo 61 level means 35150 is major resistence for the next . this is the next selling oportunity when price move to the down side and a valid price action to go low side so wait the main for now and see the price what he really react

S&P 500 Daily Chart Analysis For March 25, 2022 Technical Analysis and Outlook
The uptrend continues on its journey to retest our Mean Res 4590 while Mean Sup 4455 rests below with strong probabilities to be revisited afterward.

NAS Weekly ForecastSweet Dreams Traders, this weekly forecast i can see the market to continue bearish until it breaks a Lower High. Which it hasn't on the weekly and daily timeframes yet.On the 1hr showed a little manipulation move, where it did break a lower high but then rejected back to the downside. Im expecting this week for bearish setups to the weekly's low which is 13024.4. Have a great trading week and comment down your thoughts.
