BUY US30!Traders are finding themselves lost in the market lately and its time to start gaining confidence on how the Stock Market is regaining its confidence in the market and it seems to be that US30 is having a hard time dropping points. This swap zone is a perfect opportunity to buy noticing that in historical data there seems to show lots of momentum come out of this area. Tight SL and High Reward looks like it'll have to do.
Wallstreet

NAS possible Bullish to 10300 ?NAS100 has been bullish last 2 NY sessions. With strong bullish momentum happening within the last hour of each session around 3-4pm EST. Currently price is ranging during Australian and Toyko as it was doing yesterday 6/29/2020. During Pre London and London session I'm going to see if price will break current support at 10134 and head down to liquidity pool at the zone of 10100 to 10085. If i see rejection around that zone I will look for buys during the NY session to push bullish momentum up to 10200 and then on to 10250 and 10300. on 6/23/2020 last week the high was 10310. Ultimately my bias is Buys going long for the long term. If your up late you can take shorts down to 10100 or lower until we see exhaustion, during the London session. But I'm headed to bed lets see how NY session goes at 9:30pm EST. Good Night and hit Like if you agree. Subscribe if you want to see more of my breakdowns. Im still learning, yet earning. Focused on Risk management. You will always remain profitable if you have more wins than losses.

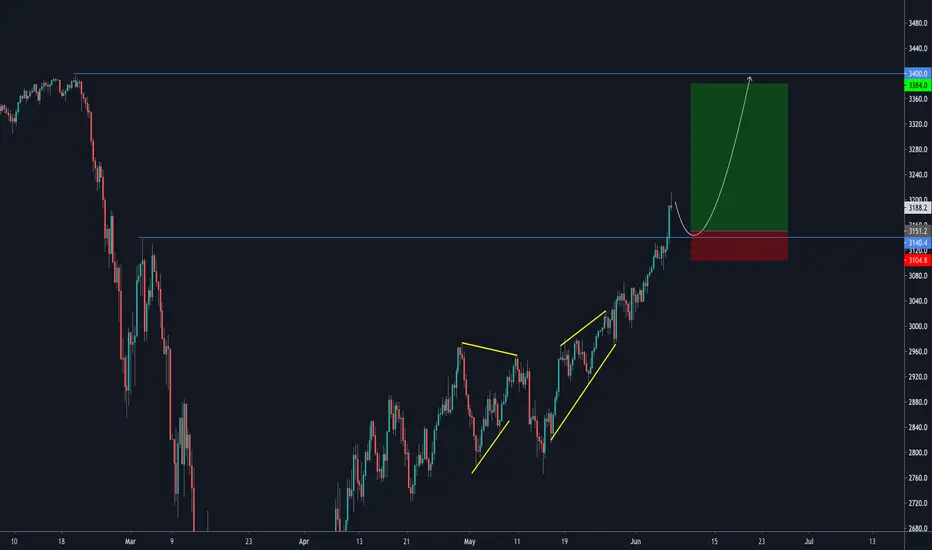
Wall Street Almost Flying ! OK here we have 3 bullish patterns
1st bullish flag
2nd bullish triangle
3rd bullish head and shoulders
so far im waiting for a break out for a perfect entry
For any further questions kindly dm and im glad to answer you

Is it a bird? Is it a plane? LOLRight - guys and gals - it doesn't get much better than this.
Just don't blow up your live accounts on this pattern. Anything is possible.
Disclaimers : This is not advice or encouragement to trade securities. No predictions and no guarantees supplied or implied. Heavy losses can be expected. Any previous advantageous performance shown in other scenarios, is not indicative of future performance. If you make decisions based on opinion expressed here or on my profile and you lose your money, kindly sue yourself.


QUANTUM SLOWNESS - WHAT NEXT?Hopefully this post is both educational and entertaining.
I was having a discussion on line about the advantages of quantum speed trading - and how it has a greater power than the human brain. For sure it is more powerful at number crunching.
But quantum slowness is about trends! Look at the lovely 15 min trend. No big muscle computing power required. Just your plain slow eyes. If you had hugged that 15 min amber trend line on the break out of bad news, you would have been sitting very happy, after 24 hours.
So - true trend-followers do not care about brute force computing power. The human mind is superior for trends. Any arguments?
Some will be asking me what's next? How would I know? I don't have any ownership of the future. Ask your friendly guru out there - not me! :) :)
Disclaimers : This is not advice or encouragement to trade securities. No predictions and no guarantees supplied or implied. Heavy losses can be expected. Any previous advantageous performance shown in other scenarios, is not indicative of future performance. If you make decisions based on opinion expressed here or on my profile and you lose your money, kindly sue yourself.

apple trend analysishello , i came with my new opinion about apple stock ...!
after a massive growth in apple stcok price and hit all time high , price has faced to a resistance Which caused stock prices to fall earlier ,
and another risk threatened the market is the covid 19 phase 2 and the interesting point is when AAPL hit that resistance ( trend line ) before market were at risk for corona and after that , the drop down happened , now AAPL hitting that resistance ( trend line ) again and market is facing to a covid 19 phase 2 , another drop down will happen ???? we will see !
ps: The desired resistance is indicated by red circle


Wall Street DJI Long Hi Foxes
This is my view, you can find everything you need on chart.
Safe Trade

Is 27,000 going to be your number? There were mad moves on the DJI (Wall Street) north on Friday 5th May 2020. The bulls gored the bears big time.
But there's 'fundamental' stuff that's not right. The Bureau of Labour Statistics (easily findable via a search engine), said that their figures were not correct. They even said in their report that if unemployment was counted more correctly the percentage would have been 3% higher.
However, the bulls were in a frenzy. Greed and hope dominated. Reality meant nothing.
Then there are other problems coming up. If you don't believe that COVID-19 has died and you think that human beings are the main vehicle of transmission, then mass protests breaching social distancing and public gatherings are likely to bring a second wave of virus infections. Hello - what caused the bubble to pop in the first instance?
If you don't believe that there is cure or vaccine in sight for the next 6 months to fight this virus, then it means the virus is gonna exploit human interactions from mass protests across America and other parts of the world - without restraint.
If you believe that money printing is the economic fix for the myriad effects of COVID-19 on GDP (and that GDP is important), then for you the markets will charge north forever!
The choice is yours about what you believe. But what you believe could be the result of manipulation of minds by fake news. Some say there is no such thing as fake news.
Disclaimers : This is not advice or encouragement to trade securities. No predictions and no guarantees supplied or implied. Heavy losses can be expected. Any previous advantageous performance shown in other scenarios, is not indicative of future performance. If you make decisions based on opinion expressed here or on my profile and you lose your money, kindly sue yourself.


Dow go short another divergenceYet another divergence, short opp. This time matched on the Dax, and tech 100 stocks. Same play as all the rest, go short, take layered profits at support. Reverse and go long if high gets taken out and shows momentum.
Like and follow if you agree and want to see more

ANALISIS DE LA COYUNTURA DE WALL STREETEl mercado desde el punto de vista de elliott, están claras las opciones conviven, opciones alcistas y bajistas, nosotros hemos operado la bajista, pero sabemos que la alcista es posible y el mercado nos dirá si estamos equivocados o acertados, esta es una de las veces que el análisis está mucho más claro que la operatoria.

S&P500 (June 7)The momentum has been very strong to the upside in this index and we could see a slight retrace before targeting all time highs. However we could also see a drop here, because other indices are giving out bearish signs so we have to bear that in mind too.
walmart stock prices analysishello friends !
i came with new analysis about walmart stocks price (WMT) , as you can see the chart of walmart stock prices , the price Couldn't fix the top of the daily channel , but market still is in bullish mode for long term but after the recent growth market need correction , in my new analysis for walmart i found the nearest support level , if the price break any of these support , it will move down toward the next support level , after the correction complete and we could see the sign of reversal , i will update the analysis with showed resistance in the chart .
hope it will be useful for you .
5.31.2020

US30 SUPPLY AND DEMAND ORDER BLOCKS (UPDATE!!) Another 2 zones hit, retest of order block expansion price followed by a smooth move up in price to the next key liquidity line outlined.

They have money to burn - you do NOT!FED-backed pumping or rather re-pumping of the popped bubble, has taken the DJI to unexpected levels. I think they're making the same mistake all over again.
Have a look. No predictions. I don't do predictions. Tough.
Disclaimers : This is not advice or encouragement to trade securities. No predictions and no guarantees supplied or implied. Heavy losses can be expected. Any previous advantageous performance shown in other scenarios, is not indicative of future performance. If you make decisions based on opinion expressed here or on my profile and you lose your money, kindly sue yourself.

USDCAD SELLQuarters analysis, bearish daily triangle pattern. broke through major support. GOING DOWN

US30 SUPPLY AND DEMAND ORDER BLOCKSOur order blocks for the US30 WALL ST Index are working perfectly! Are you short or long?

S&P 500 SHORT 👇🏾💰4 REASONS WHY I HAVE BEEN SHORTING THE S&P 500. PLEASE VIEW VIDEO AND LEAVE YOUR COMMENTS AND LIKES. GOOD DAY MATES!!! ask yourself a few questions. Is this a bullish market ? look around outside first. Who is pushing this market up? The feds and then they will DUMP on your head!!! Lol wear a helmet please.


S&P & DJI Showing Strong P ActionBoth S&P and Dow creeping up to the mid point of their respective inner upward channels and flexing their strength. These markets aren’t out of the woods just yet and with Q2 yet to close out with one more month to go, will we see these markets pop up to the previous highs and safety point or trickle back down like mid Feb/march’s P action. A break of 2723.3 on the S&P and 22931.5 on the DJI I’ll be very bearish, however for the time being strength is being shown.
The following still applies, just updated overview charts:
S&P: If P action closes below the orange line at 2723.3 attention will turn more bearish and watch for market to fall to 2460.2. In this instance will reassess market dynamics as it may bounce in this range or continue to fall
Dow: The same flows for Dow Jones with P action closes below the orange line at 22931.5 attention will turn more bearish and watch for market to fall to 20842.4. In this instance will reassess market dynamics as it may bounce in this range or continue to fall.
