DOW GOING TO 30K OR BACK TO 27K ?US30 price is in a wedge pattern but it's not yet enough conirmation to sell it. So,we will wait for more conformations. Please give a follow to get the updates on time :)
In H4, we will wait for an impulsive move to the downside and trade the pullback.
H4 :
Traders! if you like my ideas and do take the same trade, please write it in comment so we can manage the trade together.
_________________________________________________________________________________________________________________________________________
Disclaimer : The content on this analysis is subject to change at any time without notice, and is provided for the sole purpose of assisting traders to make independent investment decisions.
_________________________________________________________________________________________________________________________________________
Thank you for your support!
Wallstreet

Wall Street CFDSHORT TERM
Best time for BUY.
you have more targets for exit
Before the market holidays

WMT Nasdaq running on steam while fusion is available WMT has been on a parabolic bull run, yet no trend can be observed it seems to be ‘running on steam’ This is supported by the CVI, with less money flowing into the nasdaq composite, hence momentum decreasing. OBV shorts and longs both increasing and volume RSI seemly absent for the past 46 years. The fusion I talk about comes in the form of digital currencies and their ability to alter the industry. Gold can be seen to be steadily increasing which is historically strong within a recession.


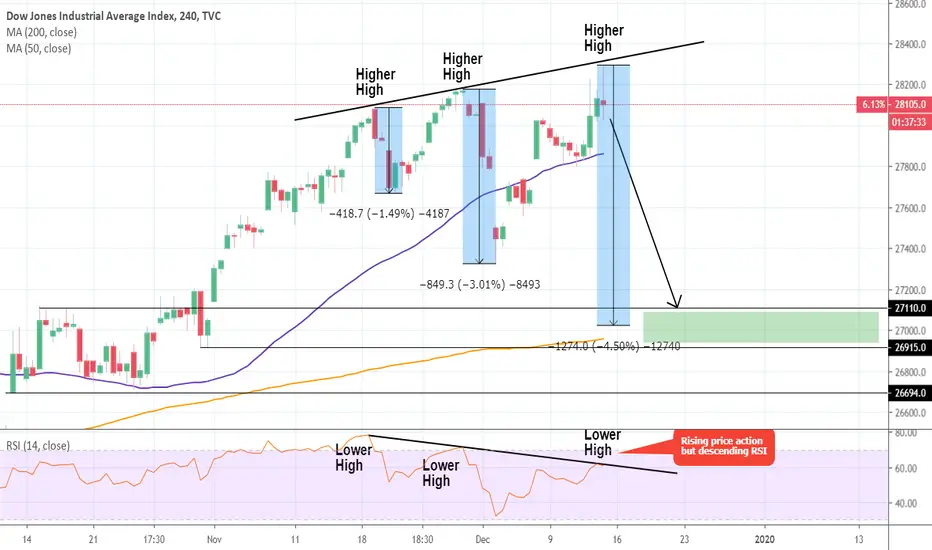
Dow Jones: Update on the short term price action.Following Trump's phase 1 trade deal tweets, DJI rose but the uptrend stopped on the Higher High (bold black) trend line on the 4H chart. With 4H technicals turning neutral (RSI = 56.131, MACD = 85.700, Highs/Lows = 0.0000), this may be an early signal that today's High may deliver a rejection.
How far can that go? The previous two Higher Highs delivered a rejection of -1.50% and -3.00% respectively. The sequence can be either 1.50% lower on every rejection or double the decline of the previous one. Assuming it is the first, more moderate scenario, the potential drop goes as low as the first two symmetrical Support levels: 27,110 and 26,915.
It is important to mention at this point that even though Dow Jones is making Higher Highs on that pattern since November 19th, the RSI sequence on 4H is actually bearish on Lower Highs indicating weakness.
** If you like our free content follow our profile (www.tradingview.com) to get more daily ideas. **
Comments and likes are greatly appreciated.
BLACK FRIDAY REVIEW OF DJI Recorded from my laptop in a lunch break - so turn your speakers right up.
I'm stalking the DJI carefully for any sign action. This is a market built on hope and false confidence. It can't go on forever.
Disclaimer : This is speculative opinion - not advice. If you trade this market and lose your money, kindly sue yourself.

Dow Jones: 4H Death Cross. Potential minor or major pull back.Dow Jones futures have so far failed to recover the 28,200 All Time High and has turned neutral on 1D (ADX = 17.288, CCI = 8.0129, Highs/Lows = 0.0000). On the 4H chart we see a Death Cross formation emerging (MA50 crossing below the MA200). Within the monthly Channel Up we've been trading in for the majority of 2019, every time a 4H Death Cross emerged, the index gave 2 major pull backs (May, August) and 1 minor (October).
Given the fact that the major pull backs took place after tops on the Higher High zone (red color) and DJI marginally touched that region on the 28,200 High, we assume that the current pull back will be a major one (around -7%). The Target Zone on this one is 26,600 - 26,180.
** If you like our free content follow our profile (www.tradingview.com) to get more daily ideas. **
Comments and likes are greatly appreciated.

More room to go for NASQ, will we see 10.000 Points soon?
In my opinion we got a whole lot of space to the upside and the fact that the majority of private investors are planing on a big crash, might take the market even higher.
The analysis on the chart would like to see the price reaching around 10.000 points in 2020. Cheap money will extend the growth.
Just my Opinion so make your own research and never forget to always be prepared for the unpredictable.
May the markets be with you

EURUSD trading levels for next week. Dollar shows strength these days. We are in the lower part of the bollinger bands. The bullish fork has been perfectly respected in recent weeks and the median has been a strong resistance in recent days. it is possible to see a fall to the base of the fork in the coming days, with attention to the static levels 1,099 the lower band of the fork and the lower band of bollinger. This method allowed me to perform all the winning operations this year making a lot of money.

REVIEW: DJI (Wall Street), DAX and nuclear options. I've looked into the DJI and the DAX because they are connected. I also considered events affecting the Hong Kong index. In the text below, I consider China's 'nuclear option'.
Overall I'd say the probability is greater for the south on these indices (from this point in time). But caution - because there is a residual probability for the north and I can't know how far south the markets may go if the markets are with me.
These are very troubled times.
1. The markets are overbought because of QE4.0, lowering of interest rates and high hopes about a China 'Phase one' trade deal.
2. But there is trouble in the Hong Kong Stock market.
3. POTUS signed the Hong Kong Democracy Act which could cause the Chinese to retaliate in some way (nobody knows how).
The 15th of December 2019 is an important date on which $160 Billion of tariffs on imports to the USA, get lumped on China or they are withdrawn. If the tariffs are withdrawn, expect markets to head to the moon (stupidly). If the tariffs are applied, expect a correction of some sort.
Bond troubles
In other trouble China has begun the so called nuclear option of selling off US Treasuries. Note that Treasuries are bonds, which means that money is owed to China by America i.e. they represent a debt owed by the US.
Why would China sell off US Treasuries - which are debts owed to China? Perhaps because China expects the US Dollar to be worth less in times to come. It's like this - if I lend you money fixed in USD value, and then you decide to devalue your US dollar by various means, it means I'm getting back less value. For an exploration of Bonds go here .
China holds about $1.2 Trillion of US debt. A sell off of US Treasuries is said to destabilise financial markets. How - is a separate complex story. The point is that China's retaliation on the Hong Kong Act could be this 'nuclear option'.
The point of all this is that there are complex issues affecting the markets.
Disclaimer: Nothing shared here is investment advice or encouragement to trade in securities. If you lose your money, kindly sue yourself.

Wall Street Surprised by Dollar Tree NewsOn Tuesday, the news thundered, which surprised everyone, who has at least something to do with Wall Street. Dollar Tree stocks are falling.
At the moment, shares have fallen by 13%, which is an unprecedented loss for the company. Forecasts for the near future are the most disappointing. Nevertheless, the level of the falling is kept at the indicated level, which gives hope for an improvement of the situation, but will this hope be justified?
Today you can buy a share of this company for $1.08, which is a very low price. It was expected that in the same period, the value of the share will be at least $1.13. But the forecast wasn’t destined to come true.
An interesting fact is that both company networks (Dollar Tree and Family Dollar) increased sales by as much as 2%. But despite the joyful indicator, the situation is not so unambiguous, because in Family Dollar the margin fell. The products of these networks have some differences. For example, Family Dollar also sells goods at lower prices, which accounts for a significant share of the presented products. But be that as it may, the total net income decreased by 1.7% year on year, which makes us think.
Despite the fact that Dollar Trey isn’t so lucky this period, the revenue amounted to approximately $5.74 billion. At the same time, the expected revenue at better indicators should have amounted to $5.75 billion, which in fact isn’t such a big difference.
Recently, distribution costs have increased. Following the direct, obvious logic, we can understand that it was the increase in transportation prices that caused an increase in prices for goods. For the same reason, sales of goods that have lower margins have increased in order to patch up financial holes in other areas.
There have also been personnel shifts. The staff has been reduced, which isn’t a good sign. The company is forced to take drastic measures to stay in difficult times. However, in order to minimize financial losses and quickly return to the previous level, the company has everything that is needed.
But if we look at the Dollar Tree and its successes over the past year, then we will see that the company is developing quite rapidly. This year its shares rose 24%. There is a pretty good result. But how did they do it? The secret is very simple.
Dollar Tree investors supported all sorts of aggressive steps by the company, in order to maintain and increase the profit of the Family Dollar. Surprisingly, the aggressive strategy worked more than successfully, thanks to which we can observe tremendous growth in the company's shares. Some shops had to be closed, and some were rebranded, which benefited them. How did it happen? It attracted new customers and formed a new circle of interests that led to an increase in profits.
At the end of this quartile, the company has more than 7.800 locations. This number does not allow full rebranding, but the process is already running. The first steps definitely brought excellent results, so the company further plans to adhere to this strategy, hoping for improvements in its own position. And the company has every chance to achieve its goal, despite the recent fall in stocks, which was also caused by the aggressive policy of the company.
Surprisingly, the same strategy, under different circumstances, can lead to different results. It’s important to remember this when working on your own strategy. Nevertheless, it’s very difficult to predict the exact outcome in the modern market with its wars, because sometimes the income depends on factors that can hardly be predicted, so every businessman needs to be extremely vigilant. But all of us know that sometimes it’s impossible.
A quarterly forecast from the company has recently been released. This forecast can be called very optimistic because an increase in the value of the share is expected from $1.70 to $1.80. And yet, Wall Street had expected stock prices to be significantly higher. According to their forecasts, the share price should be $2.02. As it turns out, it will become known very soon, and therefore you just need to be patient and wait for the opportunity, because the current situation was very ambiguous, which means it is too early to draw conclusions.
And yet, in the fourth quarter of this year, an increase in the value of goods sold by $19 million is expected, which equals $0.06 per share.
And yet the main event happened today at 8:46 a.m. at the premarket. It was at this moment that the shares of the company fell by 13%.
Will the company continue to pursue the aggression strategy and will it help overcome difficulties? Will it continue to fall, and can one find profit in this fall? It’ll become obvious for most businessmen very soon. But while all this is only in the process, the most astute take risks and win, while others read about how others have achieved success.

Dow Jones: Sell opportunity. Potential Double Top.DJI has extended the 1W Channel Up (RSI = 65.157, MACD = 519.030, Highs/Lows = 742.8189) that has previously provided a handful of trading opportunities (see bottom of the analysis).
At the moment a Double Top is being formed on 1D, which since April has been a bearish signal, later initiating a decline towards the Higher Low zone (where the 1D MA200 always supported).
We are expecting a similar behavior especially since the current levels are nearly overbought on 1D (RSI = 69.814). Our Target Zone is 27,000 - 26,800.
See the previous successful signals within this pattern below:
** If you like our free content follow our profile (www.tradingview.com) to get more daily ideas. **
Comments and likes are greatly appreciated.

GET READY: DJI correction possibly on 4H time frame.In this screencast I explore the importance of the 4H ATR trend line in association with SqM switches. This is about taking early notice of areas where stuff may happen.
The future hasn't been written as yet, and I don't do predictions. What I see is the chance of a 4H trend weakening, based on the historical a patterns of the DJI.
If the 4H ATR flattens further then there is increasing probability for the south. But what does that mean? Well, it doesn't mean that the whole market will crash. It means that a correction may be coming up.
Note that for any probability estimate in one direction there is a residual probability in the opposite direction.
Disclaimers : This is not encouragement to trade in securities. If you take positions in this market your risks and losses are you own. In simple terms sue yourself if you lose money. Approximately 70% of retail traders consistently lose money in trading.

S&P500 / USD Head and Shoulders Pattern FormingAs well as hundreds of indicators based on historical data leaning highly bearish, strong possibility of a head and shoulders pattern forming on both the 1D and 4H charts. Printing more money can only work for so long, before a correction is inevitable. Bubble could be about to burst.


