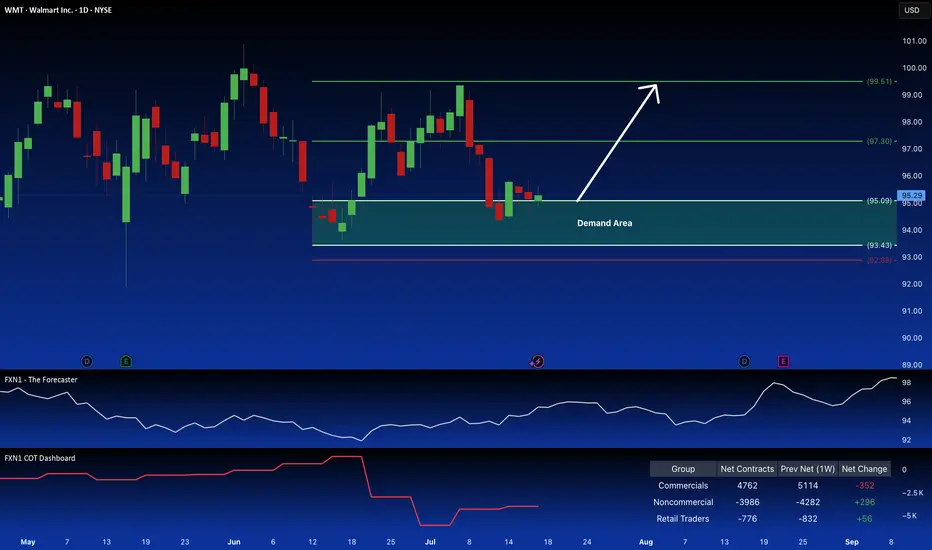
Walmart: Long Position Attractive on Demand ZoneWalmart Inc. presents a compelling long opportunity. The price action is reclaiming a key demand zone, suggesting a continuation of the current uptrend, a pattern reinforced by seasonal factors. Further bolstering the bullish case is the observed increase in large speculator positions.
✅ Please share your thoughts about WMT in the comments section below and HIT LIKE if you appreciate my analysis. Don't forget to FOLLOW ME; you will help us a lot with this small contribution.
Walmart
WALMART testing its 1D MA50! Will it bounce?Walmart (WMT) hit yesterday its 1D MA50 (blue trend-line) for the first time since April 21. It appears that the rebound from the Trade War Low has turned sideways on a Double Top formation and the 1D MA50 is the first Support to be tested, with the 1D MA200 (orange trend-line) following.
This pattern resembles the August - September 2022 Bull Flag, which despite breaking below its 1D MA50, it resumed the uptrend shortly after and hit the 1.382 Fibonacci extension before the next 1D MA50 pull-back.
As a result, we expect the stock to reach $110.00 (Fib 1.382) by the end of the Summer.
-------------------------------------------------------------------------------
** Please LIKE 👍, FOLLOW ✅, SHARE 🙌 and COMMENT ✍ if you enjoy this idea! Also share your ideas and charts in the comments section below! This is best way to keep it relevant, support us, keep the content here free and allow the idea to reach as many people as possible. **
-------------------------------------------------------------------------------
💸💸💸💸💸💸
👇 👇 👇 👇 👇 👇

WMT: Walmart stock under pressure from tariffs.
It seems that Trump's tariffs are not very favorable for Walmart’s long-term outlook.
However, from a technical perspective, the stock is currently in a good position, and its short-term EPS forecasts are improving day by day.
I don’t recommend buying Walmart for the long term, but there might be a good buying opportunity next week.

Walmart Head & Shoulders on Daily and Weekly chartWalmart (WMT) may be forming, or already has formed, a bearish Head & Shoulders pattern.
#WMT #Walmart #bearish #short #headandshoulders #retail #discountstore

Analysing the Spike in Volatility on the Walmart (WMT) ChartAnalysing the Spike in Volatility on the Walmart (WMT) Share Price Chart
On Thursday, the US retail giant reported its quarterly results — which turned out to be broadly better than expected. While total revenue was roughly in line with analysts’ forecasts, earnings per share came in higher at $0.61 versus the expected $0.57.
At the same time, Walmart CEO Doug McMillon stated on Thursday:
"We will do everything we can to keep our prices as low as possible. But given the scale of the tariffs, even at reduced levels, we won't be able to absorb all the pressure, considering the reality of tight retail margins."
This statement may have raised concerns among market participants about the company’s future earnings, contributing to Friday’s drop in the share price to $92.
It also drew the attention of the US President. On Saturday, Donald Trump said that Walmart (WMT) should “swallow the tariffs” instead of blaming them and raising prices.
In response, Walmart reiterated that it will keep prices as low as possible for as long as it can — which has always been the company’s approach.
Technical Analysis of the WMT Stock Price Chart
Looking at the broader market context, we can see that price fluctuations formed a narrowing triangle in late April — a sign that buyers and sellers had reached some agreement around a fair value of approximately $95.50.
In early May, sentiment shifted in favour of the bulls, with this level acting as support (marked by an arrow).
The earnings release triggered a spike in volatility — the ATR indicator is now at a one-month high. The Walmart stock price extremes seen at the end of last week suggest two key levels, roughly equidistant from the $95.50 axis:
→ resistance around $99 (reinforced by the psychological level of $100);
→ support around $92.
Given the above, it is reasonable to suggest that once the market has digested the news, price movements may calm down again. In that case, we may well see another narrowing triangle form on the WMT chart — slightly above the previous one.
This article represents the opinion of the Companies operating under the FXOpen brand only. It is not to be construed as an offer, solicitation, or recommendation with respect to products and services provided by the Companies operating under the FXOpen brand, nor is it to be considered financial advice.

Quantum's Walmart (WMT) Trading Guide 4/28/25WMT’s weekly outlook balances its defensive resilience against macroeconomic headwinds, with a comprehensive synthesis of technical, market, and strategic factors guiding its trajectory for weekly options contracts. The FAME framework underscores WMT’s long-term bullish potential, driven by robust fundamentals (+5% revenue, $0.58 EPS, 21% e-commerce growth) and adaptability (AI, Walmart+), positioning it as a resilient player in a risk-off regime. However, elevated yields (10-year 4.255%, 20-year 4.738%, 30-year 4.721%) and a stable DXY at 99.58 amplify tariff pressures and margin concerns, capping upside and reinforcing a cautious stance. A tactical long bias is favored for weekly contracts, targeting a bounce from $94.36 to $96.47–$98.50, with a short stance viable below $88.50 if support fails.
Technical implications highlight bullish momentum on daily (RSI ~40, Stochastic ~28) and weekly (RSI ~44, Stochastic ~32) timeframes, with oversold conditions signaling a rebound potential for weekly contracts if $94.36 holds. Monthly neutral momentum (RSI ~50) suggests consolidation, requiring a breakout above $96.47 to confirm bullish strength. This supports a short-term bounce but advises monitoring for sustained moves.
Market influence implications reflect a risk-off environment, with high yields and a stable DXY increasing import costs, particularly amid tariff uncertainty from WMT’s upcoming Trump meeting. The VIX at 24.84 amplifies volatility, favoring WMT’s defensive appeal but heightening risks. WMT’s Q3 FY25 strength and e-commerce growth provide stability, supporting resilience near $94.36.
OFD summary and implications reveal bearish pressure from Vanna (-$0.04), Charm (-$0.02), and DEX (-$0.06), driven by put-heavy flow and hedging demand tied to tariff fears. However, GEX (+$0.08) at the $95 strike pins price, stabilizing volatility and supporting a neutral-to-bullish bounce for weekly contracts if $94.36 holds, aligning with oversold technicals.
Edge insights bolster the case for a bounce, with institutional buying at $94–$95 signaling accumulation, defensive retail sector strength outperforming cyclicals, and low short interest (1.4%) offering squeeze potential above $96.47. These factors enhance confidence in a tactical long bias for weekly contracts, provided support holds.
Strategic outlook implications emphasize consolidation near $95.09, with $94.36 as a critical pivot. A break below risks $88.50, driven by tariff fears and bearish options flow, while a move above $96.47 targets $98.50, fueled by oversold signals and institutional support. The VIX at 24.84 and put-heavy options flow underscore volatility, but WMT’s defensive positioning mitigates downside, favoring a bounce in a risk-off regime.
In summary, WMT’s weekly outlook hinges on defending $94.36, with oversold technicals, GEX pinning, and institutional buying supporting a bounce to $96.47–$98.50 for weekly contracts. Tariff risks, high yields, and DXY stability maintain a risk-off backdrop, capping upside and requiring vigilance for a break below support, which could shift bias to bearish. This balanced approach leverages WMT’s defensive strengths while navigating weekly volatility, aligning with Buffett’s preference for resilient businesses with tactical opportunities.

Walmart (WMT) shares reach highest level since early MarchWalmart (WMT) shares reach highest level since early March
As shown on the chart of Walmart (WMT) shares, trading closed yesterday above the $94 mark – a level not seen since the beginning of March. This means that since the start of 2025, Walmart’s share price has risen by approximately 5.5%.
This positive trend stands in stark contrast to the S&P 500 index (US SPX 500 mini on FXOpen), which has declined by more than 8% over the same period.
Why are Walmart (WMT) shares outperforming the index?
Apparently, from the market’s point of view, this is due to the fact that Walmart’s supermarkets are a source of essential goods for Americans, giving the company an advantage in a scenario where the US economy may slide into recession.
According to Mizuho Bank analyst David Bellinger, Walmart is a sensible choice for investors trying to stay afloat in a volatile market. He forecasts that WMT’s share price could rise to $105 – around 15% higher than its current level.
Bellinger notes that Walmart continues to attract price-conscious shoppers and has made significant progress in e-commerce, helping the company remain resilient even amid the prospect of economic slowdown.
Technical analysis of Walmart (WMT) shares
The chart shows that the share price is moving within a long-term upward trend. The black dashed line, which had acted as support for many months, has been broken:
- This suggests that the line may now act as a median.
- Allowed us to widen the channel and find its lower boundary, which is expected to offer support.
Indeed, the lower boundary of the expanded channel provided support in the first half of April, with particular attention drawn to the large bullish candlestick on 9 April (marked with an arrow). According to the NYSE, over 46 million shares were traded on that day – more than twice the average volume. This highlights the strength of demand.
It is possible that WMT shares may continue to outperform the index going forward, forming fluctuations while:
- receiving support from the psychological $90 level (previously a resistance point);
- gradually approaching the median of the aforementioned channel.
This article represents the opinion of the Companies operating under the FXOpen brand only. It is not to be construed as an offer, solicitation, or recommendation with respect to products and services provided by the Companies operating under the FXOpen brand, nor is it to be considered financial advice.

Walmart Holds Strong and Ends the Week Up More Than 15%Shares of retail giant Walmart have risen more than 15% over the past five trading sessions, despite growing tensions over reciprocal tariffs between China and the United States. The bullish bias has remained intact, primarily because the company stated this week that it is prepared for scenarios with tariffs of up to 125% on Chinese imports and is currently negotiating with suppliers to secure better pricing in the coming weeks. This has helped preserve investor confidence and positioned Walmart as one of the few stocks that has withstood the volatility of the renewed trade war.
Building Bullish Momentum
This week’s price action showed a sustained upward bias, suggesting the beginning of a new short-term bullish trend. However, Walmart's stock still faces resistance from a key Fibonacci retracement level, which it must overcome to confirm a strong buying momentum and possibly maintain a bullish trend in the coming weeks.
MACD Indicator
The MACD currently favors the bulls, as the histogram has expanded significantly, reinforcing the upward momentum above the zero line in the short term. As long as no divergence emerges between price action and the MACD, there’s little room for meaningful selling corrections in the immediate sessions.
ADX Indicator
The ADX line is beginning to show some indecision, as it gradually descends toward the neutral 20 level, just as the price approaches key resistance zones. If this downward trend continues, the market could shift into a more neutral phase. However, for now, the indicator still supports the idea that the recent upward moves reflect a solid directional bias.
Key Levels to Watch:
$95: Likely the most important nearby resistance, aligning with the 61.8% Fibonacci retracement level. A decisive move above this area could open the door to a stronger bullish phase.
$104: A long-term resistance, representing the recent highs reached in the past few months. A return to this level could revive the broader bullish trend that had been dominant in the past months.
$85: A key support level, aligned with the 200-period moving average. If price retraces back to this level, it could reactivate the bearish bias seen in previous weeks.
By Julian Pineda, CFA – Market Analyst

Walmart Withdraws Earnings Guidance Amid Tariff UncertaintyWalmart (NYSE: NYSE:WMT ) has withdrawn its operating profit forecast for the current quarter. The company cited tariff-related uncertainties as the reason. Rising import duties from countries like China and Vietnam have impacted cost structures. Walmart aims to keep pricing flexible to protect margins.
Despite the near-term challenges, Walmart reaffirmed its full-year guidance. The retailer expects net sales to grow between 3% and 4%. It also sees adjusted operating profit growth between 3.5% and 5.5% for the year.
Walmart highlighted additional concerns, including insurance-related costs and shifts in consumer behavior. Shoppers are spending more on low-margin essentials due to inflation. This change in product mix has also pressured the company’s margins.
CEO Doug McMillon said Walmart will continue focusing on pricing discipline, inventory efficiency, and expense control. He admitted that the current environment remains unpredictable. However, the company will stick to its long-term strategy.
Technical Analysis
Walmart’s stock is currently trading at $90.46, up 10.53%, with a high of $90.80. The price has bounced from a strong support zone near $82, forming a bullish momentum candle. NYSE:WMT is now testing a resistance area at $89, previously a demand zone.
A successful break and retest could lead to a rally toward the $105.30 previous high. However, rejection at this level could see the price fall back to the $82 support. But with the recent bullish momentum, a breakout at $89 is possible.

WALMART: Recovery will take time but it's worth the investment.Walmart is headed to an oversold condition on its 1D technical outlook (RSI = 36.324, MACD = -2.580, ADX = 37.504) but remains marginally neutral on 1W (RSI = 45.418). Based on its 13 year Channel Up and the 1W RSI pattern, it got rejected on its top but this 2 month decline is a usual correction inside this Channel. In fact we do expect the 1W MA50 to break but most likely the trend will find support on the Channel's middle trendline and start to gradually recover in 2026. The recovery process will be long but the prices are already to low and oversold, still one can wait for the 1W MA50 to break in order to confirm that, and buy for the long term. After all, the stock gained more than +160% in less than 3 years and an investment on the world's biggest groceries company with such amazing return, is a worthwhile one. Our target is $140 by the end of 2027/early 2028.
See how our prior idea has worked out:
## If you like our free content follow our profile to get more daily ideas. ##
## Comments and likes are greatly appreciated. ##

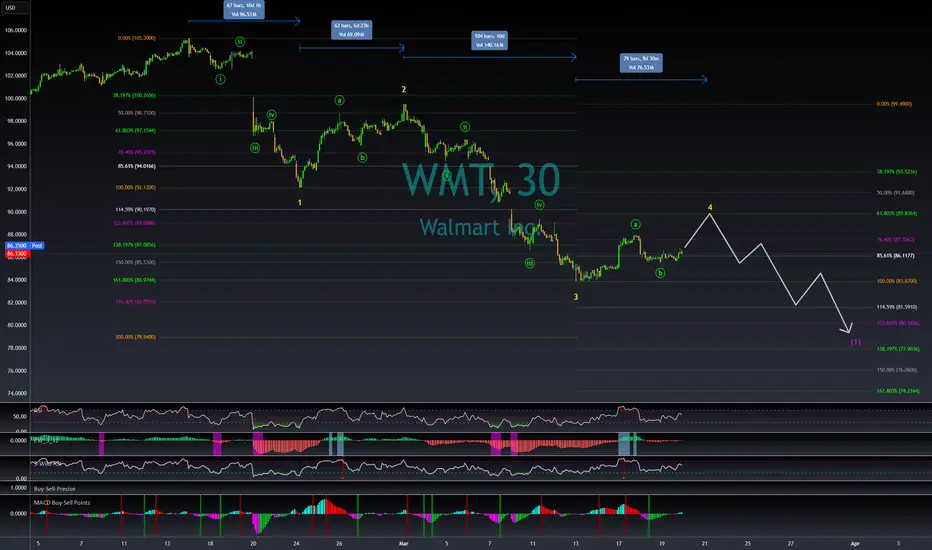
WMT ready to resume drop?My overall thesis is we are in the very early stages of a multi-year decline ultimately with the S&P 500 below 3500. I have been wrong many times before so I will just take this thing in stages and see if it plays out. After this massive decline, we should be in for a great market rally of many decades. I am expecting the market to end its recent rally this week. The current rarely would be about a week in length depending when it began for individual stocks. The rally has done a few important things with its slow and prolonged upward movement, mainly prevents a wave 3 signal from occurring during the next decline.
My wave 3 indicator tends to signal wave 3s and 3 of 3s. See my scripts for the specifics of the indicator. If the market had a short wave 4 up and then a sharp or prolonged drop during wave 5, a new wave 3 signal would occur which violates the currently placed Minor wave 3 (yellow 3). Allowing separation from the current wave 3 signal enables wave 5 to drop quick or slow.
This chart applies select movement extensions based on wave 1's movement on the left and then another based on wave 3's movement on the right. I keep the values between 0%-100% on the chart for wave 2s and 4s retracements of the preceding wave's movement for reference even though the retracement values would be inverted.
Specifically for WMT, Minor wave 3 was longer than wave 1, which does not place a maximum length on wave 5. Assuming wave 4 ends on Thursday or Friday, Minor wave 5 could be a week or longer. In that time, at the very least it should drop below wave 3's bottom of 83.87. Using some basic movement extensions, it will likely go lower. The 5 wave lower pattern for this fifth wave is hypothetical, but a bottom could occur between 74-79. Once we bottom, we should see another rally over a few weeks. I will forecast what that could look like as Intermediate wave 1 nears its end.
WMT Walmart: Has an Important Top Formed?The price may have formed a major top in Circle Wave 3 in the white scenario, which suggests a potential move toward the $20 area as part of a larger Circle Wave 4. For now, the assumption is that a substantial top has been struck, but whether this marks the end of Wave 3 (yellow scenario) or a broader corrective phase remains to be seen.
Key Levels and Scenarios:
In the yellow scenario, the market should be moving toward the support area between $45.60 and $62.87. A strong, impulsive rally from this zone could indicate one final Wave 5 push higher before a major third-wave top is confirmed.
In the white scenario, if the rally from support turns out to be corrective, it may just be forming a white B wave, reinforcing the outlook for lower prices in a prolonged correction.
Current Focus:
The market is currently moving downward in Circle Wave A toward the orange support area.
Since A waves can unfold in either three or five waves, it is important to monitor whether this decline remains impulsive or corrective.
As long as the price remains below the March high (~$105 on smaller time frames), the focus remains on lower prices.
For now, the priority is to closely observe the microstructure as the move down develops, to determine whether the yellow or white scenario plays out.

Walmart on Major SupportWalmart is quite a bit above it's last solid trend line. That suggests it could range out on this support for a while before it does another big move again. But it could also keep on the current trend and run to $145. Either way owning the stock here seems like a good idea.
Good luck!

Walmart (WMT) Stock Drops Over 6%Walmart (WMT) Stock Drops Over 6%
As shown in the Walmart (WMT) stock chart, trading on 20th February closed at $97.26, whereas the previous day, the stock was trading around $103. The decline of over 6% marks the largest drop in Walmart (WMT) stock price in 15 months.
Why Did Walmart (WMT) Stock Drop?
The bearish momentum emerged after Walmart’s earnings report, which was actually quite strong, as:
→ Sales growth reached 5.2%;
→ The company exceeded analysts' expectations (earnings per share were 2% higher than forecasts);
→ Walmart announced a 13% dividend increase.
However, WMT stock fell because the retail giant released a profit forecast for 2025 that came in below market expectations. This was attributed to uncertain consumer behaviour and geopolitical conditions. Additionally, investors may have been dissatisfied with increased executive compensation.
Walmart (WMT) Stock Technical Analysis
The chart shows that after the decline, the price is consolidating near support levels formed by:
→ The lower boundary of the ascending channel;
→ Former resistance around $96.
The situation resembles November 2023, when the market also reacted negatively to an earnings report. However, WMT stock later recovered, and a similar scenario could unfold in 2025.
Analytical Walmart (WMT) Stock Price Forecasts
Analysts remain optimistic. According to Yahoo Finance:
→ The average 12-month price target for WMT is $107.25;
→ Of the 42 analysts surveyed, 38 recommend buying WMT stock.
Trade on TradingView with FXOpen. Consider opening an account and access over 700 markets with tight spreads from 0.0 pips and low commissions from $1.50 per lot.
This article represents the opinion of the Companies operating under the FXOpen brand only. It is not to be construed as an offer, solicitation, or recommendation with respect to products and services provided by the Companies operating under the FXOpen brand, nor is it to be considered financial advice.

Breaking: Walmart Set To Report Earnings Before the BellWalmart will report fiscal fourth-quarter earnings before the bell on Thursday.
Walmart (NYSE: NYSE:WMT ) will report its latest quarterly earnings before the bell on Thursday, as investors try to parse whether softer retail sales in January were a blip or a bigger warning sign.
As Walmart (NYSE: NYSE:WMT ) is the top grocer in the U.S., investors often view it as a pivot of consumer health. The company will report its holiday-season results and is expected to give a forecast for the year ahead. Its leaders may also preview how they see the economic backdrop in the U.S. and weigh in on the potential effect of federal policy decisions, such as tariffs.
According to a survey of analysts by LSEG, here’s what Wall Street expects for the big-box retailer’s fiscal fourth quarter,:
Earnings per share: 64 cents
Revenue: $180.01 billion
Retail sales for January came in weaker than expected, setting off alarm bells for some investors. The metric dropped 0.9% for the month, which was below the Dow Jones estimate for a 0.2% decline.
Holiday data came in strong across the retail industry, as sales rose 3.8% year over year to total $964.4 billion in November and December, according to the National Retail Federation. The trend reflected a return to more typical pre-pandemic gains. Average sales growth during the holiday season was 3.6% from 2010 to 2019, according to NRF data, but shot up during the Covid-19 pandemic.
Some unique factors could work in Walmart’s favor, regardless of the economic backdrop. The big-box retailer’s online sales have been climbing, with 10 straight quarters of double-digit gains. Its advertising business and third-party marketplace are small compared to Amazon’s, but the segments have posted gains and driven higher margins than Walmart’s retail business.
Furthermore, Walmart has attracted more customers with higher incomes. Walmart CEO Doug McMillon said in November that households earning more than $100,000 drove 75% of market share gains in the third quarter.
Simeon Gutman, a retail analyst for Morgan Stanley, raised Walmart’s price target to $153 on Tuesday, pointing to the retailer’s newer and more profitable moneymakers including its advertising business and subscription-based membership program Walmart+.
Technical Outlook
As of Wednesday’s close, shares of Walmart are up about 83% over the past year. Shares closed on Wednesday at $104.00, up about 15% so far this year and outpacing the approximately 4% gains of the S&P 500 during the same period.
As of the time of writing, NYSE:WMT is trading down 0.54% on Thursday's premarket trading. NYSE:WMT ' shares has an RSI of 70 which is somewhat oversold but it hints at a potential bullish surge amidst a falling wedge pattern and as traders awaits earnings reports, a positive earnings beat could send NYSE:WMT on a bullish spree similarly, should selling pressure surmount, the 38.2% Fibonacci retracement level is serving as support point for Walmart shares (NYSE: NYSE:WMT )

WMT Walmart Options Ahead of EarningsIf you haven`t bought WMT before the previous earnings:
Now analyzing the options chain and the chart patterns of WMT Walmart prior to the earnings report this week,
I would consider purchasing the 110usd strike price Calls with
an expiration date of 2025-4-17,
for a premium of approximately $2.33.
If these options prove to be profitable prior to the earnings release, I would sell at least half of them.

Bonus Analysis: 80 Stocks Reviewed, 15 Stand Out!Hello readers!
First things first – if you find value in these analyses, don’t hesitate to hit the Boost/Like button! 🚀 Your support helps keep these ideas coming and is greatly appreciated. Thanks a lot!
As an extra bonus for everyone who participated in the survey, I decided to go through all the mentioned stocks—a total of 80 different names—and pick out the ones that stood out to me from a technical perspective. Made just a brief overview.
Previously, I covered the top 15 most mentioned stocks, but now it's time to highlight 15 additional setups that caught my eye with very short descriptions. These are purely technical insights—no fundamental analysis here.
To be said, many of the stocks mentioned were at all-time lows, which means technical analysis isn’t much help. If a stock is sitting at the bottom with no structure, you’re relying purely on fundamentals to make a decision.
With that said, let’s take a look at the charts that stood out.
1. Oklo (OKLO) – Nuclear Energy
Strong momentum, but for me, the most important area is $20 to $30.
2. Tecnoglass (TGLS) – Glass and Window Manufacturing
Steady higher highs - The strongest zone sits between $50 to $60.
3. MicroStrategy (MSTR) – Software and Bitcoin Holdings
Extremely volatile but key interest zones for me are $170 to $240, with $200 as a strong mid-point.
4. Everest Group (EG) – Reinsurance and Risk Management
$250 to $280 was a strong resistance, now acting as support. Trendline retest and third-touch scenario align well with the $230 to $280 range.
5. H. Lundbeck (HLUN_B) – Pharmaceuticals
Resistance turned support has already played out but still, there might be some volatility, and $35 to $40 DKK remains the strongest zone.
6. Alpha Group International (ALPH) – Financial Services
Breakout and retest already worked well, so waiting for slightly better prices might be the best move but it is valid.
-------
I’ve picked out the first six stocks from the survey and shared my technical insights here on TradingView but this is just the beginning.
9 stocks in Substack with some bigger names like Alibaba (BABA), Starbucks (SBUX), Snowflake (SNOW), Uber (UNER), and Netflix (NFLX) have also caught my eye, and I’ll be covering them on my Substack along with more technical breakdowns.
Substack-ENG link is in my BIO (clicking the website icon), or you can find it by scrolling up - just below the main image.
See you there,
Vaido

100% Gains in Walmart! What’s Next at This Key Level?Hello readers,
Back in July 2023, I pointed out a major breakout in Walmart (WMT) after years of struggle around the $150-$154 zone. Fast forward, and here we are – Walmart has doubled in price! 📈
Of course, this isn't the raw $300 we might expect because of the 3-for-1 stock split, but the percentage gain remains a solid 100%+ from our entry.
What Now?
$100 is a round number, and historically, NYSE:WMT has reacted to these psychological levels. The market has started to range in these level, suggesting some hesitation.
Taking partial or full profits could be a smart move – but as always, the choice is yours!
This is just a reminder and a heads-up to stay aware of price action. Trade smart! 💡
Let me know your thoughts – are you holding or booking profits?
Cheers,
Vaido

WALMART Bullish Leg of Channel Up on full extent.Walmart (WMT) has been trading within a Channel Up since January 2024 and is being supported by the 1D MA50 (blue trend-line) since August 14. The last contact with the 1D MA50 has been on January 16 and is what started the current Bullish Leg.
The standard %rise within this pattern has been +21.86% and as a result our short-term Target is $108.00.
-------------------------------------------------------------------------------
** Please LIKE 👍, FOLLOW ✅, SHARE 🙌 and COMMENT ✍ if you enjoy this idea! Also share your ideas and charts in the comments section below! This is best way to keep it relevant, support us, keep the content here free and allow the idea to reach as many people as possible. **
-------------------------------------------------------------------------------
💸💸💸💸💸💸
👇 👇 👇 👇 👇 👇

WMT Showing Bullish Momentum – Move Toward $99.00 ExpectedNYSE:WMT is demonstrating strong bullish momentum, driven by consistent price strength and support from key moving averages. The recent price action confirms buyers' dominance, with a clear uptrend evident on the chart. The stock has advanced steadily, breaking out of prior consolidation zones, and is now poised to target the $99.00 level, which serves as the next significant milestone.
This setup aligns with the expectation of a bullish continuation, offering a potential long opportunity if pullbacks or consolidations occur near current levels.
If you agree with this analysis or have additional insights, feel free to share your thoughts here!

Walmart Hits All-Time High, Goldman Sachs Adjusts Price Target.!Walmart has recently surpassed its historical peak of $96 per share, indicating strong momentum in its stock performance. In a recent analysis, Goldman Sachs has revised its price target for Walmart, increasing it from $93 to $101 while sustaining a 'buy' rating. This upward adjustment reflects the firm's confidence in the company's growth potential and market position. Given this context, investors might consider waiting for a potential retest of the $96 support level before committing to a long position, as this could provide a more favorable entry point and reduce the risk of buying at a peak.

WALMART: The first buy opportunity of 2025 is here.Walmart has turned neutral on its 1D technical outlook (RSI = 52.502, MACD = 0.350, ADX = 31.554) as it is trading sideways on top of the 1D MA50. This is a strong support level that has been unbroken since August 14th 2024 but the sideways trending 1D RSI resembles all times since September 2022 that it crossed under it and then rallied. Consequently this is already a strong buy signal, regardless of whether the price breaks the 1D MA50 or not as, at worst it is expected to trade sideways for another 1-2 weeks and then rebound. We aim for a +22% price increase (TP = 108.00) like the last two bullish waves delivered.
## If you like our free content follow our profile to get more daily ideas. ##
## Comments and likes are greatly appreciated. ##

Walmart : First bullish signal! Possible END of the retracement!Walmart (officially WalMart, Inc.), the multinational retail corporation based in the United States, has an impeccable technical outlook, as we recalled in a previous post.
Its trend is clearly bullish (Bull), but on December 9th (red vertical line), it began a retracement phase due to the significant accumulated increase it had experienced. The price has retraced to the first key zone of 89-90 (23.6% Fibonacci) and, for now, has respected it. If it breaks below that zone, the price could fall to around 85 (38.2% Fibonacci).
On January 6th, the FIRST bullish (Bull) signal appeared on the chart, and the price closed yesterday in an important zone, which, if surpassed, could mark the end of the correction and the beginning of a new bullish impulse toward NEW HIGHS. We need to be attentive because a H4 candle close above 92 would give us a clear signal to enter long (Bull).
---------------------------------------------------------------------------
Strategy to follow:
ENTRY: We will open 2 long positions if the H4 candle closes above 92.
POSITION 1 (TP1): We close the first position at the highs zone of 95.8 (+4.2%).
--> Stop Loss at 88.5 (-3.5%).
POSITION 2 (TP2): We open a Trailing Stop position.
--> Initial dynamic Stop Loss at (-3.5%) (matching the 88.5 of position 1).
--> We adjust the dynamic Stop Loss to (-1%) when the price reaches TP1 (95.8).
SETUP CLARIFICATIONS
*** How to determine which 2 long positions to open? Let’s take an example: If we want to invest 2,000 euros in the stock, we divide that amount by 2, and instead of opening 1 position of 2,000, we will open 2 positions of 1,000 each.
*** What is a Trailing Stop? A Trailing Stop allows a trade to continue gaining value when the market price moves in a favorable direction but automatically closes the trade if the market price suddenly moves in an unfavorable direction by a determined distance. That determined distance is the dynamic Stop Loss.
--> Example: If the dynamic Stop Loss is at -1%, it means that if the price drops by -1%, the position will be closed. If the price rises, the Stop Loss also rises to maintain that -1% during the increases, thus reducing the risk until the position becomes profitable. This way, one can take advantage of very strong and stable price trends, maximizing profits.
