Walmart

WalmartStock Symbol: WMT
Out of all the blue chips, walmart looks the strongest.
Good old Wally world holding up like a champion.
Diversify and use 5% stoploss
----------------------------------------------------
We just realesed our new course! Follow our tradingview page and visit the link in our bio if you are looking for new strategy to add to your arsenal.
Use Promo Code: FIRST100 to receive $50 off of your course!
First come, first serve / Code valid for first 100 buyers. Normal price $99
---------------------------------------------------
Thank you for your continued support, God bless you though these times.
- Major League Trader

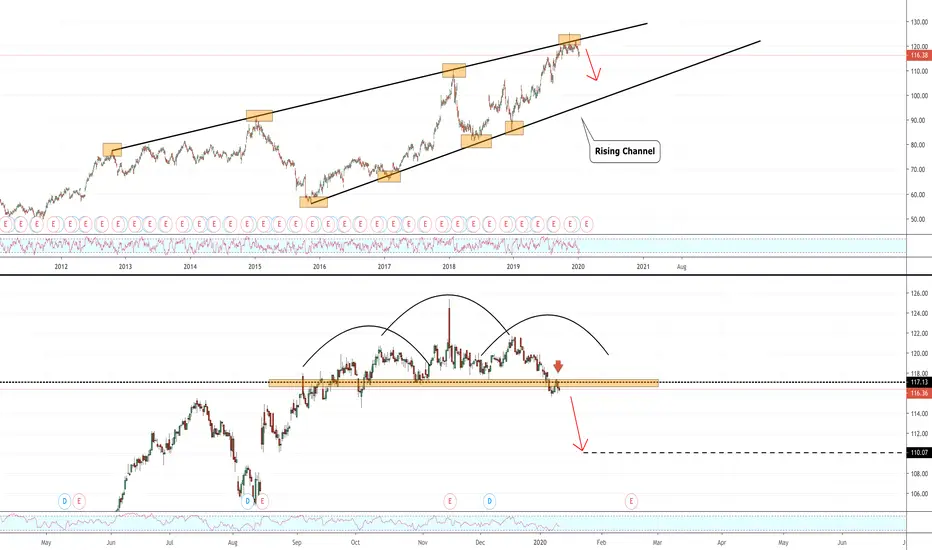
Walmart approaching neckline Walmart has been trading within it's ascending channel since the start of 2019, obviously throwing around corona volatility since the start of this year. We are now approaching a potential neckline region and tap of the lower channel before recovering slightly into a right shoulder. Profit taking between 118. - 120.


%TGT I H&S AND CHANNEL Historically, the $TGT stock has been in this channel for quite some time. (white for dummies) When it broke out of this channel, it reached an all time high. Then we can clearly see a nice inverse head and shoulders. Next target would be $64 if falls back in here.

Walmart to 163.55$ | Is Corona Virus Good For Walmart?Thanks for watching. Please support my work by sharing this video with other investors and traders.
Don't forget to smash that like button here and drop a follow.
See you guys tomorrow.
Take it easy.
~Bo

WALMART INC. (WMT) DailyDates in the future with the highest probability for price direction reversals

A most interesting chart - rising on defense or return to 100?Walmart is supposed to be a defensive stock to buy when the market drops, but the charts show that price may head lower.
Reasons for weekly 115 puts (higher risk) or swing trade 110 puts (lower risk):
> In candle chart, green rectangle, you see a very bullish pattern between 2/27-3/2, and also a bullish engulfing candle on 3/6. However the volume directional moving index is low, suggesting this could be a rubberband effect that will not last.
> Chart shows daily resistance line, dotted red
> Between 2/21-2/25 (3 days), stochastic %K dropped from over 80 to under 20. The ensuing drop and quick rebound might give way to more downside --> look for RSI on daily to head back below 50.
> Simple moving averages are in descending order: 10<20<50<100. one caution, 20sma is flat.
> On weekly chart - 10sma is below 20sma and stochastic %D is below RSI. Price is testing 20sma.
You can watch 30m timeframe for more signals to open puts, such as RSI moving lower and 10sma crossing below 20sma. On daily watch for the same, and for resistance line to hold.

Here is a buy setup in Walmart $WMTCurrently, we are above all moving averages and breaking out of the downtrend channel.
Technical indicators are showing more upside to go.
I would go long.


Looking good for a possible longBouncing off the trend-line with strong bullish candle(s). Possible long!

Walmart: Buy OpportunityThe price bounced from the uptrend line and moved upward. RSI confirmed the price reversal. MACD histogram confirms a possible upward movement. The price could break the local downtrend line. It gave us a bullish signal in the direction of the main uptrend.
Entry Price: above 116.80
Stop Level: below 114.15
Profit Level: at 121.95
Disclaimer!
This post does not provide financial advice. It is for educational purposes only! You can use the information from the post to make your own trading plan for the market. But you must do your own research and use it as the priority. Trading is risky, and it is not suitable for everyone. Only you can be responsible for your trading.

WALMART (WMT): Expecting Bearish Impulse
Walmart has recently reached a resistance line of a rising channel on a daily.
on 4H the market has formed a head and shoulders and broken below the neckline.
I believe that now we can expect bearish continuation.
initial target level is 110.0
second target is 104.0
WMT Walmart Distribution Sell SignalWalmart is a strong stock that has painted fresh ATH's in the past couple weeks. However, this recent price action has shown considerable weakness: lowered volume, bearish RSI divergences, and an inability to strongly breakout much higher. It seems to be sputtering and in danger of turning over in a rounded top fashion. Candlesticks and wicks on the daily, weekly, and monthly bars look like we're at a top.

WMT Nasdaq running on steam while fusion is available WMT has been on a parabolic bull run, yet no trend can be observed it seems to be ‘running on steam’ This is supported by the CVI, with less money flowing into the nasdaq composite, hence momentum decreasing. OBV shorts and longs both increasing and volume RSI seemly absent for the past 46 years. The fusion I talk about comes in the form of digital currencies and their ability to alter the industry. Gold can be seen to be steadily increasing which is historically strong within a recession.

WMT Correction Inevitable before another leg up?Based on the divergence and slamming into a cluster of important fibonacci levels, I think a ≈5% correction is in the works. Looking for shorts at these levels and will look for longs in the boxed in area accompanied by other "buy signals".

WALMART - DAILY CHARTHi, today we are going to talk about the Walmart and its current landscape.
Walmart yesterday disclosed better than expected earnings, a delightful surprise for investors that were worried by the impact of the Trade War tariffs over the retail corporation. Walmart also raised its EPS guidance forecasted for the next year. The news is positive for the American retail sector and as an economic indicator of the U.S consumer potential, which signals a healthy environment for the economy that nears the consuming holidays like the Black Friday, Cyber Monday, and the Thanksgiving Day. Even the U.S President has cheered the good earnings.
"Walmart announces great numbers. No impact from Tariffs (which are contributing $Billions to our Treasury). Inflation low (do you hear that Powell?)!" - Donald J. Trump
Thank you for reading and leave your comments if you like.
To have access to our exclusive contents, join the Traders Heaven today! Link Below.
Disclaimer: All content of Golden Dragon has only educational and informational purposes, and never should be used or take it as financial advice.

WMT - BullishNYSE:WMT We can see 130+ by the end of the year or the beginning of 2020. (Based on my opinion could be right or wrong , it's your responsibility ).

WMT will break to resistance level; hit new holiday highs!!Looking like Walmart is going to break down to the second resistance into earnings then if it can support at those levels will likely get squeezed to new highs heading into the holiday season.

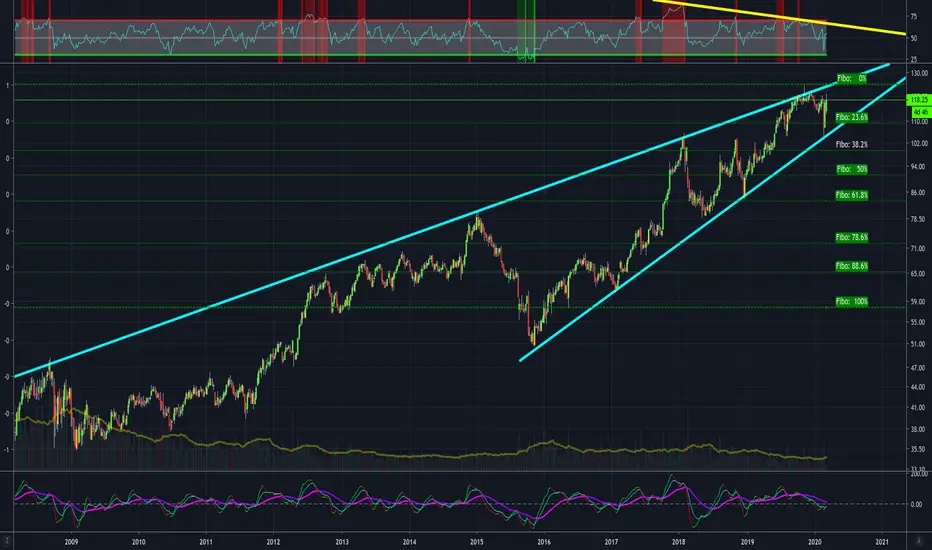
Walmart - Overbought & Rising Wedge PatternRising wedge pattern with RSI bearish divergence & overbought stochastic. A breakdown in price can lead to a $115 price target which is a nice support level & 100% Fibonacci level.

WALMART WEEKLY CHART SHORT Price on a big trend line and on AB=CD Area
Can easily fall to the D point of the small ab=cd (yellow on the photo)
Then even to retest the Triangle trendline (Blue in the photo)
If price will make last up move we will short 2 at the Orange big AB=CD
