WAN/BTC 4H buy for retest of the top.WAN/BTC making the B wave of flat.
Look for buys for retest of the top.
Wanusd


WAN reloading for round 2! MAs all turning up with the 50MA crossing both the 100/200 and bouncing nicely off support!
Thanks guys!
WANCHAIN-WAN/BTC SETUPWanchain (wanchain.org) aims to build a distributed future "bank." As a distributed digital-asset based financial infrastructure, Wanchain allows any institution or individual to set up their own virtual teller window in the “bank” and provide services such as loan origination, asset exchanges, credit payments and transaction settlements based on digital assets.There are various upcoming news and catalyst so it might affect its price.
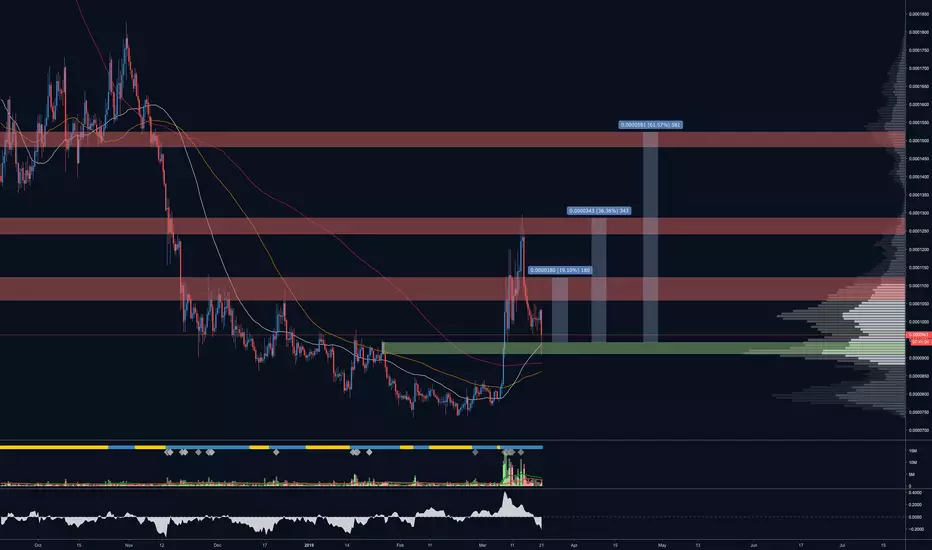
Let's analyze the Daily Timeframe chart of the pair to know levels to buy and could be one of the best performing coins now.
WAN/BTC pair has already seen a surge of 50%+ since last month and with more upside potential because of upcoming news and catalyst.It will undergo a slight correction to downside in the coming days/weeks.
Interested buyers can look for price around 0.0000945-0.0000983 Satoshi(first green bar) and around 0.0000845-0.0000867 satoshi(second green bar) using laddering technique.
Sellers can look for three potential sell zones 0.0001465-0.0001530 Satoshi(first red bar),0.0001958-0.0002037 Satoshi(Second red bar) with long term target around 0.0002890-0.00003027 Satoshi(Last red bar).
Also, it has been trading above the 200D-SMAs and entered Ichimoku cloud, breaking above it would be strongly bullish for the asset.
Caution: If the last line of support 0.0000749-0.0000708 satoshi (last green bar) is broken down then one should not hold the coin as it would be strongly bearish(sell signal) for the asset.

WanChain bearmarket is OverWanchain is showing big volume and interest at current prices showing accumulation
Current level has low risk, big reward.
See for yourself.
Be safe.

WAN looking ready to explode! Wanchain has been consolidating nicely and looks ready to move higher any second on a break of supply here
Thanks guys!


Wanchain needs to break out of the accumulation zone.Eyeing Wanchain here. ICX has been on a nice run lately, and WAN has followed it in the past. More importantly; it has been ranging sideways since the beginning of February.
No position yet, but something to keep an eye on. Waiting for a high time-frame close above 837 sats to long, and 951 should follow suit.
Follow me on twitter @BruceLeeCrypto to stay updated on my trades.
And as always, trade safe.


WAN Back to trendline sir!WAN has strong news but now looks weak. Rejection if resistance can put WAN back to trendline support. Lets see $$$

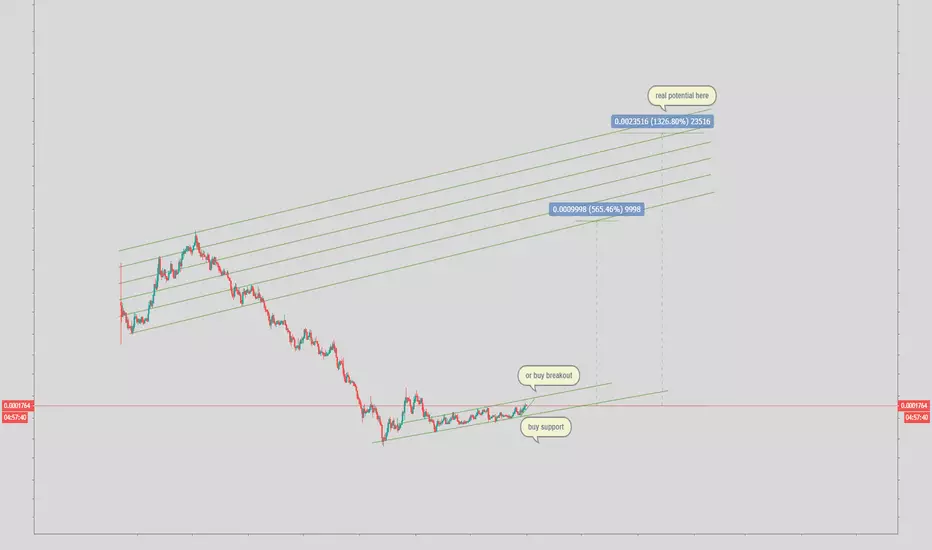
WAN/BTC from 560% to 1300% potentialHello guys.
WAN
I am pleased to present you my vision of the potential of this coin. is at an interesting level and seems ready to move, we can buy support or breakthrough.
ITS NOT financial advice!
WAN remains a BUY!WAN continues to experience difficulty in breaking the 1650 resistance zone and it currently pulls back from its local highs. We could still possibly see a move back down into the trendline support/demand block before making a move back higher. We did, however, wick below the EMAs and bounce back, which does show some buy strength but ultimately we need to close above this resistance zone to really get moving.
Using the EMAs as support is a good sign for bulls as well as them looking to crossover bullish if we can push a little higher.
Thanks guys!

WAN trying to breakoutWAN has pierced through resistance and is looking primed to get back on its horse to move up to the next supply zone.
EMAs do seem to be turning up as the fast-moving is curling higher about to crossover bullish. We could see a pullback into these EMAs as support before making another push higher.
This would be the ideal place for an entry, on a pullback into support. If we do break down lower than the demand zones below would be the next targets.
Thanks guys!

WANBTC C&H and Ascending TriangleThere is possible Ascending Triangle and Cup and Handle . My targets and stop specified on the chart.

WANBTC: rising wedgeOne more confirmation of the wedge by testing the resistance line. Looks promising!
Not a financial advice.

WANUSD ascending triangleWanchain is close to break out of the ascending triangle, making around 1.2 dollars the target.

WANBTC: flattening outThe falling trend of WAN got slowed down, and currently we can see that the price goes mostly sideways. Considering the huge volume at this area, it is very likely that we have a massive accumulation, which eventually will lead to a significant rise, and at least will serve as a nice support.
Not a financial advice.

WAN/BTC - Looking GoodWAN/BTC, MACD weekly will turn bullish in 1-2 Weeks too, KDJ on 2D crossing bullish, RSI wait for cross above purple line (should show more strength above).
Entry: 1317-1500, Targets: TP1 1735, TP2 1950, TP3 2210, TP4 2475, TP5 2820, TP6 3050-3770.
Don't forget to check out my signature! It is not allowed to share my social links here so please have a look :)

WAN made a big inverse H&S, btc and alts confirm it WAN has made a big inverse H&S now with a target of around 50/60% higher. The neckline almost breaks already, volume has been very good the past week as well, looks like accumulation as well. Together with my view of Bitcoin, could be we can see a small/big alt season again, something we have nog seen for months now.
Target of this IH&S is around 2.2, that is a resistance level as well, so it could just push through as well, depends of course on the rest of the market.

WANCHAIN - IS IT STILL ALIVE? OR HEADING TOWARDS GRAVE?WAN has been in the continuous long term downtrend since May starting and the price has depreciated by almost 87%.
It has been moving inside the falling wedge for quite some time now.
The price has been continuously getting rejected from the basis line of the Bollinger bands.
The price action is so weak that it is not even able to cross through EMA(12). (See the circles marked with Pink colour)
Now the price is at the lower boundary of the wedge from where it should try to move towards the basis line
of the Bollinger bands or atleast till the EMA(12)
If it does't rebound from here, it should fall to 1200-ish satoshi range. Alternatively, we the price is able to push a little bit up, it can reach upto 2k satoshi easily. In any case, we are possibly near to bottom. Get ready to open up some positions!
I'll keep updating this, as and when required.
P.S: This is not an investment advice. This is my personal journal. Invest your capital at your own risk.
Keep an eye out. Trade safely. Always remember, money not lost is also a profit.
Good luck trading.!
Peace.

Idea for WanchainLooks like this might be a great opportunity to buy at this level, seems like we are close to a big break up or down

What is happening to WAN? Will it Bounce?Wan is going down with no end in sight.. comparing to BTC, WAN is following a down channel south without any price history to make any valid argument on where the bounce might be. According to TD sequential indicator, we can expect a bounce very soon according to the oversold RSI, and TD sequential is a on 8/9 with an aggressive 13 some time before which indicates that we could have some relief near term.
