#btc #btcusd #elliottwave short sell setup wave 4 16Jul24This count is based on my assumptions so anything can happen not a trading or financial advice just for educational purposes only kindly do your own ta thanks trade with care good luck.
Wave4

#xauusd #elliottwave short sell setup wave 4 16Jul24This count is based on my assumptions so anything can happen not a trading or financial advice just for educational purposes only kindly do your own ta thanks trade with care good luck.
#btc #btcusd #elliottwave short sell setup wave 4 7Jul25This count is based on my assumptions so anything can happen not a trading or financial advice just for educational purposes only kindly do your own ta thanks trade with care good luck.


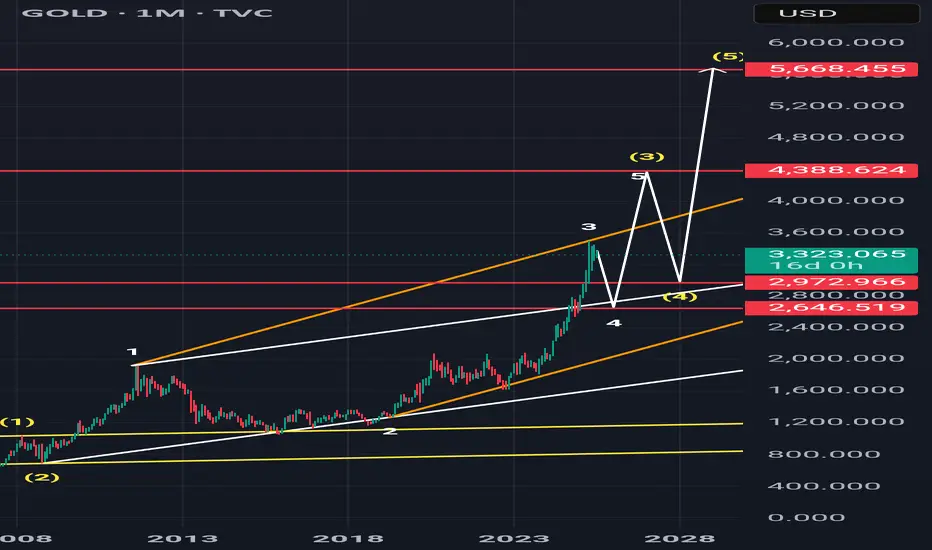
#xauusd #elliottwave short sell setup wave 4 5Feb25This count is based on my assumptions so anything can happen not a trading or financial advice just for educational purposes only kindly do your own ta thanks trade with care good luck.

#btcusd #BTC #elliottwave short sell setup wave 4 24Jan25This count is based on my assumptions so anything can happen not a trading or financial advice just for educational purposes only kindly do your own ta thanks trade with care good luck.

Oberoi reality consolidation #oberoireality is consolidated in daily Timeframe, it looks like triangle pattern, but one needs to be aware has lot of time fake breakout is been seen, good for buying in cash, risk management and patience is important overall bullish for short-term swing.

#xauusd #elliottwave short sell setup wave 4 10Jan25This count is based on my assumptions so anything can happen not a trading or financial advice just for educational purposes only kindly do your own ta thanks trade with care good luck.

#btc #btcusd #elliottwave short sell setup wave 4 28Dec24This count is based on my assumptions so anything can happen not a trading or financial advice just for educational purposes only kindly do your own ta thanks trade with care good luck.

#btc #elliottwave short sell setup wave 4 a 15Dec24This count is based on my assumptions so anything can happen not a trading or financial advice just for educational purposes only kindly do your own ta thanks trade with care good luck.

#xauusd #elliottwave short sell setup wave c 4 11Dec24This count is based on my assumptions so anything can happen not a trading or financial advice just for educational purposes only kindly do your own ta thanks trade with care good luck.

#xauusd #elliottwave short sell setup wave 4 c 4Dec24This count is based on my assumptions so anything can happen not a trading or financial advice just for educational purposes only kindly do your own ta thanks trade with care good luck.

#btcusd #BTC #elliottwave short wave 4 c 94% Discount 1Dec24This count is based on my assumptions so anything can happen not a trading or financial advice just for educational purposes only kindly do your own ta thanks trade with care good luck.

#btc #btcusd #elliottwave short sell setup wave 4 c 1Dec24This count is based on my assumptions so anything can happen not a trading or financial advice just for educational purposes only kindly do your own ta thanks trade with care good luck.

#btc #btcusd #elliottwave short sell setup wave 4 30Nov24This count is based on my assumptions so anything can happen not a trading or financial advice just for educational purposes only kindly do your own ta thanks trade with care good luck.

#xauusd #elliottwave short sell setup wave 4 30Nov24This count is based on my assumptions so anything can happen not a trading or financial advice just for educational purposes only kindly do your own ta thanks trade with care good luck.

#xauusd #elliottwave short sell setup wave 4 20Nov24This count is based on my assumptions so anything can happen not a trading or financial advice just for educational purposes only kindly do your own ta thanks trade with care good luck.

Elliot waves meets Fibonacci [Educational]Hello everyone,
today I like to share how I use elliot waves combined with fibonacci to analyze the market.
The standard rules are:
- Wave 2 can now be lower then the start of wave 1
- Wave 3 should be the longest
- Wave 4 should not breach the high of wave 1
But to have a more objective view there are also price targets to be reached within the different waves. It's a complex subject to show in one chart, so feel free to ask in the comment section if you have any questions.

#btc #btcusd #elliottwave short sell setup wave 4 20Nov24This count is based on my assumptions so anything can happen not a trading or financial advice just for educational purposes only kindly do your own ta thanks trade with care good luck.

Dixon Technologies Share Price Movements with Wave TheorySynopsis of Dixon Technologies Share Price Movements with Wave Theory Correlation
The share price of Dixon Technologies has demonstrated significant fluctuations and growth over the past few years, aligning with the principles of Elliott Wave Theory. This theory suggests that market prices move in predictable wave patterns, typically consisting of five major waves followed by three corrective waves.
Miner Waves Analysis
Wave 1: Date: February 2020, Price: ₹919.45
Description : This initial upward movement marks the beginning of the bullish trend.
Wave 2: Date: March 2020, Price: ₹678.25
Description : A correction phase that follows the first wave, typically retracing a portion of Wave 1's gains.
Wave 3: Date: March 2021, Price: ₹4267.25
Description : Often the strongest and longest wave in the Elliott Wave sequence, Wave 3 represents a significant upward move.
Wave 4: Date: August 2021, Price: ₹4046.25
Description : Another corrective phase, Wave 4, generally retraces less than Wave 2. The target for Wave 4 typically aims to correct 38.2% to 50% of Wave 3, which aligns with the observed price movement.
Wave 5: Date: October 2021, Price: ₹5112.05
Description : The final wave in the primary bullish trend, Wave 5, usually completes the uptrend before a larger corrective phase begins.
Intermediate Waves Analysis
Intermediate Wave (1): Date: October 2021, Price: ₹5112.05
Description : This wave mirrors the final leg of the miner waves, marking the beginning of a new, larger wave cycle.
Intermediate Wave (2): Date: January 2023, Price: ₹2553
Description: A substantial correction that aligns with the typical Wave 2 pattern, correcting a significant portion of Wave (1).
Intermediate Wave (3): Date: July 2024, Price: ₹12879
Description : Following the principles of Elliott Wave Theory, Wave (3) in the intermediate cycle is expected to be the most powerful, reflecting a strong upward movement.
Intermediate Wave (4) Target: Target Price: ₹8900-₹9000
Description : Based on Elliott Wave Theory, Intermediate Wave (4) is projected to correct approximately 38.2% of Wave (3), targeting a price range of ₹8900-₹9000.
Conclusion
The share price movements of Dixon Technologies from February 2020 to July 2024 align well with Elliott Wave Theory. The price started at ₹919.45 and went through a series of upward and corrective waves, reflecting typical wave patterns. The miner waves demonstrated an initial uptrend followed by corrections, culminating in a peak at ₹5112.05. Subsequently, the intermediate waves exhibited a similar pattern, with a substantial correction followed by a strong upward wave, reaching ₹12879 in July 2024. The target for Intermediate Wave (4) is projected to be in the range of ₹8900-₹9000, based on a 38.2% retracement of Wave (3). This analysis confirms the applicability of wave theory to Dixon Technologies' share price movements, indicating predictable patterns in market behavior.
Disclaimer
It's important to note that investing in shares involves risks, and past performance is not indicative of future results. The information provided here is based on technical analysis and Elliott Wave Theory, which are tools used to analyze market trends but do not guarantee future outcomes. Investors should conduct their own research or consult with a financial advisor before making investment decisions.

Burberry may turn around soon? EW sequenceBurberry (ticker: BRBY) reaching ~14 years lows, where the risk /reward ratio for the mid/long term starting to be favourable. I have two scenarios sketched out on the weekly, white being a 5 wave up, in which we finished 3, followed by a yet unfinished irregular flat structure as a wave 4. Yellow suggests a 3 count move up as an (A) wave, working now on the (B) wave, and later (likely several years) a (C) would follow in 5 subwaves.
In yellow I would primarly expect a deeper cut in the (B) wave also as an ABC structure, where we likely nearing the A wave bottom in the foreseable future.
In both scenario a move-up should be imminent, white to start the wave (5) to the upside, and for the yellow it would be the B wave. For the yellow I put there the resistance levels, but be aware, as price cuts deeper (IF), then we need to adjust that red resistance fib box.
Now, the movedown already consist 5 waves, so technicly we could be near to the local lows, and also in support already (hence the post). Next levels to watch: 951, 885, and 834 and 768 as bigger fib support levels.
Weekly RSI is oversold despite MACD is weakening, On the daily we are building divergence already, so far all the meaningful MA's (9/21/50-52) currently rejecting price action, and far below the 200day MA.

Looking for wave 4 on BitcoinWatching for wave 4 here on Bitcoin.
Could pull back to 50k
Stay safe and stay profitable.
- Dalin Anderson

#btcusd #btc #elliottwave Wavec/b Long 28Nov23 #altcoinsThis count is based on my assumptions so anything can happen not a trading or financial advice just for educational purposes only kindly do your own ta thanks trade with care good luck.
