Decentraland: Home StretchMANA should have reached the high of the magenta wave (iv) on August 24. Since then, it has been working on wave (v) of the same color. This last stage should ultimately complete the green wave (2). With the corrective low in place, the price should then turn around and rise above the resistance at $0.48 with wave (1), which is also in magenta. Investors could use the entire range of the Zone to establish long positions, with stops placed about 1% below the lower edge. From a technical perspective, it would also be possible that the past low within the Zone has already ended the green wave alt.(2).
Waveanalyses

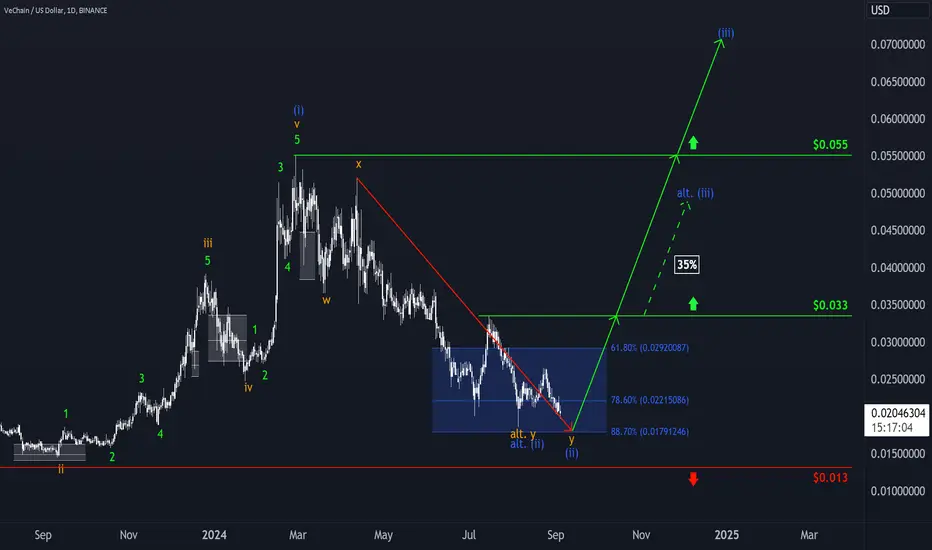
VeChain: Still Some RoomVET experienced a setback last week within our blue Target Zone (between $0.0292 and $0.0179). This development aligns with our primary expectation, as we still grant the blue wave (ii) scope down to the lower edge of the zone. As soon as the low has been established, the price should turn around and be carried above the resistance at $0.055 by the same-colored wave (iii). However, the minimum technical requirement for the low has already been met. Should the coin break through the $0.033 level directly (35% likely), we will already see it in the blue wave alt. (iii).
Snowflake: Please turn!Snowflake has experienced a setback in recent days. However, as it was able to hold above the support line at $107.41, our primary scenario remains intact. Thus, we continue to see the price in the turquoise-colored wave b, which should initially bring a (corrective) increase. Only after the high has been established should larger sell-offs come knocking, completing the wave (2) correction in green. However, we consider it 33% likely that the share has already been working on the final stage of this corrective movement since May. This scenario, which will be activated by a fall below the support level of $107.41, would call off the upward swing accordingly.

Hongkong & China Gas: Do not let up!We stick to our primary assumption that the price should make another attempt to overcome the resistance at HK$6.77 and succeed this time. Finally, as part of the magenta wave (4), we expect the price to rise into our same colored Zone (between HK$8.44 and HK$9.19). Investors could open short positions within this range, with stops placed about 1% above the upper edge. The last leg of the beige wave II should then trigger larger sell-offs. However, we consider it 44% likely that the price is already on the home stretch of this correction. This scenario will be triggered by a fall below our grayed-out Zone. It calls for a fall into the southern Zone between HK$4.73 and HK$3.58 in turquoise.

Mastercard: Almost there!Mastercard has further developed the current wave 2 in turquoise, which we expect to end just below the resistance level at $490.99. After that, a sustained decline should set in, which should lead below the $428.98 mark.

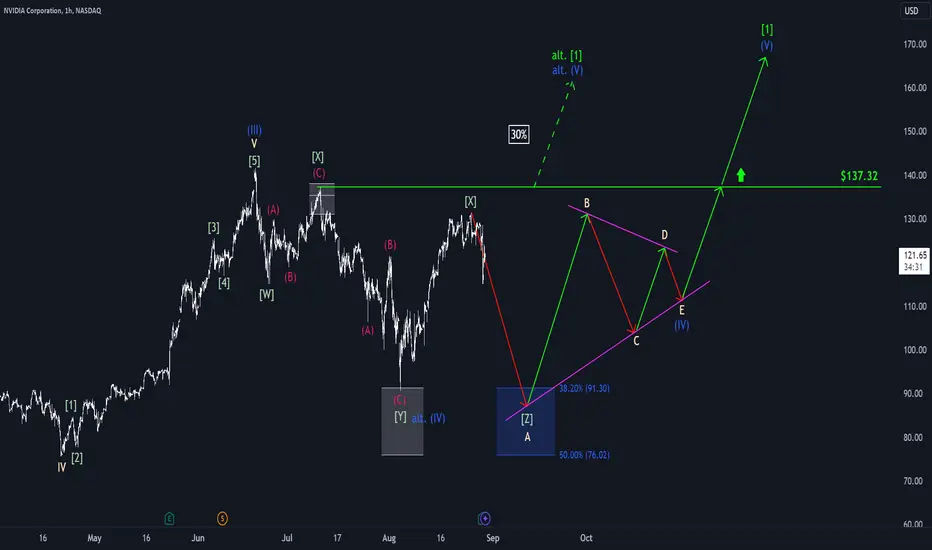
Nvidia: DownhillNVDA has completed the green wave (X) and started descending toward our blue Target Zone between $91.30 and $76.02, which should mark the joint low of waves (Z) in green and A in beige. From this range, the beige five-wave downward move should continue, layawaying along the boundaries of our pink triangular trend channel to finish the large wave (IV) in blue. This final overarching low should take the form of a truncation, i.e., a shortened correction, and initiate a new uptrend above $137.32. However, it is 30% likely that the blue wave alt.(IV) has already concluded, which would result in a direct breakout above the $137.32 mark.
Travelers: One last climbWe expect Travelers to continue its corrective rise in the form of the magenta wave (B) to just below resistance at $232.75 before a significant sell-off sets in. If, on the other hand, the price were to decline earlier and slip below the support at $200.40, our alternative scenario will come into play (35% likely). In this case, we will expect a lower low of the magenta-colored wave alt.(A).

Chainlink: Take-off! LINK shot upward last week and was thus able to leave our turquoise Target Zone (between $8.20 and $10.90). We expect the turquoise wave 3 to lead above the resistance at $20.85. However, a renewed dive into our Zone within the internal substructure is quite conceivable in the short term, which is why we continue to keep it active.

Apple: Near the summitApple should be on the last meters of the turquoise wave B. As soon as the high is established, we expect a final sell-off. For the end of the corrective movement, we have added a magenta-colored Target Zone (between $192.02 and $172.34) to the chart. Investors could establish long positions there, with stops placed around 1% below the lower edge. With the low in place, we expect a rise above the resistance at $254.30. Should this level be broken earlier, our alternative scenario (34%) will come into play. This wave count sees the last local low as the low of the magenta wave alt.(2).

Block: Let's go!In Block's chart, we now consider the low of the turquoise-colored wave 2 to be in place. The same-colored wave 3 should now carry the price out of the magenta Target Zone and above the resistance at $87.19. Only our 30% probable alternative scenario calls a deeper correction low.

Bitcoin: Hello Again Bitcoin surged back above $60,000 yesterday evening and is thus trading at a price level that it has been trying to overcome for two weeks now. We primarily expect another setback into our green Target Zone (between $47,012 and $58,655) so that the low of the green wave 4 can be established there. Following this, the price should then turn around sustainably and rise above the all-time high of $73,808.

Fantom: Come Back!We primarily expect a return into our orange Target Zone (between $0.3220 and $0.1866) before the orange wave v and thus the green wave comes to an end. After that, a sustained rise above the resistance at $0.54 should occur. However, as the price had already approached the range, the technical minimum requirement for the correction low has already have been met. Should we now see a rise above the resistance at $0.54 (33% likely), we will thus have to see the price in the orange-colored wave alt.i.

Avalanche: Recovery!AVAX recovered last week and rallied within our turquoise Target Zone (between $17.48 and $29.30). We now expect the price to be carried out of the Zone by the turquoise wave 3 and above the resistance at $41.78. However, we still have to keep our alternative scenario (40% likely) in mind. This option calls for a lower low of the turquoise wave alt.2 below the range.

Snowflake: One last climbSnowflake should rally once more before ending the turquoise wave b. After this corrective rise, we expect a fall to below the support at $107.41, which will complete the green wave (2). Meanwhile, we consider an earlier start to this final sell-off to be 33% likely.

Solana: Reconsideration?According to our primary expectation, Solana should now sell off even more strongly and head for our blue Target Zone ($109 – $51.20), where we expect the low of the same-colored wave (ii). Traders could open long positions within this range, placing stops about 1% below the lower edge. With the low in place, a move back above the resistance at $210.03 is on the cards. However, with the price narrowly missing the Zone in the past, we must also consider the option that the low has already been established. This scenario (37% likely) will come into play on a break of resistance at $210.03.

Bitcoin: Tug-of-WarThe declines of the last few hours could be the prelude to the final sell-off of green wave 4, which would pull the price significantly lower into our Zone. Only when this move has ended should the price start a sustained upward trend and surpass the resistance at $73,808.

WTI: Knock, knock…WTI recently rejected the lower edge of the turquoise Target Zone between $79.67 and $85.86. We expect a further advance into this range before the high of turquoise wave B can be established. The price should then turn around and sell off with the last leg of the green wave (2) into our same-colored Target Zone between $49.85 and $27.93.

Nio: Close Call!We continue to see NIO in the blue wave (iii), which should lead to an increase above the resistance at $7.02. Subsequently, we expect a small correction before a further rise completes the magenta wave (1). Should the share fail to hold the $3.61 mark, which we consider to be 48% likely, we will see it in the beige-colored wave alt. II.

Fiserv: At the crossroadsWe primarily expect Fiserv to drop into magenta Target Zone between $134.54 and $120 as part of the same-colored wave (2). Investors could then open long positions there, with stops placed around 1% below the lower edge. Subsequently, we expect a rise above the resistance at $165.28. We consider an earlier break of this level to be 37% likely. In this case, however, it would only be the magenta-colored wave alt. (1).

Organigram: Home StraightOrganigram should retrace a little further within our magenta Target Zone between C$2.65 and C$1.91 before completing the magenta wave (2). With the low in place, a rise above the resistance at $3.95 is then on the agenda.

Atlassian: One Last DipWe still allow Atlassian a little room to the downside. Above the support at $114.11 it should end the magenta wave (B). Subsequently, a rise above the resistance at $283.25 is on the agenda, which will end the green wave (X).

Booking Holdings: Trend Reversal! The sharpness of the correction and the current structure lead us to consider the last high at $4147 as the end of the major wave (I) in blue. We now expect a countermovement in the green wave (II), which should end below the resistance at $4147. Following this corrective counter-move, we expect further declines. That being said, our alternative scenario (33%) calls for further record highs. In this case, we will still have to place the price in the blue wave alt. (I).

Chainlink: Let’s go!LINK dropped significantly in the last seven days and even briefly undercut our turquoise Target Zone (between $8.20 and $10.90). However, as it was able to turn around quickly and only undercut the range by less than 1%, our count remains intact. We now see the turquoise wave 2 as completed and expect an upward push above the resistance at $20.85 in the further course. Investors could open long positions within our Target Zone. Stops could be placed around 1% below the lower edge. Should the bears push the price significantly below the Zone (37% likely), we will have to anticipate a lower low of the turquoise wave alt.2
