Gold Update 28 JULY 2025: On The EdgeGold is accurately following the path shown in my earlier post.
Wave D respects the triangle rules, staying below the top of wave B.
Wave E appears nearly complete, even piercing the A–C support line.
This is acceptable as long as wave E stays above the wave C low at $3,251.
Keep a close eye on this invalidation point.
The target range remains unchanged: $3,900–$4,300.
Wave Analysis

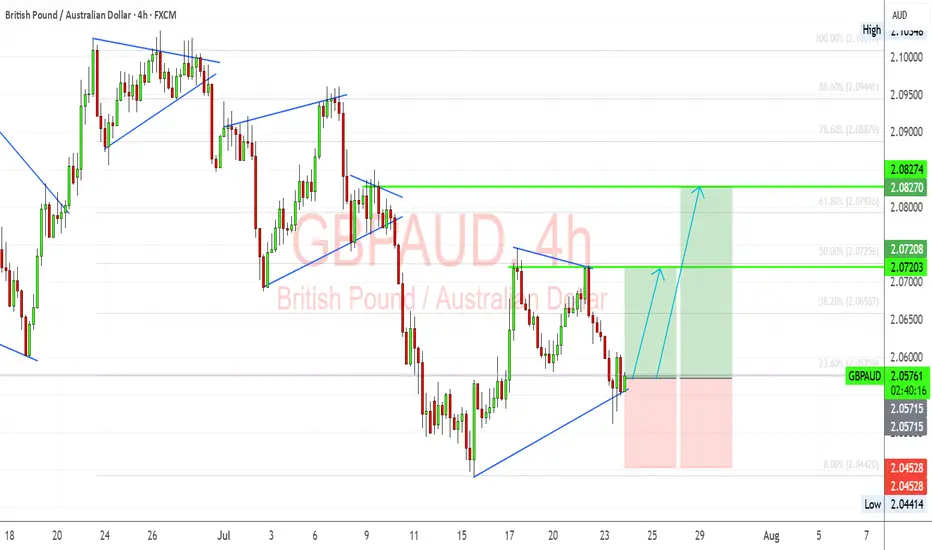
GBP/AUD Trade Setup – Bullish Flag Breakout in PlayGBPAUD has formed a clean bullish flag structure after a significant impulsive move upward. Following the correction, we’re now testing breakout levels with clear Fibonacci confluence and bullish structure support around 2.0560. I'm anticipating a push toward the next resistance levels if buyers defend this trendline.
🔎 Technical Highlights (My View):
Bullish Flag Pattern: The corrective flag has broken to the upside and is being retested. This suggests a possible continuation of the bullish trend.
Fibonacci Support: Price bounced near the 23.6% retracement of the previous bullish leg, which acts as a minor but effective support in trending moves.
Bullish Trendline Holding: The ascending trendline from the July lows continues to act as dynamic support. This shows sustained buyer interest.
Target Zones:
TP1: 2.0720 – aligns with 50% retracement and recent structure.
TP2: 2.0827 – aligns with 78.6% retracement and past resistance.
SL: Below 2.0450 to invalidate the setup.
🏦 Fundamental Context:
GBP Strength: The Bank of England remains more hawkish than the RBA. UK inflation data remains sticky, and traders are still pricing in the potential for another hike if services inflation remains elevated.
AUD Weakness: AUD is under pressure due to soft labor market data and declining commodity demand from China. RBA minutes also struck a cautious tone, which weighs on the Aussie.
China Risk: AUD is sensitive to Chinese sentiment. Current trade and tariff tensions are adding indirect bearish pressure to the AUD.
⚠️ Risks to My Setup:
If Aussie labor or CPI data surprises to the upside, AUD could regain strength.
UK economic data deterioration (e.g., services PMI, wage inflation) could weaken GBP.
Break below 2.0450 would invalidate the bullish setup and suggest potential range continuation.
📅 Upcoming Catalysts to Watch:
UK Retail Sales – A strong print supports GBP continuation.
AU CPI (Trimmed Mean) – Any upside surprise could limit AUD downside.
China Industrial & Services PMI (if released soon) – indirect AUD mover.
⚖️ Summary – Bias & Trade Logic
I’m currently bullish GBP/AUD, expecting a continuation of the prior uptrend now that price has broken and retested the flag structure. Fundamentally, GBP is supported by relatively hawkish BoE expectations, while AUD remains pressured by RBA caution and China-linked macro weakness. My bias stays bullish as long as the trendline holds and Aussie data doesn’t surprise significantly.
Nightly $SPY / $SPX Scenarios for July 29, 2025🔮 Nightly AMEX:SPY / SP:SPX Scenarios for July 29, 2025 🔮
🌍 Market‑Moving News 🌍
U.S.–EU Trade Deal Sparks Optimism
The U.S. and EU signed a trade framework allowing a 15% tariff rate on most EU imports, averting harsher penalties. The S&P 500 and Nasdaq both closed at fresh record highs, supported by upbeat tech earnings sentiment—Tesla advanced on a new $16.5B AI chip deal with Samsung—while U.S.–China trade talks resume in Stockholm.
Fed Likely to Hold Rates; Political Pressure Mounts
The Fed is expected to leave its benchmark rate at 4.25%–4.50% at the July 29–30 FOMC meeting. Chair Powell faces growing political pressure from President Trump to cut rates and concerns about central bank independence remain elevated.
Trade Talks Extension to Avoid Tariff Hike Deadline
The August 1 tariff deadline looms. Markets are watching to see if trade deals with China, Canada, and the EU extend the pause or risk new tariffs. Volume in AI/chip stocks and industrials reflects sensitivity to trade developments.
📊 Key Data Releases & Events 📊
📅 Tuesday, July 29
FOMC Meeting Begins — All eyes on Fed rate decision and updated projections.
GDP (Advance Q2 Estimate) — Expected around +1.9% on signs of economic rebound.
⚠️ Disclaimer:
This summary is for educational and informational purposes only—it is not financial advice. Always consult a licensed financial advisor before making investment decisions.
📌 #trading #stockmarket #economy #Fed #trade #tariffs #PCE #jobs #technicalanalysis

NextGenTraders81 NAS short swingI have my sell limit set at 23,500 as there is alot of sell limits set there, also at 23,550 hence the SL is above that zone.
I am pretty sure the position will be set on BE before it tries to return to these highs, how long it will take to hit TP, who knows.. a correction within the channel is due after numerous ATHs.
If you will follow, take partials on the way !
Good luck :)

GOLD REVERSALHello folks, most traders stop out on this idea right? lets get back to previous month opening price, for short idea stoploss above. 3440.
But If you can wait for LONG below. maybe in the next 2 days.
Goodluck. I prefer LONG? I will update once I see volumes on downtrend today or the next day.
I only see short today. the volume is declining/exhausted. I predict reversal atm.
ciao.. see the chart above.
this is not a financial advice.
trade it like its your own business.

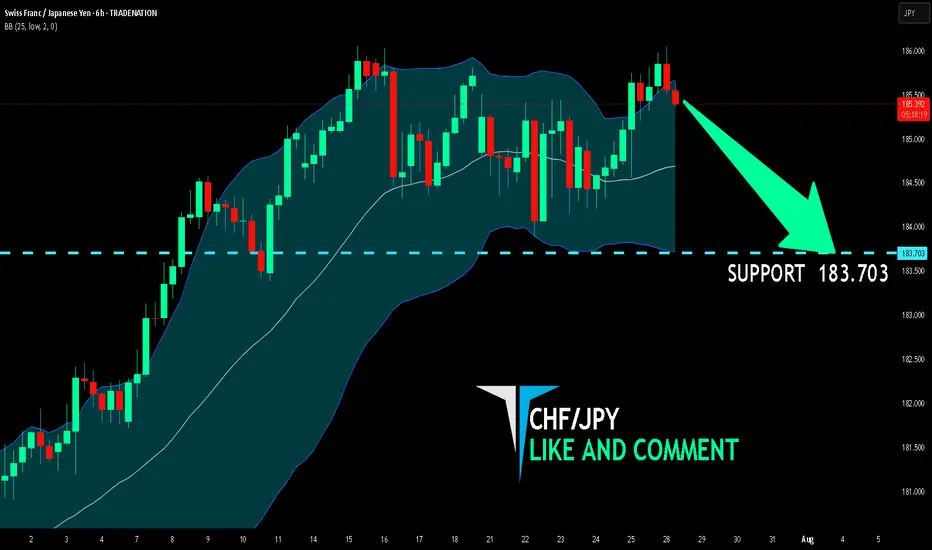
CHF/JPY BEARISH BIAS RIGHT NOW| SHORT
Hello, Friends!
The BB upper band is nearby so CHF-JPY is in the overbought territory. Thus, despite the uptrend on the 1W timeframe I think that we will see a bearish reaction from the resistance line above and a move down towards the target at around 183.703.
Disclosure: I am part of Trade Nation's Influencer program and receive a monthly fee for using their TradingView charts in my analysis.
✅LIKE AND COMMENT MY IDEAS✅
AMD: Potential Mid-Term Reversal from Macro SupportPrice has reached ideal macro support zone: 90-70 within proper proportion and structure for at least a first wave correction to be finished.
Weekly
As long as price is holding above this week lows, odds to me are moving towards continuation of the uptrend in coming weeks (and even years).
1h timeframe:
Thank you for attention and best of luck to your trading!

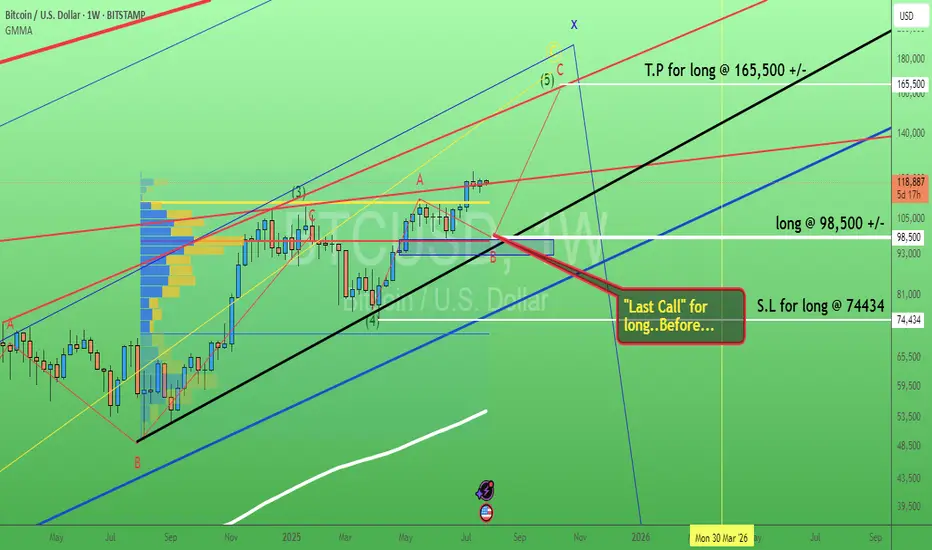
Bitcoin. Last call buy level? 29/July/25BTCUSD probably will have pullback toward confluence zone of 1) Trendline Support 2) Order Block 3) POC of volume before hitting ATH again
GBPJPY What Next? SELL!
My dear friends,
Please, find my technical outlook for GBPJPY below:
The price is coiling around a solid key level - 199.08
Bias - Bearish
Technical Indicators: Pivot Points Low anticipates a potential price reversal.
Super trend shows a clear sell, giving a perfect indicators' convergence.
Goal - 198.77
Safe Stop Loss - 199.23
About Used Indicators:
The pivot point itself is simply the average of the high, low and closing prices from the previous trading day.
Disclosure: I am part of Trade Nation's Influencer program and receive a monthly fee for using their TradingView charts in my analysis.
———————————
WISH YOU ALL LUCK

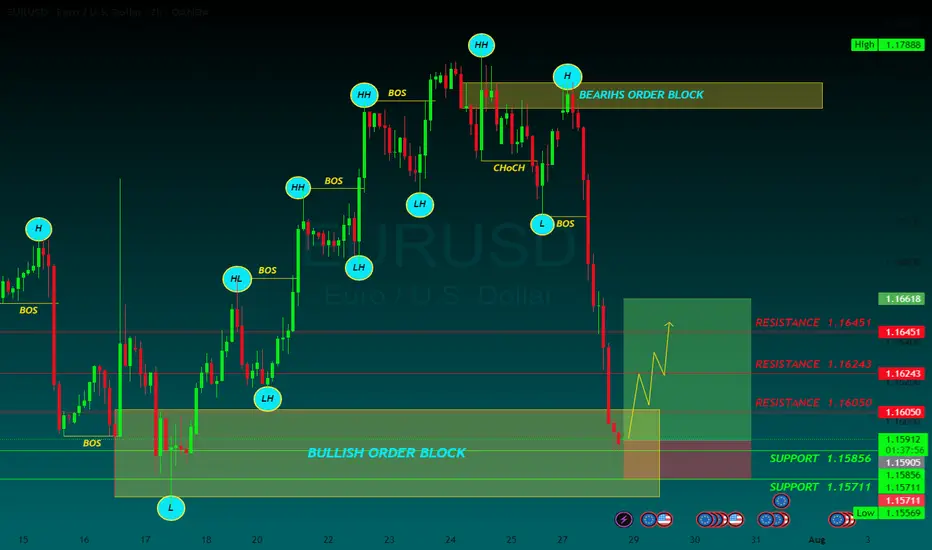
EURUSD BUYThe US Dollar (USD) gapped lower at the weekly opening amid optimism fueling demand for high-yielding assets, following news that the United States (US) and the European Union (EU) reached a trade deal.
The US and the EU agreed a 15% tariff on most European goods entering the US, much higher than the average 4.8% exporters face these days. No rates will apply to EU exports in important sectors, including aircraft parts, some chemicals, semiconductor equipment and some agricultural products.
The EU response to the headline was uneven. European Central Bank (ECB) policymaker Peter Kazimir said on Monday that the trade deal reduces uncertainty, but it is unclear for now how it impacts inflation. However, the French prime minister, François Bayrou, said the EU has capitulated to Donald Trump’s threats, adding it is a “dark day” for the EU. The trade focus now shifts to the US-China as officials from both countries resume talks in Stockholm.
The EUR/USD pair peaked at 1.1771 during Asian trading hours, but changed course early in Europe, with the USD surging across the FX board, resulting in the pair shedding over 100 pips.
The macroeconomic calendar had nothing relevant to offer at the beginning of the week, but will be flooded with first-tier releases, including US employment-related data ahead of the Nonfarm Payrolls report on Friday, the preliminary estimates of the Q2 Gross Domestic Product (GDP) for the US and the EU, and inflation updates. On top of that, the Federal Reserve (Fed) will announce its decision on monetary policy on Wednesday.
RESISTANCE 1.16050
RESISTANCE 1.16243
RESISTANCE 1.16451
SUPPORT 1.15856
SUPPORT 1.15711
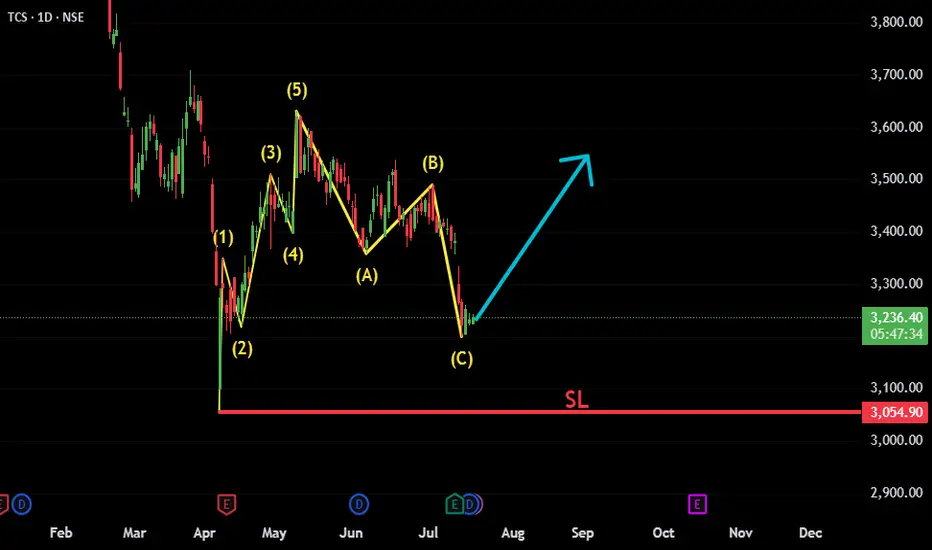
TCS: ABC Correction Complete – New Impulse Wave in FocusTCS appears to have completed a classic Elliott Wave structure, consisting of an initial 5-wave impulsive move followed by an A-B-C corrective phase. The recent price action suggests the correction has likely ended, and a new bullish impulsive move is beginning.
Fundamental trigger:
Interestingly, just a few days ago, TCS announced strong quarterly results — reporting solid profits and declaring a dividend. Despite the positive news, the stock reacted negatively and moved lower. This could have been a classic case of "good news, bad reaction" — possibly a stop-loss hunt or smart money absorbing liquidity before the next leg up.
Key technical points:
✅ Wave 1-2-3-4-5 clearly visible, forming the initial impulse.
✅ A-B-C correction appears complete with price reversing from a key support zone.
📈 Bullish structure forming; watching for confirmation with a break above recent highs.
🔍 Technicals and sentiment suggest renewed upside potential, despite short-term shakeouts.
Invalidation below recent swing low (Beginning of 1st Impulsive).
This setup offers a potential long opportunity with a favorable risk-reward
#TCS #NSE:TCS #ElliottWave #WaveAnalysis #TechnicalAnalysis #ABCCorrection #ImpulsiveWave #LongSetup #ChartAnalysis #NSEStocks #IndianStocks #Dividend #Earnings #PostEarningsMove #TrendReversal #SwingTrading #PriceAction #SmartMoney
CRUDE OIL Bullish Continuation! Buy!
Hello,Traders!
CRUDE OIL made a rebound
From the support just as
I predicted and the price
Went further still and broke
The key horizontal level
Of 66.50$ and the breakout
Is confirmed so we are
Bullish biased and we will be
Expecting a further bullish
Move up!
Buy!
Comment and subscribe to help us grow!
Check out other forecasts below too!
Disclosure: I am part of Trade Nation's Influencer program and receive a monthly fee for using their TradingView charts in my analysis.

NOT/USDTHas been ranging for over 170 days, forming a classic accumulation box structure, signaling strong base-building behavior. The long consolidation phase indicates that smart money may be actively accumulating before a major rally.
Price action is showing early signs of reversal, with demand stepping in near the lower boundary of the range. Breakout attempts are becoming more frequent and volume is gradually picking up key signs of a potential expansion phase on the horizon.

GOLD Epic Trendline Breakout! Sell!
Hello,Traders!
GOLD was trading along
A long-term trend-line but
It is broken now and the
Breakout is confirmed so
We are bearish biased now
And we will be expecting a
Further bearish move down
Sell!
Comment and subscribe to help us grow!
Check out other forecasts below too!
Disclosure: I am part of Trade Nation's Influencer program and receive a monthly fee for using their TradingView charts in my analysis.

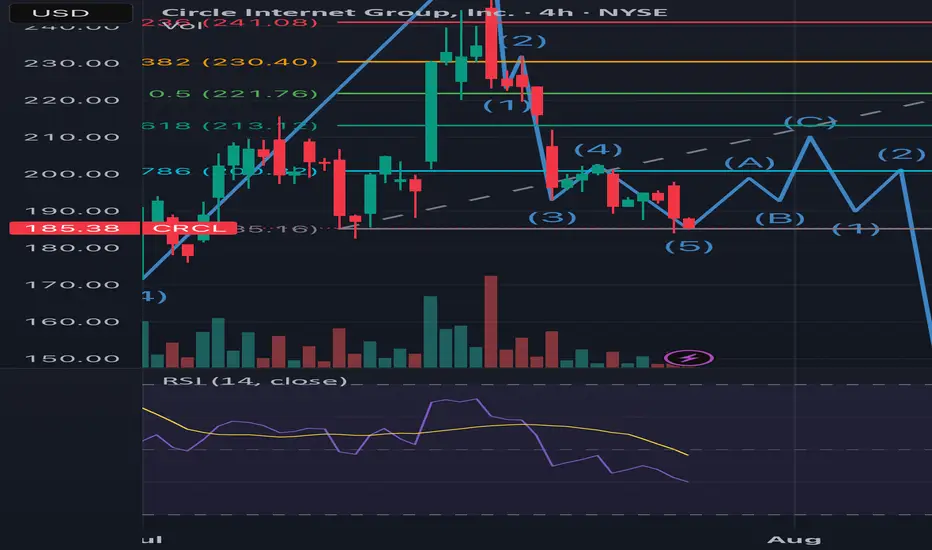
What goes around comes full CRCLFor the record, I bought in at ~$220 and looking to exit to ethical reasons. I believe that this stock will reach over $400USD for the end of the year but with every l opportunity left off for a greater cause, there will always be a greater reward.
1. Notice the end of the first 5 wave Elliot Impulse coincides with the passing of the GENIUS bill. Wave 3 peak was the ATH and wave 5 was the Friday peak of around $262.
2. We’ve entered the correction where sellers are looking to close from the hype
Wave 1 of the correction was the sell off from the wave 5 peak.
From the chart you can see the 3 wave correction is beginning with wave 1 of the 3 coming to an end.
Good news if you want to swing it to 213, this would be a good entry. Bad news if you want ito t hold it for ATH as it means you’d have to bear the third wave of the correction phase (gap fill ~$216), from there I’m expecting the huge sell off post earnings and FED expectations.
However, after retracing a new cycle will emerge led by major catalysts like the CLARITY Bill, CIRCLE’s bank charter application, USDT diminishing presence in the US and the adoption of USDC even possibly making it the standard stablecoin for all US crypto activity, DE-Fi growth and tradfi participation and growth in their MMF and remittance segments. This will kick start a new run where the highs of $400 will be achieved.
So target next high (earnings time) is $213. I assume price will not go below this region. But a recommended sell until q4
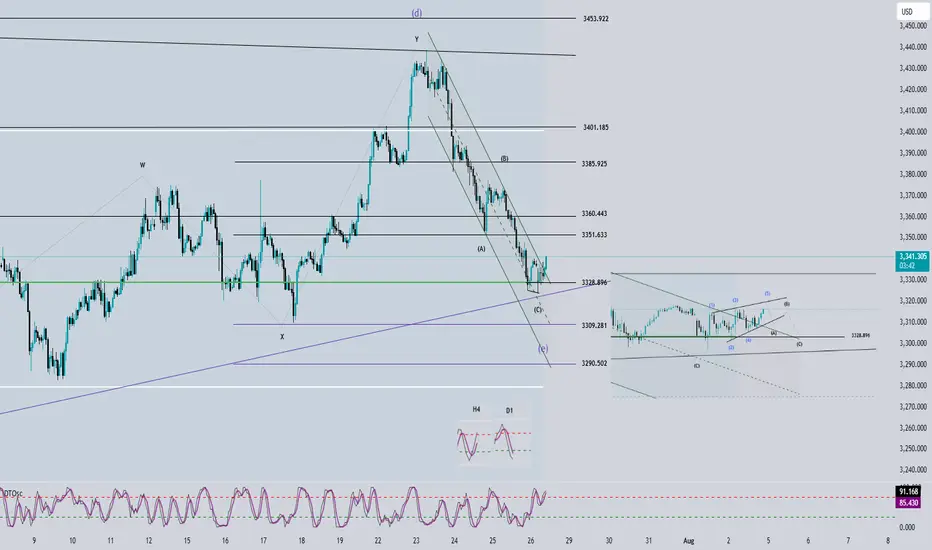
Elliott Wave Analysis – XAUUSD – July 28, 2025📊
________________________________________
🔍 Momentum Analysis:
• D1 Timeframe: Momentum has entered the oversold zone. This strongly suggests a potential bullish reversal today, which could lead to a rally or sideways movement lasting around 4–5 days.
• H4 Timeframe: Momentum is reversing upward. This indicates a likely bullish or sideways move in the short term, at least until momentum reaches the overbought zone (estimated within the next 2 H4 candles).
• H1 Timeframe: Momentum is currently overbought, so we may first see a pullback or sideways movement until a clearer reversal signal appears.
________________________________________
🌀 Wave Structure Analysis:
• On the H4 chart, as noted in previous plans, the assumption that price is forming a contracting triangle (abcde) is still valid. Price is currently in the final leg (wave e) of this triangle.
• On the H1 chart, we can observe a channel structure, within which an abc corrective pattern is unfolding.
• The lower boundary of the triangle (marked by the green trendline) combined with support zones will be critical areas to monitor for the end of wave e.
🔺 Note: Wave e does not necessarily end precisely at the triangle boundary – it can slightly overshoot. Hence, we’ll rely on smaller wave structures to identify potential reversal zones.
________________________________________
🎯 Key Price Zones to Watch:
• Target 1: 3329
• Target 2: 3309
• Target 3: 3290
________________________________________
🔎 Lower Timeframe Structure (M10):
From the current price action (as shown in the chart), we can see a leading diagonal triangle structure forming. This is a pattern commonly seen in wave 1. If this pattern is confirmed, a sharp and steep decline toward the 3329 zone is likely.
________________________________________
⚖️ Combining Momentum & Wave Structure:
• D1: Signals a potential reversal → favors Buy setups.
• H4: Momentum is rising, but price hasn’t confirmed a new bullish trend → need to stay alert and tighten Stop Loss.
• H1: Overbought + possible leading diagonal → Expecting a pullback for wave 2 toward 3329 → this would be the optimal Buy zone.
________________________________________
🧭 Trade Plan:
• For experienced traders:
→ Wait for price to reach key levels and watch for reversal signals before entering.
• For beginners:
→ Use the following Limit Buy setup:
✅ Setup 1:
• Buy zone: 3330 – 3328
• Stop Loss: 3320
• TP1: 3351
• TP2: 3370
• TP3: 3385
✅ Setup 2:
• Buy zone: 3310 – 3308
• Stop Loss: 3300
• TP1: 3328
• TP2: 3351
• TP3: 3370
EURNZD Bearish Breakout !
HI,Traders !
#EURNZD was trading along
The rising support line but
Now we are seeing a bearish
Breakout so we are bearish
Biased and we will be expecting
A further bearish move down !
Comment and subscribe to help us grow !

Option Chain AnalysisTable of Contents
Introduction to Option Chain
What Is an Option Chain?
Key Components of an Option Chain
Call vs. Put Options in the Chain
How to Read an Option Chain
Open Interest (OI) Analysis
Implied Volatility (IV) Analysis
Strike Price Selection
Support and Resistance Levels from Option Chain
Option Chain for Intraday & Swing Trading
1. Introduction to Option Chain
In the world of options trading, success is not just about buying calls or puts randomly—it’s about understanding market data. One of the most important tools for analyzing this data is the Option Chain. Whether you're a beginner or an advanced trader, mastering option chain analysis can help you identify market sentiment, key levels, and trading opportunities.
2. What Is an Option Chain?
An Option Chain, also known as an Options Matrix, is a tabular representation of all available option contracts (both Call and Put) for a particular underlying asset—like Nifty, Bank Nifty, Reliance, TCS, etc.—for a specific expiry date.
It shows:
Strike prices
Premiums (Prices)
Open interest (OI)
Volume
Implied volatility (IV)
Bid/ask prices
Think of it like a menu card for options, showing all the possible trades you can take, and key stats about each.
3. Key Components of an Option Chain
✅ Strike Price:
The price at which you can buy (Call) or sell (Put) the underlying asset.
✅ Premium (LTP):
The last traded price (LTP) of the option.
✅ Open Interest (OI):
The number of open contracts for a strike price. Indicates trader interest.
✅ Change in OI:
The change in open positions compared to the previous day.
✅ Volume:
The number of contracts traded in the current session.
✅ Implied Volatility (IV):
Market's expected volatility of the underlying asset.
4. Call vs. Put Options in the Chain
In every option chain, you’ll see two sections:
Call Options (Left side) Put Options (Right side)
Bullish expectation Bearish expectation
Buy if expecting upside Buy if expecting downside
Sell if expecting sideways/down Sell if expecting sideways/up
Usually, the middle column contains strike prices, with Call data on the left and Put data on the right.
5. How to Read an Option Chain
Let’s take an example:
Assume Nifty is trading at 22,200. You look at the Nifty option chain.
You’ll see multiple rows of strike prices (e.g., 22,000, 22,100, 22,200…) and for each, data like LTP, OI, IV.
Look for:
ATM (At-the-money): Closest strike to the current price (22,200).
ITM (In-the-money): For calls, strikes < spot; for puts, strikes > spot.
OTM (Out-of-the-money): For calls, strikes > spot; for puts, strikes < spot.
Example:
22,200 is ATM.
22,100 Call is ITM.
22,300 Call is OTM.
6. Open Interest (OI) Analysis
OI is one of the most powerful indicators in option chain analysis. It shows where traders are placing their bets.
✔️ What to Look For:
High OI = Strong interest at that strike.
Increase in OI = New positions being added.
Decrease in OI = Positions being closed.
✔️ Interpretations:
High OI in Call → Resistance level.
High OI in Put → Support level.
Let’s say:
22,500 Call has 30 lakh OI → Strong resistance.
22,000 Put has 35 lakh OI → Strong support.
This gives you the trading range of Nifty: 22,000 to 22,500.
7. Implied Volatility (IV) Analysis
IV represents the market's future expectations of volatility. Higher IV means higher premiums.
✔️ Why IV Matters:
When IV is high, options are expensive.
When IV is low, options are cheaper.
✔️ Practical Use:
Sell options when IV is very high (premium is inflated).
Buy options when IV is low (premium is cheap).
8. Strike Price Selection
Choosing the right strike is key for successful trading.
✔️ For Buying Options:
Buy slightly ITM for better delta and time value.
ATM works for short-term, fast movements.
✔️ For Selling Options:
Sell OTM options with high OI and low IV.
✔️ Tip:
Always check the OI and IV before choosing a strike. Avoid illiquid strikes (with low OI or volume).
9. Support and Resistance Levels from Option Chain
You can spot support and resistance based on OI data.
✔️ Support:
Strike where Put OI is highest.
E.g., 22,000 Put with highest OI = Support zone.
✔️ Resistance:
Strike where Call OI is highest.
E.g., 22,500 Call with highest OI = Resistance zone.
This helps you create a trading range.
10. Option Chain for Intraday & Swing Trading
✅ Intraday Trading:
Watch change in OI during live market.
Spike in Call OI → Possible resistance forming.
Spike in Put OI → Possible support forming.
✅ Swing Trading:
Analyze overall OI trend.
Look at monthly expiry data.
Identify positional buildup or unwinding.
GOLD Bearish Breakout!
HI,Traders !
#GOLD is trading in a strong
Downtrend and the pair
Broke the key horizontal
Level around 3318.97 which
Reinforces our bearish
Bias and we will be
Expecting a further
Bearish move down !
Comment and subscribe to help us grow !

BTCUSD lower toward <113,000-ishI think we are in an Elliotwave A-B-C-D-E pattern, whereas E is delevoping. Price target toward $112,319 - $113,925
From a daily perspective, we can go as lower towards the $95k's...but let see where the next few days takes us.
I'm wrong is we break/close $119,826

EURUSD market structure analysis on M15, H1 timeframesH1 Timeframe – Main Trend: BULLISH
🟢 Current Situation:
The H1 structure is showing a clear sequence of Higher Highs (HH) and Higher Lows (HL) ⇒ indicating an uptrend.
The market is currently in a retracement phase following the last bullish impulse.
Price is approaching a demand zone from a previous structure, where buy orders may be stacked.
📉 M15 Timeframe – Main Trend: BEARISH (within H1 pullback)
🔍 Current Observations:
While H1 is in a retracement, M15 shows a clear bearish market structure (Lower Lows – Lower Highs).
However:
Price has tapped into the H1 demand zone.
A liquidity grab (sweep of highs/lows) just occurred on M15.
This was followed by a Break of Structure (BOS) to the upside ⇒ signaling potential absorption of sell-side liquidity and a reversal in alignment with the higher timeframe (H1).

GBPJPY IdeaWe are waiting for our asset to reach our action zone, and based on the reaction, we’ll decide on our next moves.ALWAYS WAIT FOR A CONFIRMATION TO SEE IF THE PRICE VALIDATES THE ZONE.and you what is your vision of the EURUSD its interests me! i wait you in the commentary
