AUD-NZD Rebound Ahead! Buy!
Hello,Traders!
AUD-NZD made a retest
Of the wide horizontal support
Level again at 1.0909 and we
Are already seeing a bullish
Reaction so a local bullish
Rebound can be expected
Buy!
Comment and subscribe to help us grow!
Check out other forecasts below too!
Disclosure: I am part of Trade Nation's Influencer program and receive a monthly fee for using their TradingView charts in my analysis.
Wave Analysis

BITCOIN PREDICTION: HUGE BREAKOUT SOON!! (watch this level) Yello Paradisers! I'm sharing with you multi-timeframe analysis on Bitcoin, levels to watch out for, confirmations we are waiting for, and everything needed for successful professional trading that is being profitable in the long run.
I'm sharing with you zig-zag from the Elliot Wave pattern formation. I'm also sharing a possible impulse we are going through, a head and shoulders pattern and its target, and the next major resistance and support levels.
I'm sharing with you a contracting triangle setup and how to trade it, along with an ending diagonal setup and how to trade it. Watch out for confirmations and how the price is developing based on what I have been talking about in this video, then trade it as a professional trader should.
Make sure that you have a great risk management, trading strategy, and tactic for entering the trades. I have explained some tactics that I'm watching for in this video, but make sure that all these tactics are well within your larger trading strategy and that you're approaching the market professionally. Don't try to get rich quick.
Make sure that you are focusing on long-term profitability and survival. This is the only way you can make it in crypto trading!

ABCDE Pattern Verification The chart shows a Contracting Triangle structure (ABCDE), which is a valid Elliott Wave corrective pattern.
Waves A, C, E are downward corrective waves, and B, D are upward corrective waves.
Each leg appears to subdivide into a 3-wave structure (zigzag/flat) which is mandatory in triangles.
Wave E seems to have perfectly touched a support trendline and reversed sharply upward, confirming the triangle’s end.
Breakout Confirmation:
ETH has broken out of the upper triangle resistance line, confirming a bullish breakout.
The breakout is accompanied by a volume spike—this adds credibility.
First Target: $4,868 (Previous ATH Resistance)
Main Target (Fib Extension/Measured Move): $8,454
This target is logical as Wave 5 after a triangle often equals Wave 1's length projected from Wave E.
It also aligns with psychological resistance (near $8k).
Professional Verdict:
The ABCDE triangle is valid and effective.
The breakout confirms the start of Wave 5 impulsive rally.
Targets: $4,868 (short-term) → $8,454 (macro target).
Expect 3 steps (A-B-C style) in the final wave due to timeframe exhaustion but with strong upside potential.
Do you want me to provide my TA so join my newly start community for free... for contact u must msg me here so i will share details..... enjoy this

USD-JPY Is Overbought! Sell!
Hello,Traders!
USD-JPY is trading in a
Strong uptrend and the pair
Will soon hit a horizontal
Resistance of 149.200
So after the retest a
Local bearish pullback
Is to be expected
Sell!
Comment and subscribe to help us grow!
Check out other forecasts below too!
Disclosure: I am part of Trade Nation's Influencer program and receive a monthly fee for using their TradingView charts in my analysis.

XAU/USD – Current Wave Count & Potential ScenariosOANDA:XAUUSD
We are currently moving from (white) wave 3 to (white) wave 4.
So far, I am leaning towards the white count where the waves labeled (A), (B), (C) form a larger corrective wave A, which leads to wave B, and then to (white) wave 4.
Up to now, we have only completed (A) and (B).
Now, in the yellow bracket, we can interpret a 1-2-3-4-5 structure leading to (white) wave C 🟡.
Alternatively, one could interpret a triangle pattern (pink count):
Waves A, B, C, D, E, which would then form our wave 4.
In that case, we would expect bullish targets afterwards 🚀.
We need to watch closely if the price reverses or breaks through our yellow Fibonacci zone 🟡.
For now, we are primarily looking for upside potential 🔼.
From our yellow wave 2, we saw a downward push, which could theoretically be our yellow wave 1 leading into yellow wave 2 and the yellow Fibonacci zone — essentially a five-wave move from wave 2 to wave 3.

XAUUSD BEARISH SETUP DEVEL0PING CHART PAATTERNXAUUSD – Bearish Setup Developing Below Resistance
Gold is currently trading near 3320, facing a strong resistance zone at 3350. Price action is showing signs of exhaustion as it approaches this key level.
🔻 Bearish Setup Overview:
Resistance: 3350 – watching for rejection or bearish confirmation candles.
First Entry Zone: 3290 – potential setup area once bearish momentum is confirmed.
Final Target: 3250 – despite the label, price action suggests a move even lower based on the arrow projection.
📉 This setup aligns with a possible trend continuation move to the downside, offering a clean risk-to-reward opportunity if resistance holds
🛡 Risk Management is Key – Wait for confirmation signals and manage your position size accordingly

TSLA: short as short can...below 200 certainly worth considering a reentry, but currently not sure if it will stop at 200 of 150.

USOIL LONG FROM SUPPORT
USOIL SIGNAL
Trade Direction: long
Entry Level: 65.00
Target Level: 66.37
Stop Loss: 64.09
RISK PROFILE
Risk level: medium
Suggested risk: 1%
Timeframe: 2h
Disclosure: I am part of Trade Nation's Influencer program and receive a monthly fee for using their TradingView charts in my analysis.
✅LIKE AND COMMENT MY IDEAS✅

Potential BullsFrom the EW concepts, it looks like a w5 of a leading diagonal is the next print out on a D1 Time frame, and currently is a w4 correction.
By Harmonics, looks like a BAT Pattern finalising H1, and therefore looks like it's time to warm the engines of the chopper ready to fly. Until then we're expecting a bullish move.

AUDUSD ~ Real Time Elliott Wave UpdatesThis is an update of an AUDUSD chart I had previously posted. We can see that Wave B(Blue) confirms at the 161.8% Fib. level and then sells. Wave B(Blue) pushed a bit higher than I had previously thought, but all other analysis remains the same. The sentiment is a for a sell. Check my previous post for more analysis on this pair.

GBPJPY Is Very Bearish! Sell!
Please, check our technical outlook for GBPJPY.
Time Frame: 45m
Current Trend: Bearish
Sentiment: Overbought (based on 7-period RSI)
Forecast: Bearish
The market is approaching a significant resistance area 198.994.
Due to the fact that we see a positive bearish reaction from the underlined area, I strongly believe that sellers will manage to push the price all the way down to 198.786 level.
P.S
Overbought describes a period of time where there has been a significant and consistent upward move in price over a period of time without much pullback.
Disclosure: I am part of Trade Nation's Influencer program and receive a monthly fee for using their TradingView charts in my analysis.
Like and subscribe and comment my ideas if you enjoy them!

Other Dominance (OTHER.D) –Liquidity Grab Before Potential Crash
🟡 Structural Analysis:
🔸 First, a CHoCH (Change of Character) occurred around the 7.87% level, formed by the break of the first key low and the failure to create a new high. This was the first warning sign of a trend change from bullish to bearish.
🔸 Then, by breaking the previous support low, the market formed an important BOS (Break of Structure) near 7.61%, confirming the start of a bearish trend.
🔸 After this break, the price entered a corrective/bullish phase and has now reached previous demand zones (now resistance). These areas are marked with yellow boxes on the chart. The current zone has strong resistance and a high probability of a bearish reaction.
⸻
🔍 Possible Scenarios:
1️⃣ If the price rejects the resistance zone at 7.95–8.00% and shows ranging candles or bearish engulfing candles, a bearish continuation and formation of LH (Lower High) can be expected.
2️⃣ If the price manages a strong breakout above resistance and closes above 8.00%, the current bearish structure may become invalidated and a new bullish trend could start.
⸻
🧠 Important Trading Notes:
• As long as the previous high (8.00%) is not broken, the dominant structure remains bearish.
• The best selling opportunity is near the current resistance with confirmation of bearish signals.
• If resistance is broken, proceed cautiously and wait for confirmation.
⸻
📊 Analysis by: CryptoPilot
#PriceAction #SmartMoney #CHoCH #BOS #DominanceAnalysis #CryptoPilot #MarketStructure #TechnicalAnalysis

XRPUSD Long, short, longWhole market is manipulated every minute... My prediction can be wrong but I see things this way right now ... Would be grateful for you to share your point of view ...

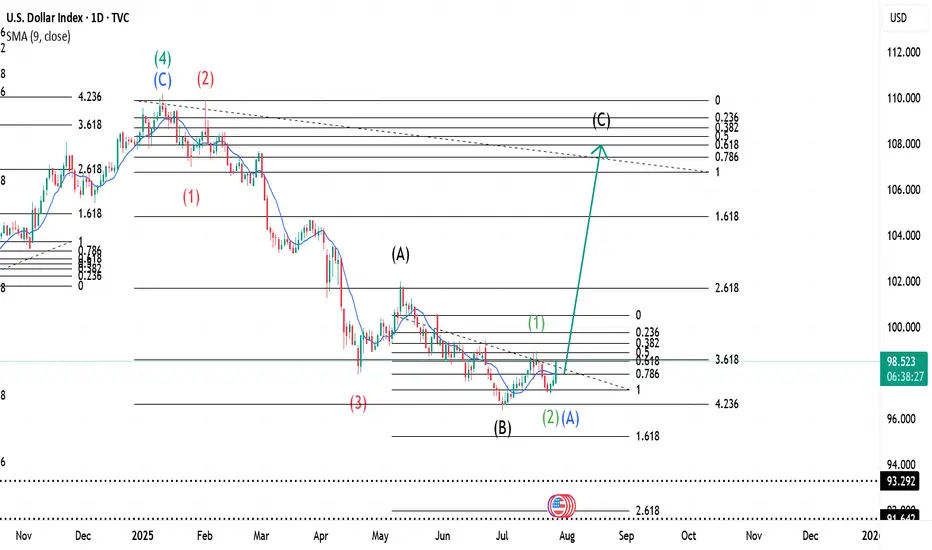
IS A HIGHER LOW SECURED ON THE DXY? LET'S FIND OUTIn this weekend analysis, I am still paying attention to the higher time frame downtrend on the dollar index while acknowledging the higher low support on the daily chart forming an inverse Head and Shoulders pattern. On the 4H and lower timeframes we have a strong ceiling made up of the 200SMA and 50SMA resistance level and need to break through from the 20SMA Line in the sand support. This weeks trade plan and thesis is for price to hold above the 20 SMA on the 4H timeframe expecting a potential dip to the zone of 97.128 (liquidity zone) and then bounce up to a weekly target of 97.7. This Thesis is INVALIDATED if a candle opens and closes below 97.015. I wish everyone a great trading week. Thank for supporting my publications and trade ideas. Cheers!!!

CADCHF: Market of Sellers
The recent price action on the CADCHF pair was keeping me on the fence, however, my bias is slowly but surely changing into the bearish one and I think we will see the price go down.
Disclosure: I am part of Trade Nation's Influencer program and receive a monthly fee for using their TradingView charts in my analysis.
❤️ Please, support our work with like & comment! ❤️

EURUSD_1D_SellEurodollar Analysis Medium-term Time Elliott Wave Analysis Style The market can enter a downtrend due to the completion of five ascending waves, which will be in the form of three ABC waves Important and main resistance number 1.1666 Target 1.0800

$ INDEX ~ Real Time Elliott Wave UpdatesThis is an update of a $ index chart I had previously posted. We see a Wave 1(Green) completed and a dip occurring. This dip is marked as Wave 2(Green) or Wave A(Blue). It has two readings because it could be a Zigzag, hence 2 or an A of a Flat, hence A. I will offer updates as the wave unfolds. All other analysis remains the same as I had previously posted and can be checked for references. Sentiment still remains buy.
SHELL/USDT - Bullish StructureContinues to maintain a bullish market structure, printing consistent higher highs (HH) and higher lows (HL)—a clear indication of sustained buyer control. Price is currently consolidating within an upward accumulation box, where buyers are actively absorbing supply on each dip.
This phase reflects strong accumulation in an uptrend, often preceding an impulsive breakout move

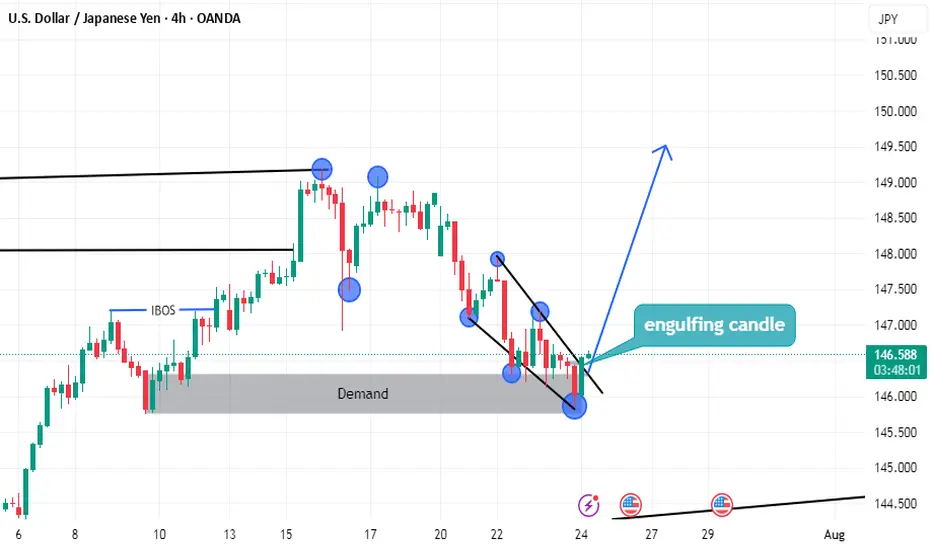
USDJPY LONG setupsimply
we have demand
and the price can't lower low
end we have break of structure on low time frame
and we have more but i don't have enough time to tell you
Look the photo well
NZD/CAD BULLS ARE GAINING STRENGTH|LONG
NZD/CAD SIGNAL
Trade Direction: long
Entry Level: 0.820
Target Level: 0.824
Stop Loss: 0.817
RISK PROFILE
Risk level: medium
Suggested risk: 1%
Timeframe: 2h
Disclosure: I am part of Trade Nation's Influencer program and receive a monthly fee for using their TradingView charts in my analysis.
✅LIKE AND COMMENT MY IDEAS✅

THETA Bounces Off Key Support – Eyes on Resistance!After months of holding above the key support zone, MYX:THETA is finally showing some strength.
Price is bouncing off the lows and heading toward a minor S/R zone.
If the bulls can break through this level, there’s a good chance we’ll see a move all the way up to the upper resistance line.
DYOR, NFA

GBPUSD BUY with money mangemnt Analyzing market structure and liquidity using Price Action and Smart Money Concepts. Focuse
done on key supply/demand zones and institutional order flow

NZDJPY: Free Trading Signal
NZDJPY
- Classic bullish pattern
- Our team expects retracement
SUGGESTED TRADE:
Swing Trade
Buy NZDJPY
Entry - 88.612
Stop - 88.524
Take - 88.757
Our Risk - 1%
Start protection of your profits from lower levels
Disclosure: I am part of Trade Nation's Influencer program and receive a monthly fee for using their TradingView charts in my analysis.
❤️ Please, support our work with like & comment! ❤️
