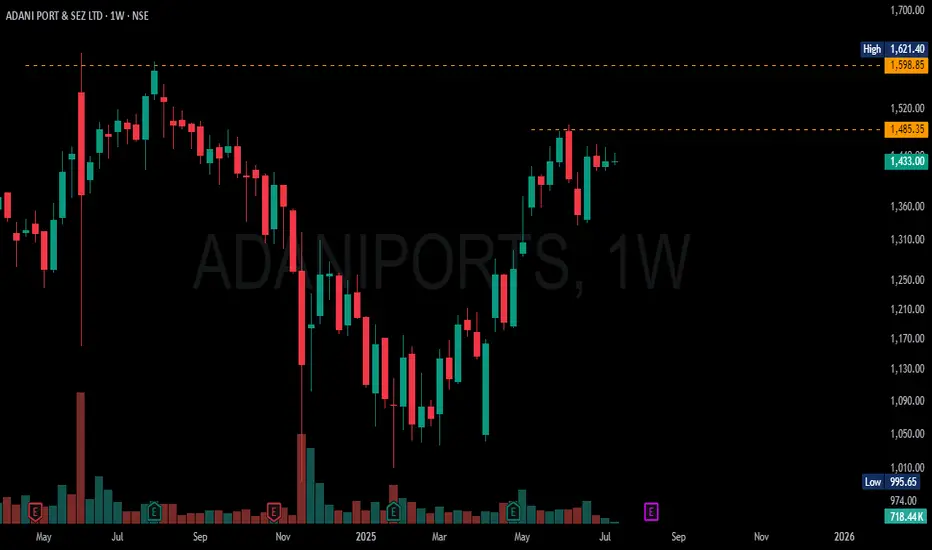
ADANIPORTS READY TO GOADANIPORTS is almost ready to break its nearest high and there after in the making of new high, as the volume feature shows investors are holding tight no sellers left, so there is short supply.
Wave Analysis
$GC / Gold - Weekend Update - 7/14Hello fellow gamblers,
We got both scenarios still active on gold, and I am bringing an update on both of them. It is a longer video, but hopefully the information can help you out on your trades.
- I want price to stay above 3363 for a bullish continuation.
- A strong rejection or loss of 3342.8 could initiate a bearish move that will validate our bearish scenario.
- Level to watch: 3418, 3363, 3283

#MORE/USDT A quick100 % return#MORE
The price is moving within a descending channel on the 1-hour frame, adhering well to it, and is on its way to breaking it strongly upwards and retesting it.
We have a bounce from the lower boundary of the descending channel. This support is at 0.02844.
We have a downtrend on the RSI indicator that is about to break and retest, supporting the upward move.
There is a key support area in green at 0.02720, which represents a strong basis for the upward move.
Don't forget one simple thing: ease and capital.
When you reach the first target, save some money and then change your stop-loss order to an entry order.
For inquiries, please leave a comment.
We have a trend of stability above the Moving Average 100.
Entry price: 0.02998
First target: 0.03140
Second target: 0.03334
Third target: 0.03582
Don't forget one simple thing: ease and capital.
When you reach the first target, save some money and then change your stop-loss order to an entry order.
For inquiries, please leave a comment.
Thank you.

#PEOPLE/USDT trading opportunity#PEOPLE
The price is moving within a descending channel on the 1-hour frame and is expected to break and continue upward.
We have a trend to stabilize above the 100 moving average once again.
We have a downtrend on the RSI indicator that supports the upward break.
We have a support area at the lower boundary of the channel at 0.2030, acting as strong support from which the price can rebound.
We have a major support area in green that pushed the price upward at 0.02000.
Entry price: 0.02070
First target: 0.02140
Second target: 0.02210
Third target: 0.02288
To manage risk, don't forget stop loss and capital management.
When you reach the first target, save some profits and then change the stop order to an entry order.
For inquiries, please comment.
Thank you.

#MYRO/USDT myro road map ( 1 H )#MYRO
The price is moving within a descending channel on the 1-hour frame and is expected to break and continue upward.
We have a trend to stabilize above the 100 moving average once again.
We have a downtrend on the RSI indicator that supports the upward break.
We have a support area at the lower boundary of the channel at 0.02040, acting as a strong support from which the price can rebound.
We have a major support area in green that pushed the price upward at 0.01900.
Entry price: 0.02087
First target: 0.02178
Second target: 0.02278
Third target: 0.02373
To manage risk, don't forget stop loss and capital management.
When you reach the first target, save some profits and then change the stop order to an entry order.
For inquiries, please comment.
Thank you.

Nifty holds important support zone.Nifty Analysis:
Support and Upside Targets
Market Recap
- Opening: Nifty opened flat, showing little directional bias at the start.
- Intraday Move: The index was dragged down towards the important support zone of 25,050–25,000
- Bounce: From this support zone, Nifty rebounded and managed to close above 25,080.
Technical Outlook:
Key Support Zone
- Support Range: 25,050–25,000
Significance: This zone has acted as a strong support, with buyers stepping in to defend it.
- Implication: As long as Nifty sustains above this zone, the short-term trend remains positive.
Upside Targets
If Nifty holds above the support:
- Immediate Targets: 25,200 and 25,300 are the next levels to watch for upward momentum.
- Long-Term Targets: 25,500 and 25,700 remain the key targets if the bullish momentum continues.
Summary
- Bullish View: Sustaining above 25,000–25,050 support zone keeps the index in a positive bias.
- Bearish Risk: A decisive break below 25,000 could lead to further downside.
- Strategy: Traders may consider staying long as long as Nifty holds above the support zone, watching for the mentioned targets.
Note: Always use appropriate risk management and monitor for any changes in market sentiment or global cues that may impact index movement.

Buy Trade Strategy for ONDO: Bridging Traditional FinanceDescription:
This trading idea focuses on ONDO, a cryptocurrency that sits at the intersection of traditional finance and decentralized finance (DeFi). As the native token of Ondo Finance, ONDO powers a platform that aims to bring real-world assets—such as bonds and treasuries—onto the blockchain, enabling institutional-grade investment access for a broader audience. With increasing regulatory clarity around tokenized securities and rising demand for stable yield-generating products, ONDO is well-positioned to benefit from the convergence of conventional finance and DeFi innovation.
The project’s focus on compliance, transparency, and sustainable yield sets it apart in a crowded market. However, the crypto space remains volatile, and ONDO’s value is influenced by broader market conditions, regulatory dynamics, and investor sentiment.
Disclaimer:
This trading idea is for educational purposes only and should not be considered financial advice. Trading or investing in cryptocurrencies like ONDO carries significant risks, including the possibility of total capital loss. Always conduct your own due diligence, consider your personal financial situation, and consult a financial advisor before making any investment decisions. Past performance is not a reliable indicator of future results.


EURUSD CONTINUATION UPSIDEI see 4H liquidity above, before it goes another high let the thing sweep first.
See entries below, always look for lower timeframe for entries at 15min-1min.
I only share more swing trades, so better capitalize it, I do swing too. GOODLUCK.
Don't be a 90% trader who gamble daily, try with swing. specially on my GOLD charts updates.
ciao.. keep winning fellas, you can also reach me on my X account. I do share too

Buy Trade Strategy for POL: Backing the Future of Web3 GovernancDescription:
This trading idea highlights POL, the new token powering the next evolution of the Polygon ecosystem, which is shifting toward a more robust and scalable multichain architecture. Designed to eventually replace MATIC, POL introduces advanced staking and governance capabilities that aim to unify and secure various Layer 2 solutions under one interoperable umbrella. Its core function is to support validators across multiple Polygon chains, making it an essential asset for the future of decentralized Web3 infrastructure.
The migration to POL is more than a technical upgrade—it's a strategic move to strengthen long-term network sustainability and user empowerment. As adoption of Polygon’s technology continues to grow across DeFi, gaming, and enterprise solutions, POL is positioned to become a fundamental component of the next generation of blockchain governance.
Disclaimer:
This trading idea is for educational purposes only and is not to be considered financial advice. Investing in cryptocurrencies, including POL, carries a high level of risk and may result in the complete loss of capital. Always conduct your own due diligence, evaluate your personal financial situation, and consult a licensed financial advisor before making investment decisions. Past performance is not indicative of future results.

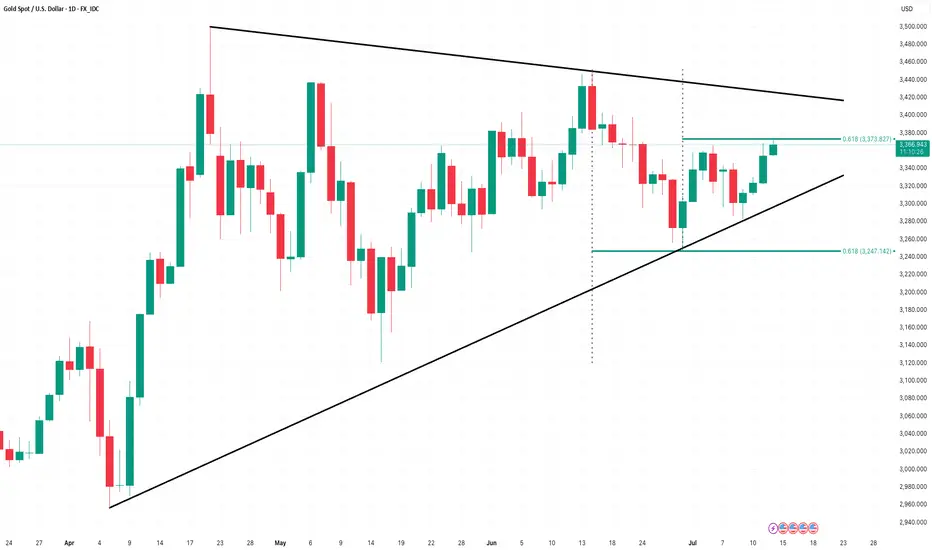
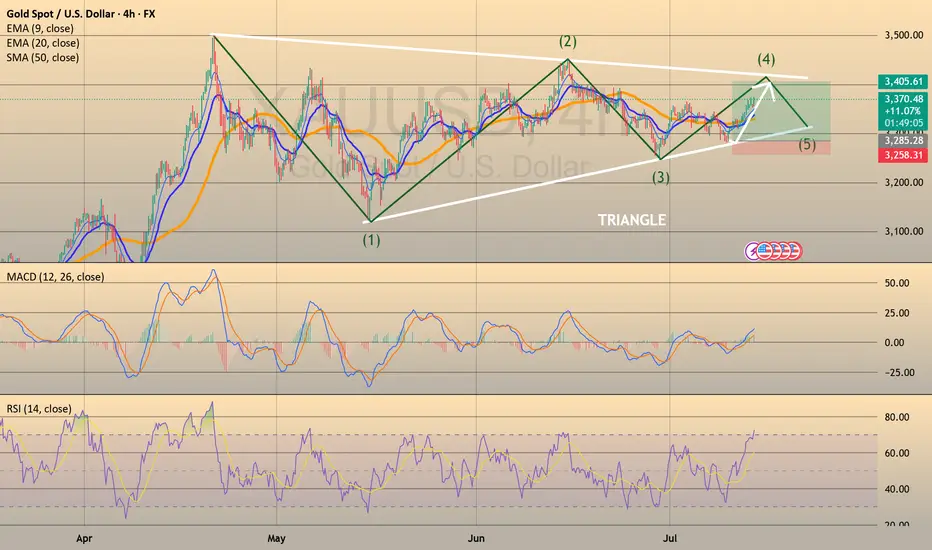
Gold is currently at a critical decision point.Key Technical Insights (Gold)
1) Fibonacci Confluence Zone:
Now gold price action is currently compressed between two overlapping 61.8% Fibonacci retracement levels:
- Swing Low Retracement (61.8%) from the prior downtrend leg
- Swing High Retracement (61.8%) from the recent bullish move
This dual Fibonacci alignment reflects a high tension equilibrium between bullish and bearish forces, a typical precursor to breakout volatility.
2) Chart Pattern – Symmetrical Triangle:
Price is also developing a symmetrical triangle pattern, signaling a period of consolidation and potential energy buildup.
This structure usually leads to a breakout in the direction of the prevailing longer-term trend, which in this case remains bullish.
3) Momentum & Volatility:
RSI is holding in the mid-50s range — confirming market indecision.
Volume is contracting, consistent with the compression phase before expansion.
4) Mid-Term Outlook: Bullish Bias with Caution
Based on current technical conditions and macroeconomic context, the mid-term outlook for gold remains bullish, but requires patience and confirmation.
5) Strategic Levels to Watch:
- Breakout zone: $3,375 – $3,385
- Upside targets (if breakout holds): $3,435 → $3,495 → $3,520
- Bearish invalidation: Break below $3,240 would negate this bullish setup.
Gold is currently at a critical decision point compressed between technical resistance and structural support, forming a triangle at Fibonacci confluence. While the breakout direction is yet to be confirmed, probability favors a bullish resolution in alignment with the macro uptrend.
Traders and investors should remain patient, wait for confirmation, and manage risk accordingly.
Rally! : My Target in Sight, and It’s Only a Matter of TimeInverted Head&Shouldres -- Breakout -- Double top -- Retest Neckline -- BOOM !!


EURUSD Will Go Lower! Sell!
Here is our detailed technical review for EURUSD.
Time Frame: 4h
Current Trend: Bearish
Sentiment: Overbought (based on 7-period RSI)
Forecast: Bearish
The market is approaching a significant resistance area 1.168.
Due to the fact that we see a positive bearish reaction from the underlined area, I strongly believe that sellers will manage to push the price all the way down to 1.159 level.
P.S
Please, note that an oversold/overbought condition can last for a long time, and therefore being oversold/overbought doesn't mean a price rally will come soon, or at all.
Disclosure: I am part of Trade Nation's Influencer program and receive a monthly fee for using their TradingView charts in my analysis.
Like and subscribe and comment my ideas if you enjoy them!

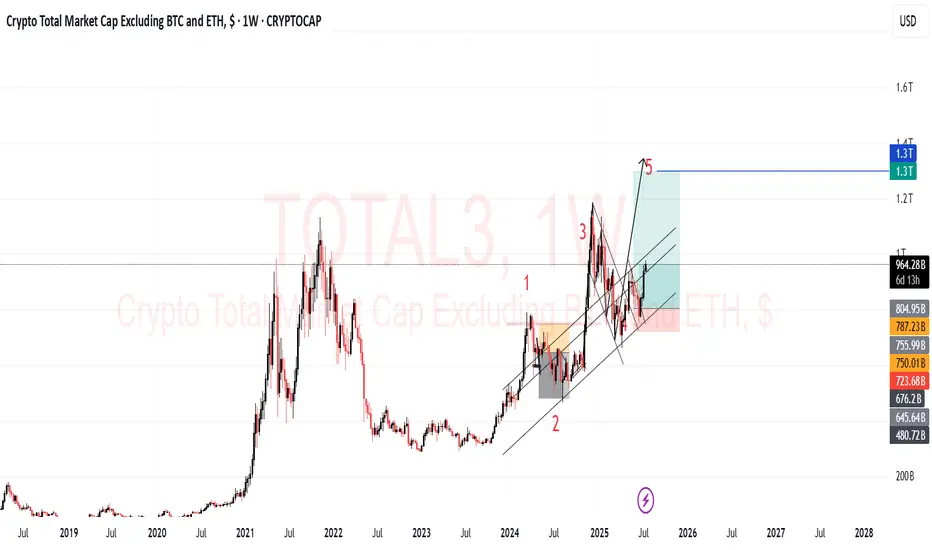
BTC PRICE PROJECTION ANALYSIS. HOW MUCH FURTHER UPSIDE???In this video, I'm just excited to see the cup and handle analysis done on October 19th, 2024 reach it's target. It's amazing!
I decided to do some predictive analysis using Elliott wave concept and Fibonacci extensions to see how far Bitcoin will go.
I am convinced that on the timeframe analyzed, this is onto a wave 5 and so pullbacks are going to be a great opportunity to grab some while a lot people will think this is madness.
My cup and handle analysis and targets getting hit has taught me a great lesson to always look at the bigger picture while taking advantage of the micro view.
Cheer to all the longs and Bitcoin believers. With only 1.11 Million Bitcoin available for grabs and Institutional confidence behind the asset, I am confident the projected price targets are highly likely and in sight soon.

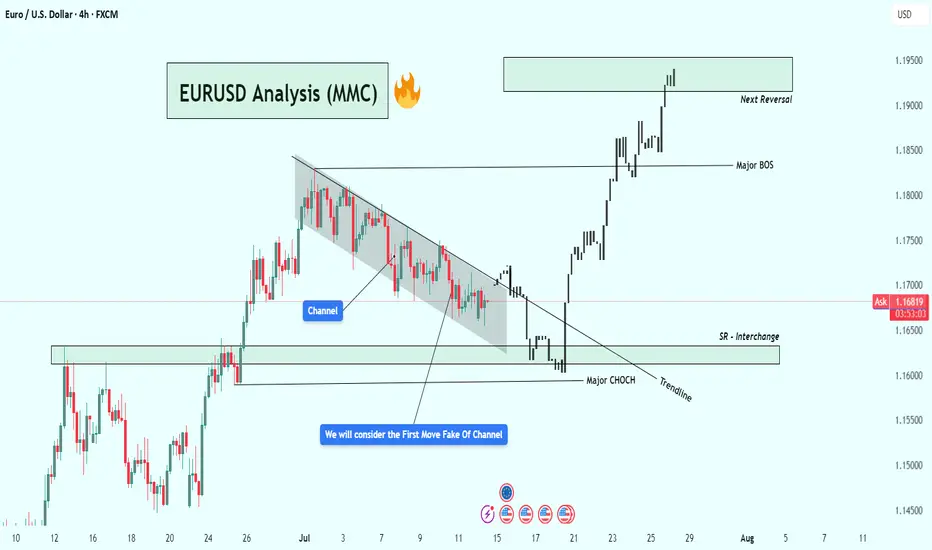
EURUSD Analysis – Smart Money Breakout + Reversal Zone in Play🔹 1. Bearish Channel & Liquidity Trap Setup
Price action from late June into mid-July formed a clearly defined descending channel, with consistent lower highs and lower lows. This structure likely attracted retail traders into short positions, expecting continued downside.
💡 Key Insight: The initial breakout of the channel was a fake move — often referred to as a liquidity grab or inducement. This is typical in smart money models where institutions trap early traders before the real move begins.
🔹 2. Major CHoCH (Change of Character)
Shortly after the fakeout, price sharply reversed and broke a major internal structure level, giving us our first CHoCH confirmation. This is a critical event in SMC, signaling a possible trend reversal from bearish to bullish.
Why it matters: A CHoCH after a channel + fakeout combo is a strong reversal signal, especially when supported by volume and aggression.
Visual cue: Look at the bullish engulfing momentum candle post-fakeout — this was the moment smart money entered.
🔹 3. Trendline Break + SR Interchange (Support/Resistance Flip)
Following the CHoCH, price broke the trendline and came back down to test a high-probability SR Interchange Zone — an area where previous resistance turned into fresh support.
This zone also aligns with the order block and inefficiency area, making it a premium entry for institutions.
Notice how price respected the zone before launching aggressively upward.
🧠 Note: This was the cleanest entry point in this setup — combining structure break, liquidity, and a demand zone.
🔹 4. Major BOS (Break of Structure)
After the retest, EURUSD broke the last major lower high, confirming a Bullish BOS (Break of Structure). This is where many traders realized the trend had shifted.
Market sentiment flipped from bearish to bullish.
Momentum increased, indicating institutional buying pressure.
🔹 5. Next Target: Reversal Zone (Supply Area)
Price has now reached a critical supply zone (1.1930 – 1.1970) where the next major reaction is likely to occur. This area was previously a strong rejection point, and it aligns with a potential higher timeframe supply zone.
⚠️ Watch for:
Bearish rejection wicks
Liquidity sweeps above highs
Bearish engulfing or mitigation patterns
CHoCH on lower timeframes (1H, 15m)
✅ Key Trading Takeaways:
Liquidity Trap: Retail was trapped inside a clean channel.
Fakeout Move: Induced shorts were wiped out.
CHoCH & BOS: Clear reversal pattern with momentum.
Perfect Retest Entry: Price retested demand and launched.
Current Area = Supply/Distribution: Great place to look for shorts or take profits.
📌 Possible Trading Plans:
🔸 Plan A: Reversal Short (Countertrend)
Entry: Inside 1.1930–1.1970 zone
Confirmation: Bearish PA + LTF CHoCH
TP1: Previous BOS (~1.1830)
TP2: Demand zone retest (~1.1650)
SL: Above 1.1980–1.2000
🔸 Plan B: Continuation Long (Breakout Bias)
Entry: Break + Retest above 1.2000 psychological level
SL: Below breakout wick
TP1: 1.2100
TP2: 1.2200+
🔖 Concepts Applied:
Smart Money Concepts (CHoCH, BOS, liquidity sweep)
Price Action Structure
Trendline break and retest
Supply & Demand Zones
Support/Resistance Flip (SR Interchange)
Volume + Momentum Confirmation
🔄 Conclusion:
This chart demonstrates a classic Smart Money narrative:
“Trap the retail, shift the structure, drive price into premium, then reverse.”
We're now at a make-or-break supply zone. Watch price behavior carefully — this is where smart traders either secure profits or prepare for the next leg.
IS GOLD RISING TO THREE WEEKS HIGH ?Fundamental analysis
the Gold surged to approximately $3,360 per ounce on Monday, extending its bullish run for a fourth consecutive session. This upward momentum was primarily driven by President Trump's latest tariff announcements, which ignited a flight to safety among investors, bolstering demand for the precious metal.
Trump's communications to the EU and Mexico outlined a 30% tariff on their imports, citing their trade deficits with the US as a "major threat" to national security. This move builds upon last week's broader tariff hikes affecting over 20 nations, including key players like Japan, South Korea, Canada, and Brazil, notably a 50% duty on copper imports. These new measures are set to be implemented from August 1st.
From a technical perspective, $3,360 now acts as a crucial immediate resistance level. A sustained break above this point could see gold targeting the $3,380 - $3,400 resistance zone. Conversely, should the safe-haven demand wane, initial support is likely to be found around the $3,340 area, with a more significant support floor at $3,320. Traders will be closely monitoring this week's slew of critical US economic reports – including CPI, PPI, industrial production, and retail sales – for further cues on the Federal Reserve's monetary policy trajectory, which could significantly influence gold's future price action.
entry point ( 3365)
target 1 ( 3380)
target 2 (3400)
stop loss (3350)

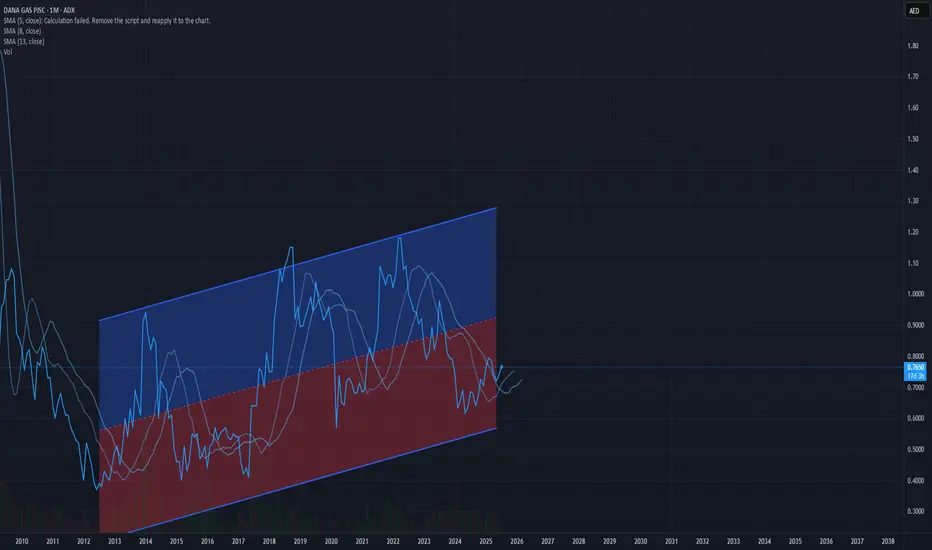
on an up treand from the historical data of the past few years adding the dividents of this year looking very appeling and on an up treand looks to reach the 1-1.2 target before the end of the year
over all a good time to enter on this uptrend
Bitcoin still a long: Target remains at $124,632This is an update to the wave counts for Bitcoin. We are in the final wave 5 of 5 of 3 and the target remains at around $124,632.
The stop can be adjusted to around $120,433, below the wave 2 of 5 of 3.

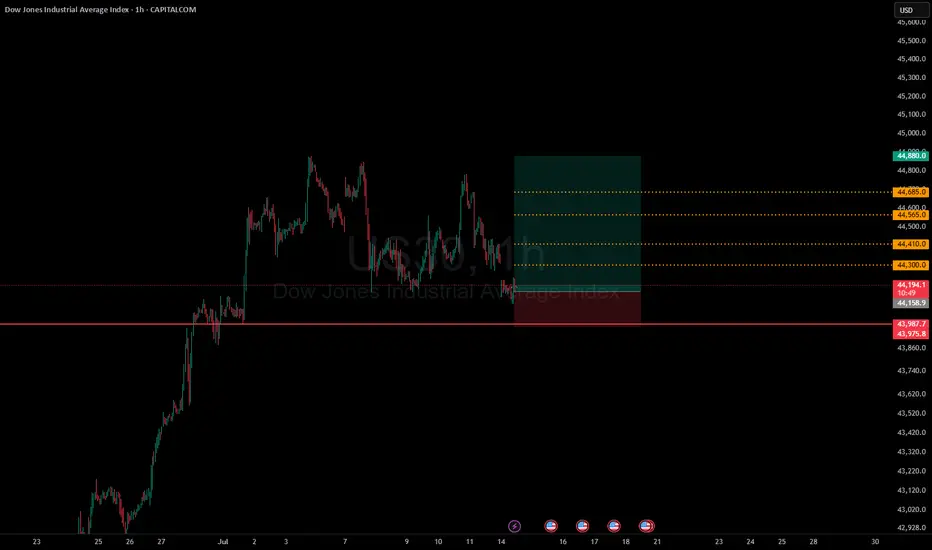
XAUUSD - POSSIBLE BIG LONG MIDTERM TRADESAXO:XAUUSD
XAUUSD - POSSIBLE BIG LONG MIDTERM TRADE📈
XAUUSD has gone the half of my take profit, so I decided to close 1/2 of my position here and put my stop loss at an entry price. Still, we have good chance to go towards upper border of the triangle, just want to reduce the risk.
XAUUSD has been trading sideways and has formed a Triangle pattern since April 23d. Looks like the price found a balance between supply and demand. Currently the price is sitting on a lower border of a triangle and potentially is forming the Wave D, according to Elliot Triangle Wave formation.
Trade cautiously!
NZDCAD Long Trade 1:1.37 OANDA:NZDCAD Long Trade, with my back testing of this strategy, it hits multiple possible take profits, manage your position accordingly.
Institutions are Bullish, price is at good support, buying pressure is good also.
Risking 1% to make 1.37%
Note: Manage your risk yourself, its risky trade, see how much your can risk yourself on this trade.
Use proper risk management
Looks like good trade.
Lets monitor.
Use proper risk management.
Disclaimer: only idea, not advice
