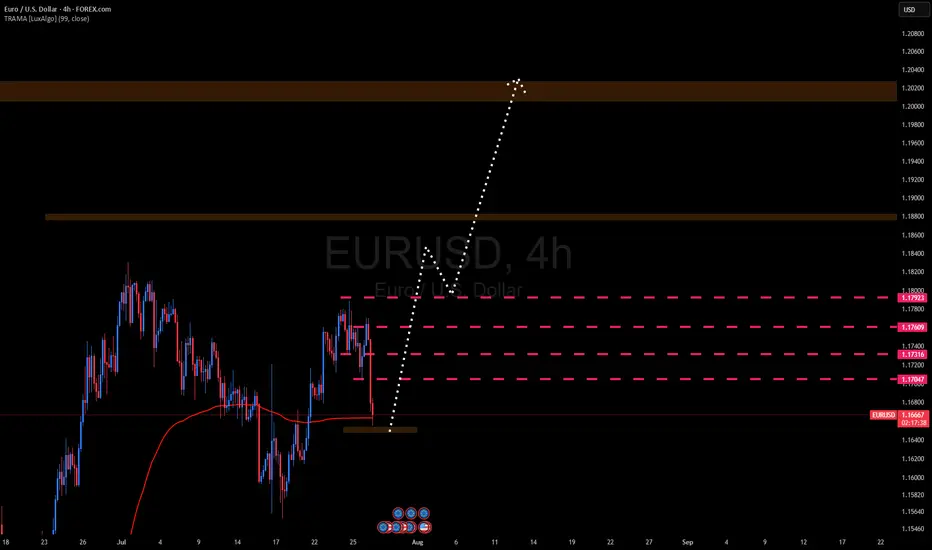
EURUSD BULLISH TREND 28-15 JUL-2025EUR/USD is expected to enter a bullish phase, with an upward move likely to start from the 1.16557–1.16486 range. The pair is projected to rise throughout the week, potentially reaching the 1.20051–1.20200 levels. As long as it continues toward that zone, the trend remains bullish
Wave Analysis
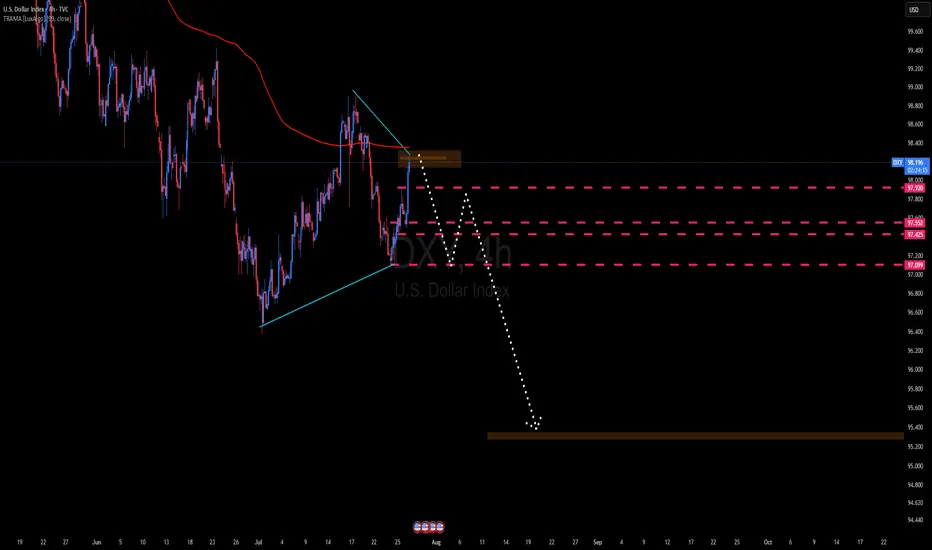
DXY Bearish Trend The DXY is expected to enter a bearish phase, with a potential decline starting from the 98.26–98.35 range, and possibly extending down to the 95.20–94.50 levels, which are anticipated to act as key support zones during the upcoming downtrend
Eigen Labs CEO CriticalMilestone ReducesETH Scalability TradeoffIn a major leap toward next-generation blockchain infrastructure, Eigen Labs, the developer behind EigenLayer, has announced the achievement of what its CEO describes as a “critical milestone” in the evolution of Ethereum scalability—reducing the long-standing trade-off between decentralization, security, and performance.
Speaking at the Ethereum Scaling Summit in Seoul, Eigen Labs CEO Sreeram Kannan unveiled the platform's updated modular architecture, which enables “restaked security” for a broad spectrum of Layer 2 networks and decentralized applications.
“Scalability without compromise has always been the holy grail,” Kannan noted. “This milestone changes the calculus—we no longer have to sacrifice decentralization or security for throughput.”
The Challenge: Balancing the Blockchain Trilemma
Since its inception, Ethereum has faced the so-called blockchain trilemma: optimizing only two out of three key elements—security, scalability, and decentralization. While Layer 2s such as Arbitrum and Optimism address throughput, they often introduce trade-offs in validator assumptions or operational complexity.
EigenLayer aims to address this through a novel re-staking mechanism, which leverages the security of Ethereum’s mainnet by allowing ETH stakers to “re-stake” their assets to secure other networks and services.
This innovation could radically expand Ethereum’s trust footprint without duplicating infrastructure or introducing centralized checkpoints—a persistent issue with several scaling models.
Institutional Interest and Market Significance
Venture capital and institutional crypto funds are watching closely. In Q2 2025, Eigen Labs closed a $100M Series B round, with participation from a16z, Polychain, and Jump Crypto. The firm’s long-term roadmap includes interoperability modules that will allow Ethereum-based Layer 2s to share consensus and security guarantees—a breakthrough for composability and capital efficiency.
“EigenLayer is fast becoming a backbone protocol,” says Nadia Liu, a partner at crypto VC firm Framework Ventures. “By minimizing fragmentation, it unlocks value across the entire Ethereum ecosystem.”
What It Means for Developers and Enterprises
For developers, EigenLayer offers a plug-and-play model for building secure applications without launching bespoke validator sets. For enterprise clients, the appeal lies in a more cost-efficient, composable Web3 stack, opening the door to scalable DeFi, gaming, and tokenized asset platforms.
Kannan emphasized that several pilot integrations are already underway with major DeFi protocols and data availability layers. While he did not name them, sources close to the matter hint at collaborations with StarkWare, Celestia, and Coinbase’s Base.
Looking Ahead
The broader implications of EigenLayer’s progress are hard to overstate. If adopted at scale, the protocol could standardize how Ethereum-based projects achieve security, replacing fragmented systems with a unified, market-driven security layer.
With this milestone, Eigen Labs may have just shifted the scalability conversation—from a compromise-based model to one of scalable consensus as a service.
“The modular era is here,” Kannan concluded. “And it's one that doesn’t ask builders to choose between performance and principles.”

AUD/CAD SELLERS WILL DOMINATE THE MARKET|SHORT
Hello, Friends!
We are now examining the AUD/CAD pair and we can see that the pair is going up locally while also being in a uptrend on the 1W TF. But there is also a powerful signal from the BB upper band being nearby, indicating that the pair is overbought so we can go short from the resistance line above and a target at 0.885 level.
Disclosure: I am part of Trade Nation's Influencer program and receive a monthly fee for using their TradingView charts in my analysis.
✅LIKE AND COMMENT MY IDEAS✅

APT - HUGE POTENTIAL (130+% SPOT) You probably forgot about this altcoin but it is justified. Downtrend since 2023 and lower highs, lower lows but....
If we look more close and use tool fixed price volume we can see that price is above VAL (Value area low), we had break through but price returns..Also good reaction of FVG (Fair value gap).
Now, we can try buy this coin and have some stop lose. Price is in range 172 days and all people forget abut this coin. Analysis is right only if we close daily candlestick about 6$.
Stop lose can be below 4.4$ which is 6-7% of losing.
Second entry is monthly level at 3.3 and stop lose should be below the lowest low 3$.
For me is great opportunity because risk reward is excellent.
Ivan

GBPUSD Will Go Lower! Short!
Take a look at our analysis for GBPUSD.
Time Frame: 2h
Current Trend: Bearish
Sentiment: Overbought (based on 7-period RSI)
Forecast: Bearish
The price is testing a key resistance 1.358.
Taking into consideration the current market trend & overbought RSI, chances will be high to see a bearish movement to the downside at least to 1.353 level.
P.S
The term oversold refers to a condition where an asset has traded lower in price and has the potential for a price bounce.
Overbought refers to market scenarios where the instrument is traded considerably higher than its fair value. Overvaluation is caused by market sentiments when there is positive news.
Disclosure: I am part of Trade Nation's Influencer program and receive a monthly fee for using their TradingView charts in my analysis.
Like and subscribe and comment my ideas if you enjoy them!

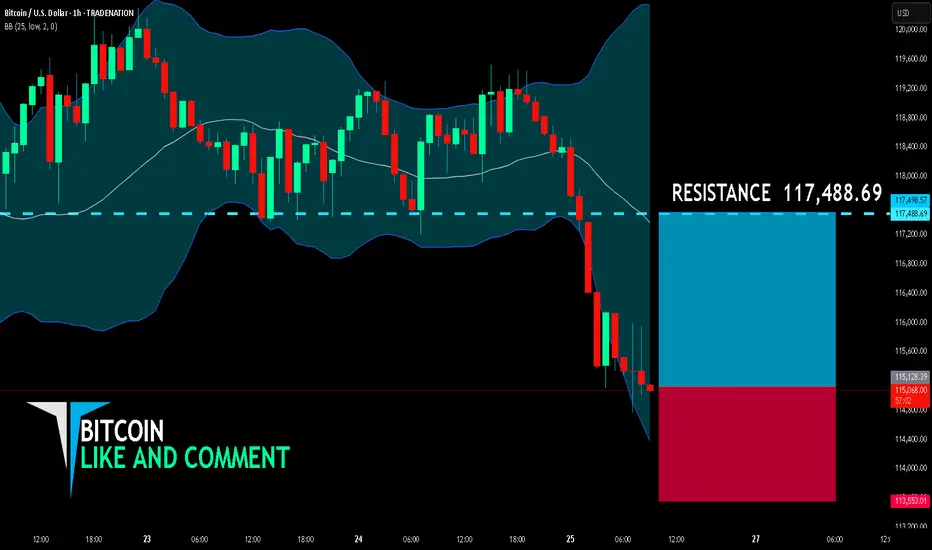
BITCOIN BULLS ARE GAINING STRENGTH|LONG
BITCOIN SIGNAL
Trade Direction: long
Entry Level: 115,128.39
Target Level: 117,488.69
Stop Loss: 113,553.01
RISK PROFILE
Risk level: medium
Suggested risk: 1%
Timeframe: 1h
Disclosure: I am part of Trade Nation's Influencer program and receive a monthly fee for using their TradingView charts in my analysis.
✅LIKE AND COMMENT MY IDEAS✅
Gold. Bull Trap "triangle". 28/July/25XAUUSD, by checking gold latest speed of chart with its cycle. we might have a bull 'trap" triangle. A base for rallying to ATH again before a very deep pullback toward 233 Daily EMA which have not been "touched" for long time...

XAUUSD (Gold/USD) – 1H Chart Analysis (July 28, 2025)🔍 Technical Summary:
Market Structure Shift (MSS) detected after liquidity (LQ) grab.
Price formed a bullish break of structure confirming a possible trend reversal.
Entry taken near support (after LQ), targeting a supply zone above.
📊 Key Chart Elements:
LQ (Liquidity Grab):
Price swept previous lows, triggering stop-losses before reversing.
MSS (Market Structure Shift):
Break of internal structure confirms potential upside movement.
Blue Zone (Target Area):
A clear supply zone, likely to act as resistance.
TP (Take Profit) placed just below this zone.
SL (Stop Loss):
Positioned below the recent low (LQ) – tight risk management.
📈 Outlook:
Expecting bullish continuation towards 3,380+ zone.
If price respects support and structure holds, long entries remain valid.
Watch for reaction at the supply zone – potential rejection or consolidation.
⚠️ Disclaimer:
This is not financial advice. Always do your own research before trading.

GOLD BUY M15 Gold (XAUUSD) 15-Minute Chart Analysis – July 28, 2025
Price is currently forming a potential bullish setup after a recent drop. A bullish order block area has been highlighted (purple zone), indicating a possible demand zone where buyers might step in.
Entry Zone: Around 3333 – current price region.
Stop Loss (SL): 3322 (placed below the demand zone).
Target: 3350 – marked as the main bullish target.
The expected move is a bounce from the demand zone, with multiple small retracements, leading to a potential breakout toward the resistance zone around 3350.

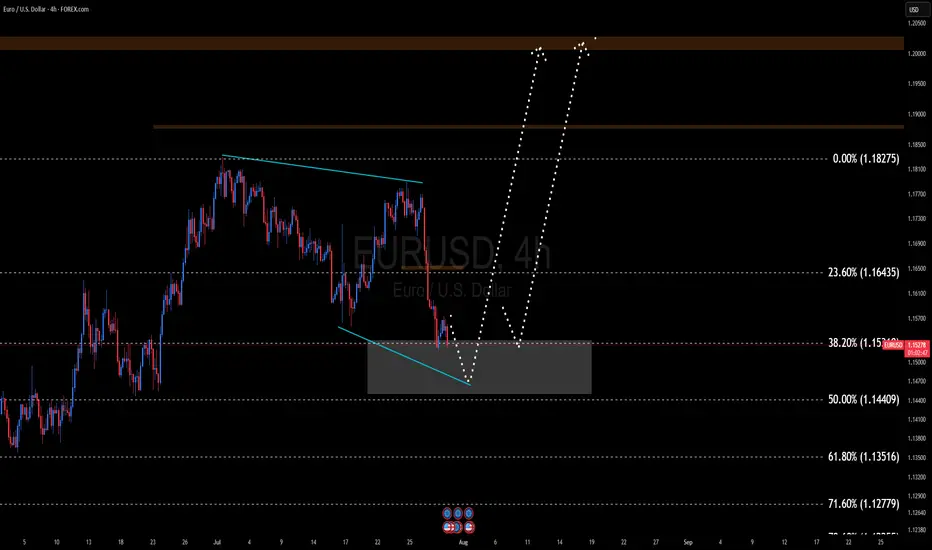
EURUSD BULLISH TREND EUR/USD is currently in a transitional phase and appears to have completed its retracement . It is expected to enter a bullish trend, with a possible breakout from the 1.14500 – 1.15200 range. These levels may serve as key turning points for the upcoming movement.
CHFJPY LONGReason for entry
1. Regular flat structure
2. Ending structure in play
3. Gap 183.065 taken
4. Liquidity at the top (equal highs)
5. MACD divergence
Strategy: Engulfing candle should take out 184.058 to enter
Take Profit : 186.023
Stop loss: 183.211
Entry: 184.058/183.587 (GAP)
Once 185.208 is taken out, place trade at BE or Take profit

DXY Bulls Ready — Can Powell Spark the Rally?📊 DXY Pre-FOMC Outlook
In my previous analysis released on Monday, I expected the Dollar Index to fill the gap around the 98.60 zone and range below the key red line at 99.429.
Now, with less than 8 hours left until the highly anticipated FOMC rate decision, it’s time to take a closer look at tonight’s event and what it could mean for the markets.
From a purely technical perspective — setting the news aside — the Dollar Index looks ready to break through the crucial 100 level and kick off a strong bullish rally.
However, recent political pressure from Trump urging rate cuts, along with visible tension between him and Fed Chair Jerome Powell, has created uncertainty. If it weren’t for these conflicting signals, I would’ve confidently expected a clean breakout above 100.
As much as I enjoy trading news-driven events, I’ll likely stay out of the market tonight and observe from the sidelines. The setup is tempting, but the dual narratives make it risky.
That said — if you ask for my final take — I believe the stage is fully set for a bullish dollar and a corresponding drop in gold, EUR, GBP, and other major assets.
Let’s see how it plays out. 👀💥

MSFT & META Daily Trade SetupsIn this update we review the recent price action in Microsoft & Meta and identify the next high-probability trading opportunities and price objectives to target. To review today's video analysis clcik here!

XAUUSD: July 30th Market Analysis and StrategyGold Technical Analysis:
Daily Chart Resistance: 3351, Support: 3300
4-Hour Chart Resistance: 3340, Support: 3310
1-Hour Chart Resistance: 3334, Support: 3315.
Trading risk will increase today. We will focus on the Federal Reserve's interest rate decision and the ADP employment data, which are expected to increase market liquidity. If trading, please avoid news releases.
On the daily chart: Bollinger Bands are moving horizontally, with gold prices trading above the lower band. The MACD indicator has formed a downward death cross, indicating a release of bearish momentum. The RSI indicator has fallen back into the overbought range of 50-40, indicating a clear bottoming out and rebound in gold prices.
On the 4-Hour Chart: Bollinger Bands are narrowing, with gold prices trading near the middle band. The MACD indicator is beginning to turn upward, and the RSI is showing an oversold rebound. Gold prices are poised for an upward rebound! The NY market is focusing on the $3351 resistance level above and the $3308 support level below.
SELL: 3351near
BUY: 3315near

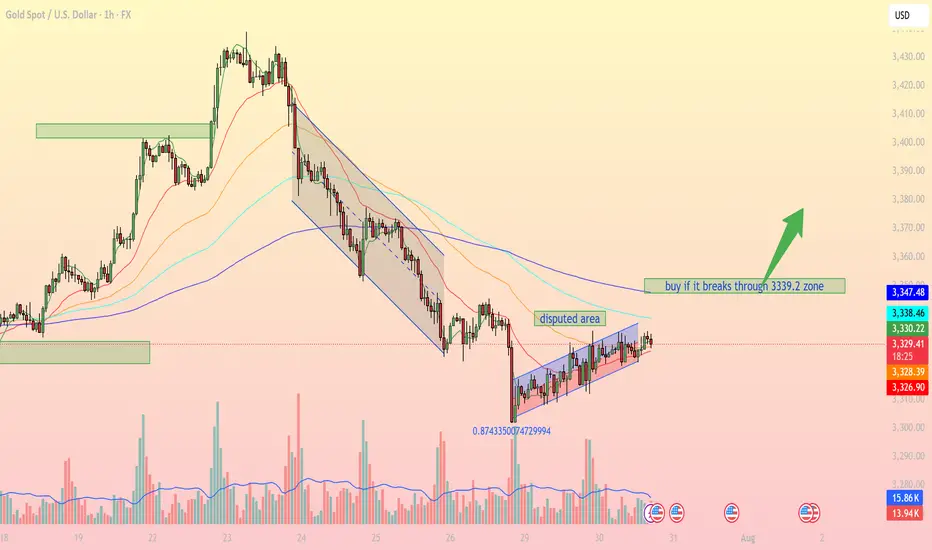
Accumulation pattern awaiting breakout confirmationIntraday Outlook: Accumulation pattern awaiting breakout confirmation
On the 1H timeframe, XAUUSD is forming a clear consolidation pattern within a narrow ascending channel after falling from a prior distribution zone. Buyers are attempting to regain control, but strong resistance remains around the 3,339 – 3,347 USD area.
1. Technical Breakdown:
Trendline & Channel: Price is currently moving inside a small rising channel, indicating a short-term bullish bias, though momentum remains limited.
EMA Dynamics: EMA 20, 50, and 100 are beginning to converge, signaling a potential breakout. A bullish EMA crossover (EMA20 > EMA50) could confirm stronger upward momentum.
Disputed Area: This zone represents heavy indecision between bulls and bears. A clear breakout above or below is needed for directional clarity.
Fibonacci Level: The 0.874 retracement level from the recent low shows strong buyer interest, potentially forming a short-term bottom.
2. Key Support & Resistance Levels:
3,339.2 USD Major resistance – needs to be broken for bullish continuation
3,347.4 USD Next resistance if breakout occurs
3,328.2 USD Immediate support (current price zone)
3,326.7 USD Strong support if price retraces
3. Suggested Trading Strategies:
Scenario 1 – Breakout Buy Strategy:
Entry: Buy if price breaks and closes above 3,339.2 USD on the 1H chart.
Stop Loss: Below 3,328 USD.
Take Profit: First target at 3,347, extended targets at 3,358 and 3,372 USD.
Scenario 2 – Pullback Long Entry:
If price fails to break resistance, consider buying the dip near the 3,326 – 3,328 USD support zone for a better risk-reward setup.
Scenario 3 – Breakdown Sell Setup:
If price breaks below 3,326 USD and exits the channel, a bearish move towards 3,295 – 3,300 USD becomes likely.
Gold is in a key consolidation phase, with the 3,339 USD resistance acting as the decisive breakout zone. Traders should closely monitor price action, volume, and EMA behavior to catch the next directional move.
Follow for more trading strategies like this. Save this post if you find it useful!
High R:R Play on PEPE — 3.2X Reward WaitingThe PEPEUSDT 4H chart clearly shows that the market has been in a downtrend since late July, forming consistent lower highs and lower lows. The trend indicator lines (red above price, blue below) suggest that bearish momentum has been dominant for several sessions.
From July 28 onwards, price tested the short-term moving average multiple times but failed to break above it, confirming that sellers remain in control. However, over the past few candles, we can see that price has started to slow its decline and is now consolidating near the 0.00001145 support zone. This is an area where buyers have previously stepped in, making it a potential pivot point for a short-term bounce.
The marked trade idea on the chart suggests a countertrend long trade. This makes sense because the market is oversold on lower timeframes and showing signs of accumulation. The upside target is set just below a prior reaction level at 0.00001289, which has historically acted as resistance. This creates an opportunity for a clean bounce if buying pressure increases.
Trade Setup
• Entry: 0.00001145 (at current support)
• Stop Loss: 0.00001100 (below recent swing low)
• Take Profit: 0.00001289 (targeting prior resistance)
• Risk-to-Reward Ratio: ~1:3.2
• Trade Bias: Short-term countertrend long

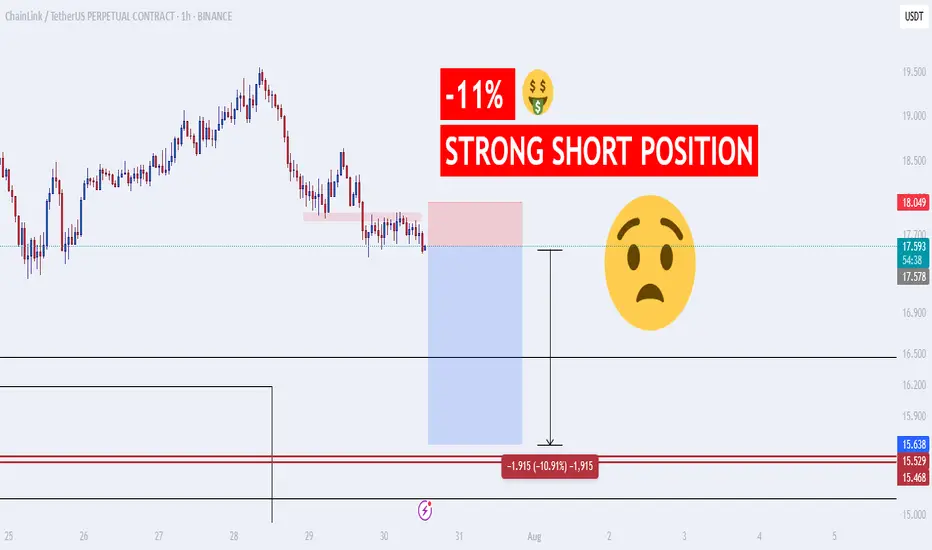
OMG!!! Srtong Short Position!! -10%The price of BIST:LINK is expected to drop by 10% soon. If you enter a short position with 10x leverage, you can potentially make a 100% profit and double your capital! This is an excellent opportunity. Strong sell signal: just take a look at the chart.
DOGE at Decision Point Dogecoin is forming a descending triangle pattern on the 2H chart, indicating a potential breakout setup.
A close above the resistance trendline ($0.23) could trigger a bullish move, while a breakdown below support ($0.215) may signal a bearish continuation. RSI and volume are suggesting weakening momentum — wait for confirmation before entering.

OIL - shortFollowing our previous forecasted up-move, from now on we will switch to looking for sell setups only. We would normally expect the C wave of the corrective pattern retrace all the way to the 0.618 fib of the downward impulse, as the A wave had already retraced to the 0.382. But that isn't necessarily always the case. As long as the C retracement has broken the top of the A retracement, the pattern formally speaking can be complete. We will not be looking for further buys, therefore, from now on. Even if it does continue to the 0.618, we will skip the eventual buy and focus on the sells. At the same time, because the eventuality of more up exists, we will wait for a proper sell setup before we enter any short position. Updates will follow.

GOLD → False breakdown 3310. Consolidation ahead of news...FX:XAUUSD is forming a false breakdown of support at 3310, thereby confirming the boundaries of the trading range. The dollar is testing strong resistance within the global downtrend. And in the near future, we can expect more economic news...
Gold is trading below the key resistance level of $3345, remaining in a narrow range ahead of the Fed's decision and US GDP data for Q2. Weak data could reinforce expectations of a rate cut and support gold, while strong data would strengthen the dollar. The Fed is likely to keep rates at 4.25–4.5%, with markets pricing in a 64% chance of a 25 bps cut in September. Investors are waiting for signals from Jerome Powell, with a possible split within the Fed: some members may support calls for easing, which would be a driver for gold.
Technically, the situation on D1 is quite interesting. Gold is still below the previously broken trend resistance, but there is no continuation of the momentum. Buyers are reacting to support at 3310, but the market is stagnating due to uncertainty ahead of the news...
Resistance levels: 3345, 3375
Support levels: 3320, 3310, 3287
Thus, from a technical analysis perspective, I expect a retest of 3345, followed by a pullback to support at 3320, from which gold could move higher (if the bulls take the initiative), but if 3320 breaks and 3310 comes under pressure, gold could test 3287. Again, the emphasis is on trend support (the upward line) in the 3335-33450 zone. If the price can consolidate in this zone, we will have confirmation that the price has returned to the boundaries of the upward trend.
Best regards, R. Linda!

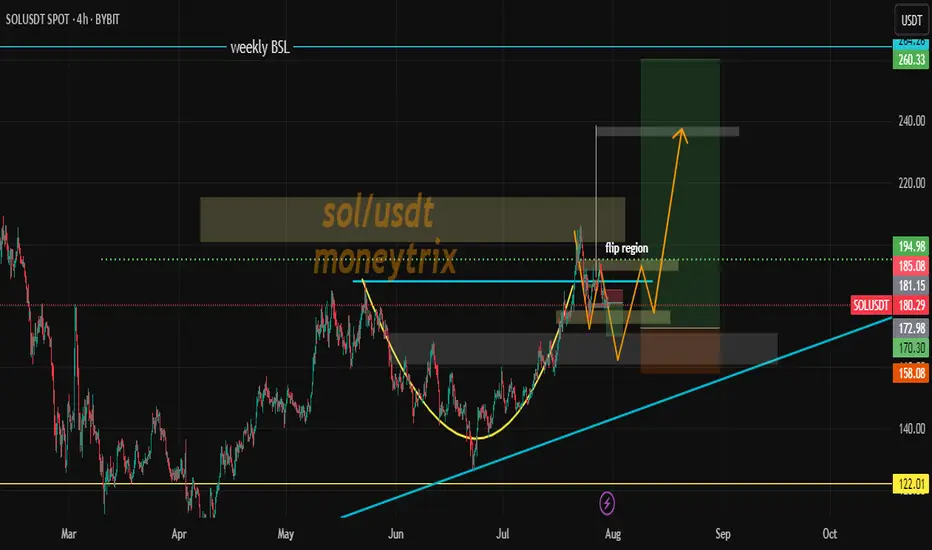
Short-Term "Counter-Short" Position A "counter-short" strategy, Short-Term "Counter-Short" Position
A "counter-short" strategy, also known as counter-trend trading, involves taking a short position against the prevailing short-term trend, anticipating a temporary reversal or correction. This is generally a high-risk, high-reward strategy that requires precise timing and strong risk management.
Long-term long positions on SOL/USDT with a cup and handle pattern aim for substantial gains after a period of consolidation. This strategy relies on identifying a well-formed bullish continuation pattern on higher timeframes, confirmed by volume, to indicate a strong upward trajectory for Solana. till previous ATH
EURCHF: Market of Buyers
Looking at the chart of EURCHF right now we are seeing some interesting price action on the lower timeframes. Thus a local move up seems to be quite likely.
Disclosure: I am part of Trade Nation's Influencer program and receive a monthly fee for using their TradingView charts in my analysis.
❤️ Please, support our work with like & comment! ❤️
