#ETH/USDT SETUP ,Bought From $4003#ETH
The price is moving within an ascending channel on the 1-hour frame, adhering well to it, and is on track to break it strongly upwards and retest it.
We have support from the lower boundary of the ascending channel, at 3700.
We have a downtrend on the RSI indicator that is about to break and retest, supporting the upside.
There is a major support area in green at 3711, which represents a strong basis for the upside.
Don't forget a simple thing: ease and capital.
When you reach the first target, save some money and then change your stop-loss order to an entry order.
For inquiries, please leave a comment.
We have a trend to hold above the 100 Moving Average.
Entry price: 3811.
First target: 3867.
Second target: 3936.
Third target: 4003.
Don't forget a simple thing: ease and capital.
When you reach your first target, save some money and then change your stop-loss order to an entry order.
For inquiries, please leave a comment.
Thank you.
Wave Analysis

GOLD: Bearish Continuation & Short Trade
GOLD
- Classic bearish pattern
- Our team expects retracement
SUGGESTED TRADE:
Swing Trade
Sell GOLD
Entry - 3331.7
Stop - 3334.0
Take - 3327.0
Our Risk - 1%
Start protection of your profits from lower levels
Disclosure: I am part of Trade Nation's Influencer program and receive a monthly fee for using their TradingView charts in my analysis.
❤️ Please, support our work with like & comment! ❤️

BTCUSDT - UniverseMetta - Signal#BTCUSDT - UniverseMetta - Signal
D1 - Formation of potential 3rd wave from the level in continuation of the 5th wave on W1. Stop behind the maximum of the 2nd wave.
Entry: 119823.70
TP: 123162.36 - 128518.11 - 131787.21 - 137038.63
Stop: 116693.72

$VRANASDAQ:VRA on daily time frame non logarithmic chart pattern is showing sign of break out. are we going to break. lets wait and find out

EURUSD Set To Grow! BUY!
My dear followers,
This is my opinion on the EURUSD next move:
The asset is approaching an important pivot point 1.1557
Bias - Bullish
Technical Indicators: Supper Trend generates a clear long signal while Pivot Point HL is currently determining the overall Bullish trend of the market.
Goal - 1.1632
About Used Indicators:
For more efficient signals, super-trend is used in combination with other indicators like Pivot Points.
Disclosure: I am part of Trade Nation's Influencer program and receive a monthly fee for using their TradingView charts in my analysis.
———————————
WISH YOU ALL LUCK

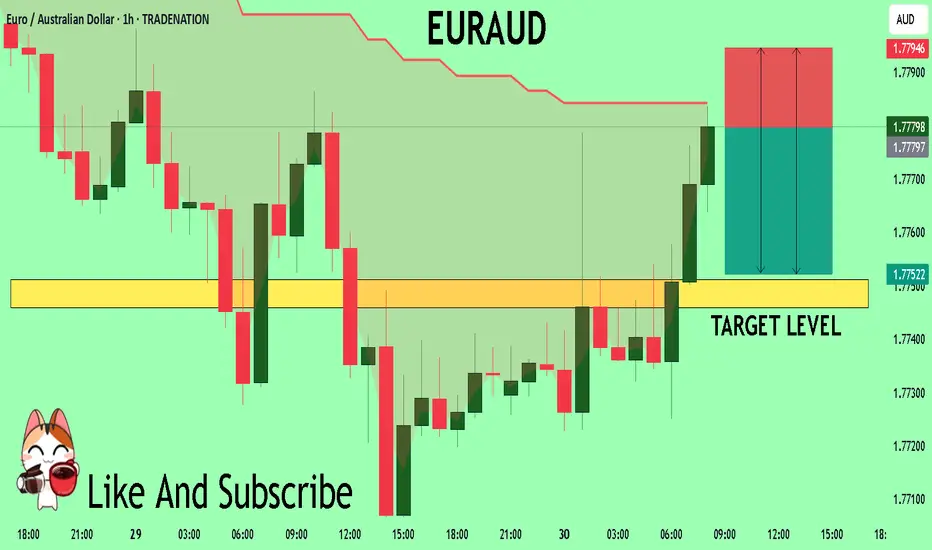
EURAUD Under Pressure! SELL!
My dear followers,
I analysed this chart on EURAUD and concluded the following:
The market is trading on 1.7780 pivot level.
Bias - Bearish
Technical Indicators: Both Super Trend & Pivot HL indicate a highly probable Bearish continuation.
Target - 1.7751
Safe Stop Loss - 1.7794
About Used Indicators:
A super-trend indicator is plotted on either above or below the closing price to signal a buy or sell. The indicator changes color, based on whether or not you should be buying. If the super-trend indicator moves below the closing price, the indicator turns green, and it signals an entry point or points to buy.
Disclosure: I am part of Trade Nation's Influencer program and receive a monthly fee for using their TradingView charts in my analysis.
———————————
WISH YOU ALL LUCK
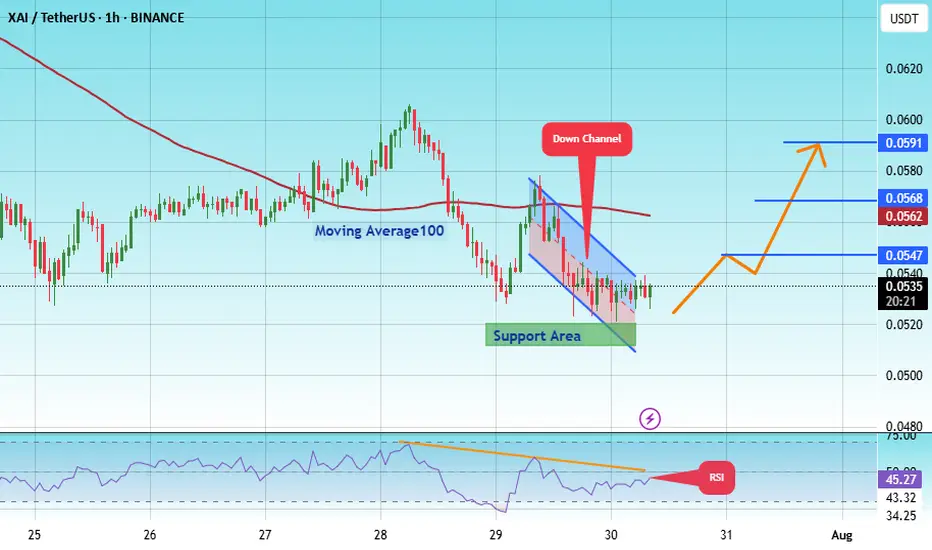
#XAI/USDT breakout Buy breakout,#XAI
The price is moving within an ascending channel on the 1-hour frame, adhering well to it, and is on its way to breaking strongly upwards and retesting it.
We have support from the lower boundary of the ascending channel, at 0.0511.
We have a downtrend on the RSI indicator that is about to break and retest, supporting the upside.
There is a major support area in green at 0.0513, which represents a strong basis for the upside.
Don't forget a simple thing: ease and capital.
When you reach the first target, save some money and then change your stop-loss order to an entry order.
For inquiries, please leave a comment.
We have a trend to hold above the 100 Moving Average.
Entry price: 0.0591.
First target: 0.0547.
Second target: 0.0568.
Third target: 0.0591.
Don't forget a simple thing: ease and capital.
When you reach your first target, save some money and then change your stop-loss order to an entry order.
For inquiries, please leave a comment.
Thank you.
Dow Jones US30 Trend Analysis and Trade Plan Breakdown📈 US30 (Dow Jones) is currently in a strong bullish trend 🔥. This is clearly visible on the 4H chart, where we’re seeing a consistent pattern of higher highs and higher lows 🔼🔼.
👀 I’m watching for a potential long opportunity, especially since the higher timeframes remain firmly bullish 🟢.
🎥 In the video, we break it down:
A quick overview of the 4-hour structure
Then dive into a potential trade setup on the 30-minute chart ⏱️🔍
🧠 This is for educational purposes only and not financial advice ⚠️📚

NZDUSD potential 600 pips in makingPrice of NZDUSD have made a structure that has a high probability to be a triangle just after a leading diagonal. If this view is favored then we should expect price to regain its bullish momentum to make wave C. To take advantage of this possibility a trade should find areas of support to go long. One of the places is as marked on the chart on lower trendline of the triangle.

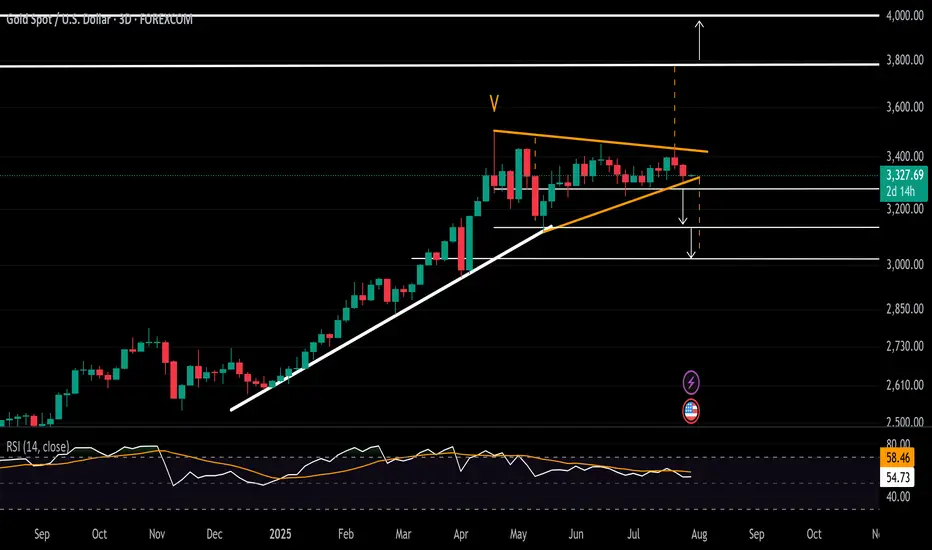
Gold Eyes Breakout From 3-Month Consolidation After reaching its record high of 3500 in April 2025, Gold entered a contracting consolidation phase for more than 3 months now, bounded between the 3500 resistance and 3100 support. This structure sets the stage for a breakout, with price action tracing five waves—raising the probability of another leg higher.
• Bullish Scenario: A close above the 3450 level could open the door to 3780 and even 4000, aligning with the broader monthly cup-and-handle formation target.
• Bearish Scenario: A close below 3300 could expose the market to downside risks, with potential retracements to 3280, 3250, 3200, and 3130.
Written by Razan Hilal, CMT
EurUsd Going Bullish 20 to 30 pipsEur usd now buy mode 20 to 30 pips .
If anyone wanted to learn this System Analysis contrect with me .

[XAUUSD – Intraday Price Action Outlook | 30 July 2025Gold (XAUUSD) is currently trading around 3,329 USD and is consolidating within a narrow rising channel after completing a significant downtrend. The market is showing signs of a potential breakout, either to continue a short-term bullish correction or resume the dominant bearish momentum.
Key Technical Zones:
Resistance zone: 3,339.2 – 3,348
This is a critical zone where bullish breakout confirmation is likely to attract momentum buyers. The zone aligns with upper trendline resistance and previous consolidation highs.
Support zone: 3,325.6 – 3,292.7
This range acts as a short-term support base, marked by multiple rejections and aligned with the lower boundary of the current rising wedge formation. A breakdown here could trigger strong bearish continuation.
Indicators & Confluences:
EMA200 (blue): Acting as dynamic resistance, slightly above current price.
EMA50 & EMA100: Compressing toward current price action, indicating price equilibrium and coiling volatility.
RSI (not shown): Likely hovering near 50 – signaling market indecision.
Fibonacci 0.874 has been tagged – often a zone where false breakouts or liquidity grabs occur, demanding caution.
Trading Strategy Suggestions:
Bullish Scenario (Breakout Strategy)
Entry: Buy only if price closes above 3,339.2 (confirmed breakout of wedge).
Stop-loss: Below 3,328.1 (previous supply turned demand).
Target: 3,370 – 3,392 zone (aligned with EMA200 breakout & prior structure).
Note: This setup relies on confirmation and should not be anticipated early. Wait for candle close above 3,339.2 to invalidate current wedge structure.
Bearish Scenario (Rejection & Breakdown Strategy)
Entry: Sell if price rejects 3,330–3,332 area and returns below 3,327.80 (as marked).
Stop-loss: Above 3,332.04 (above trendline and EMA cross).
Target: 3,292.74 (volume node + base of channel).
Risk/Reward: >7.0 (based on current tool parameters shown in chart).
This is a favorable setup if price respects current wedge resistance and fails to breakout convincingly.
Conclusion:
Gold is at a decisive point. The formation of a rising wedge in a prior downtrend signals potential bearish continuation, but a breakout above 3,339.2 could trigger a reversal short-term. Both bulls and bears need confirmation before entering. Monitor volume closely — rising volume on breakout/breakdown will validate either scenario.

20250730-XAUUSD IdeaSupport was found at the key level of 3310. The ADP report is scheduled to be announced at 8:15 p.m. today. Monitoring whether the price continues to break lower or begins an ABC retracement following the strong downward impulse.

XRPUSDT ShortWe´ve just finished the 5th wave of the bullish structure and started a 5 wave corrective structure for a bigger ABC correction. Right now we´re in the 4th wave and exspecting one more bearish move into the yellow area

bullish move can start. good risk reward swing tradePerfect spot to buy as comppany has also shown positive quaterly result.
small time swing trade

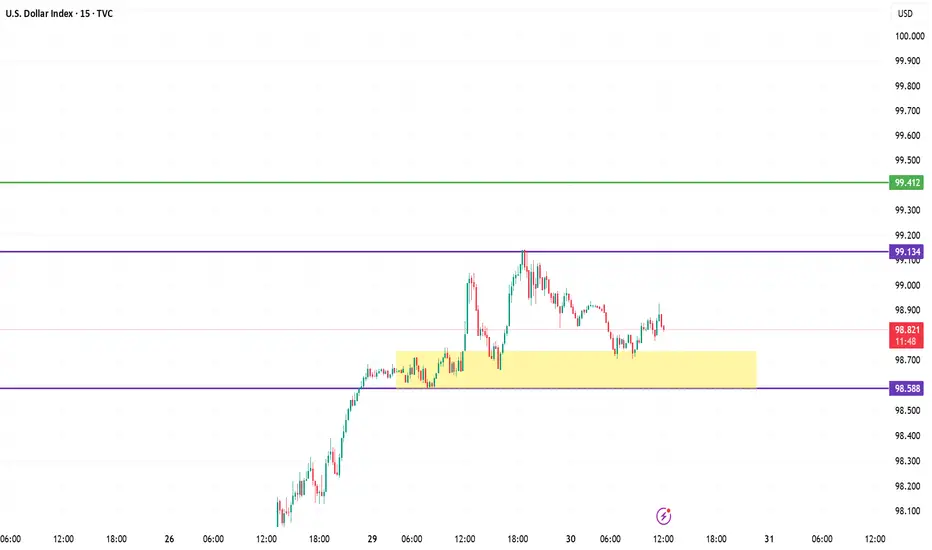
U.S. Dollar Index (DXY) – July 30, 2025 | 15-Min Chart1. **Range-Bound Structure**
DXY is consolidating between 98.588 support and 99.134 resistance. The 98.68–98.74 zone has acted as demand, but repeated retests show weakening buyer interest.
2. **Failed Breakouts**
Multiple rejections at 99.134 indicate it's a trap zone where sellers absorb buy-side pressure.
3. **Bearish Momentum Signs**
Lower highs and wicks into resistance with weak closes suggest distribution. Momentum likely shows bearish divergence.
4. **Critical Levels**
* **Support:** 98.588 — a break below this opens downside potential.
* **Resistance:** 99.134 — bulls need a strong breakout above this for continuation to 99.41+.
Summary:
Sellers dominate below 99.134. If 98.588 breaks, expect bearish continuation. Only a confirmed breakout above 99.134 shifts bias bullish.
AUDCAD Is Going Up! Long!
Take a look at our analysis for AUDCAD.
Time Frame: 12h
Current Trend: Bullish
Sentiment: Oversold (based on 7-period RSI)
Forecast: Bullish
The market is approaching a key horizontal level 0.896.
Considering the today's price action, probabilities will be high to see a movement to 0.905.
P.S
Please, note that an oversold/overbought condition can last for a long time, and therefore being oversold/overbought doesn't mean a price rally will come soon, or at all.
Disclosure: I am part of Trade Nation's Influencer program and receive a monthly fee for using their TradingView charts in my analysis.
Like and subscribe and comment my ideas if you enjoy them!

Get Ready to Sell...I'm expecting another swing high (probably by FOMC upcoming statement) just before a an almost 80% drop!
Get ready to sell your PEPE and other crypto before the huge drop.
YOU HAVE BEEN WARNED !!!


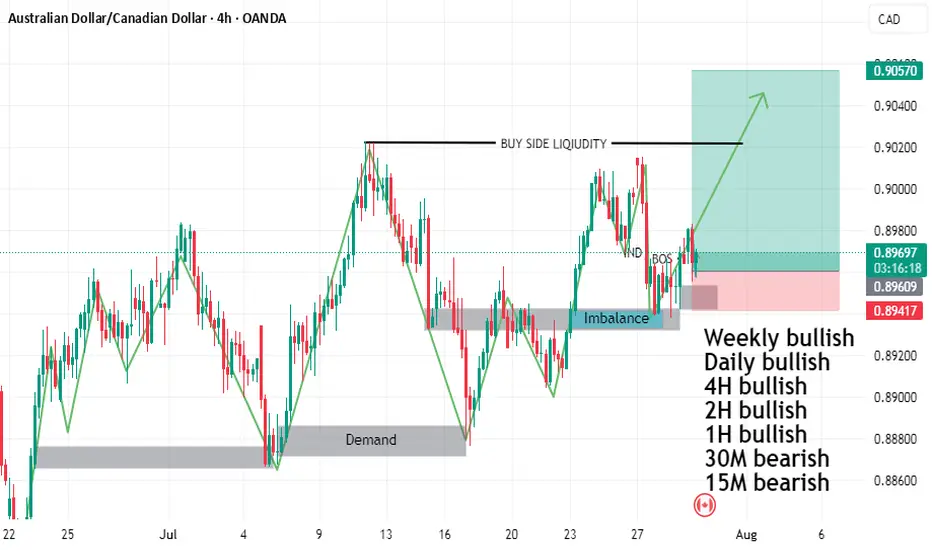
AUDCAD BUY SETUPTHE PRICE FORMED HEAD AND SHOULDER
and do rejection from mitigation order block and imbalance
and we have liquidity on time frame daily buy side liquidity
and time frame weekly double top
so I will buy with you
DON'T forget to follow me so that get more refresh analysis
NZD/USD SELLERS WILL DOMINATE THE MARKET|SHORT
Hello, Friends!
NZD-USD uptrend evident from the last 1W green candle makes short trades more risky, but the current set-up targeting 0.594 area still presents a good opportunity for us to sell the pair because the resistance line is nearby and the BB upper band is close which indicates the overbought state of the NZD/USD pair.
Disclosure: I am part of Trade Nation's Influencer program and receive a monthly fee for using their TradingView charts in my analysis.
✅LIKE AND COMMENT MY IDEAS✅

perfect buying spot with risk reward of 1 : 6buy at 470 to 475 levels
sl 458 daily candle closing basis
target 570

Gold annalize Majid babai aslMy predictions about gold in previous years have been quite accurate and calculated. Currently, I think a wave 4 correction, which is a micro-wave, is taking place. As we can see, this micro-wave will probably decrease between $2,700 and $3,000 and then advance to targets above $4,000. Majid Babaei Tehran August 1404
